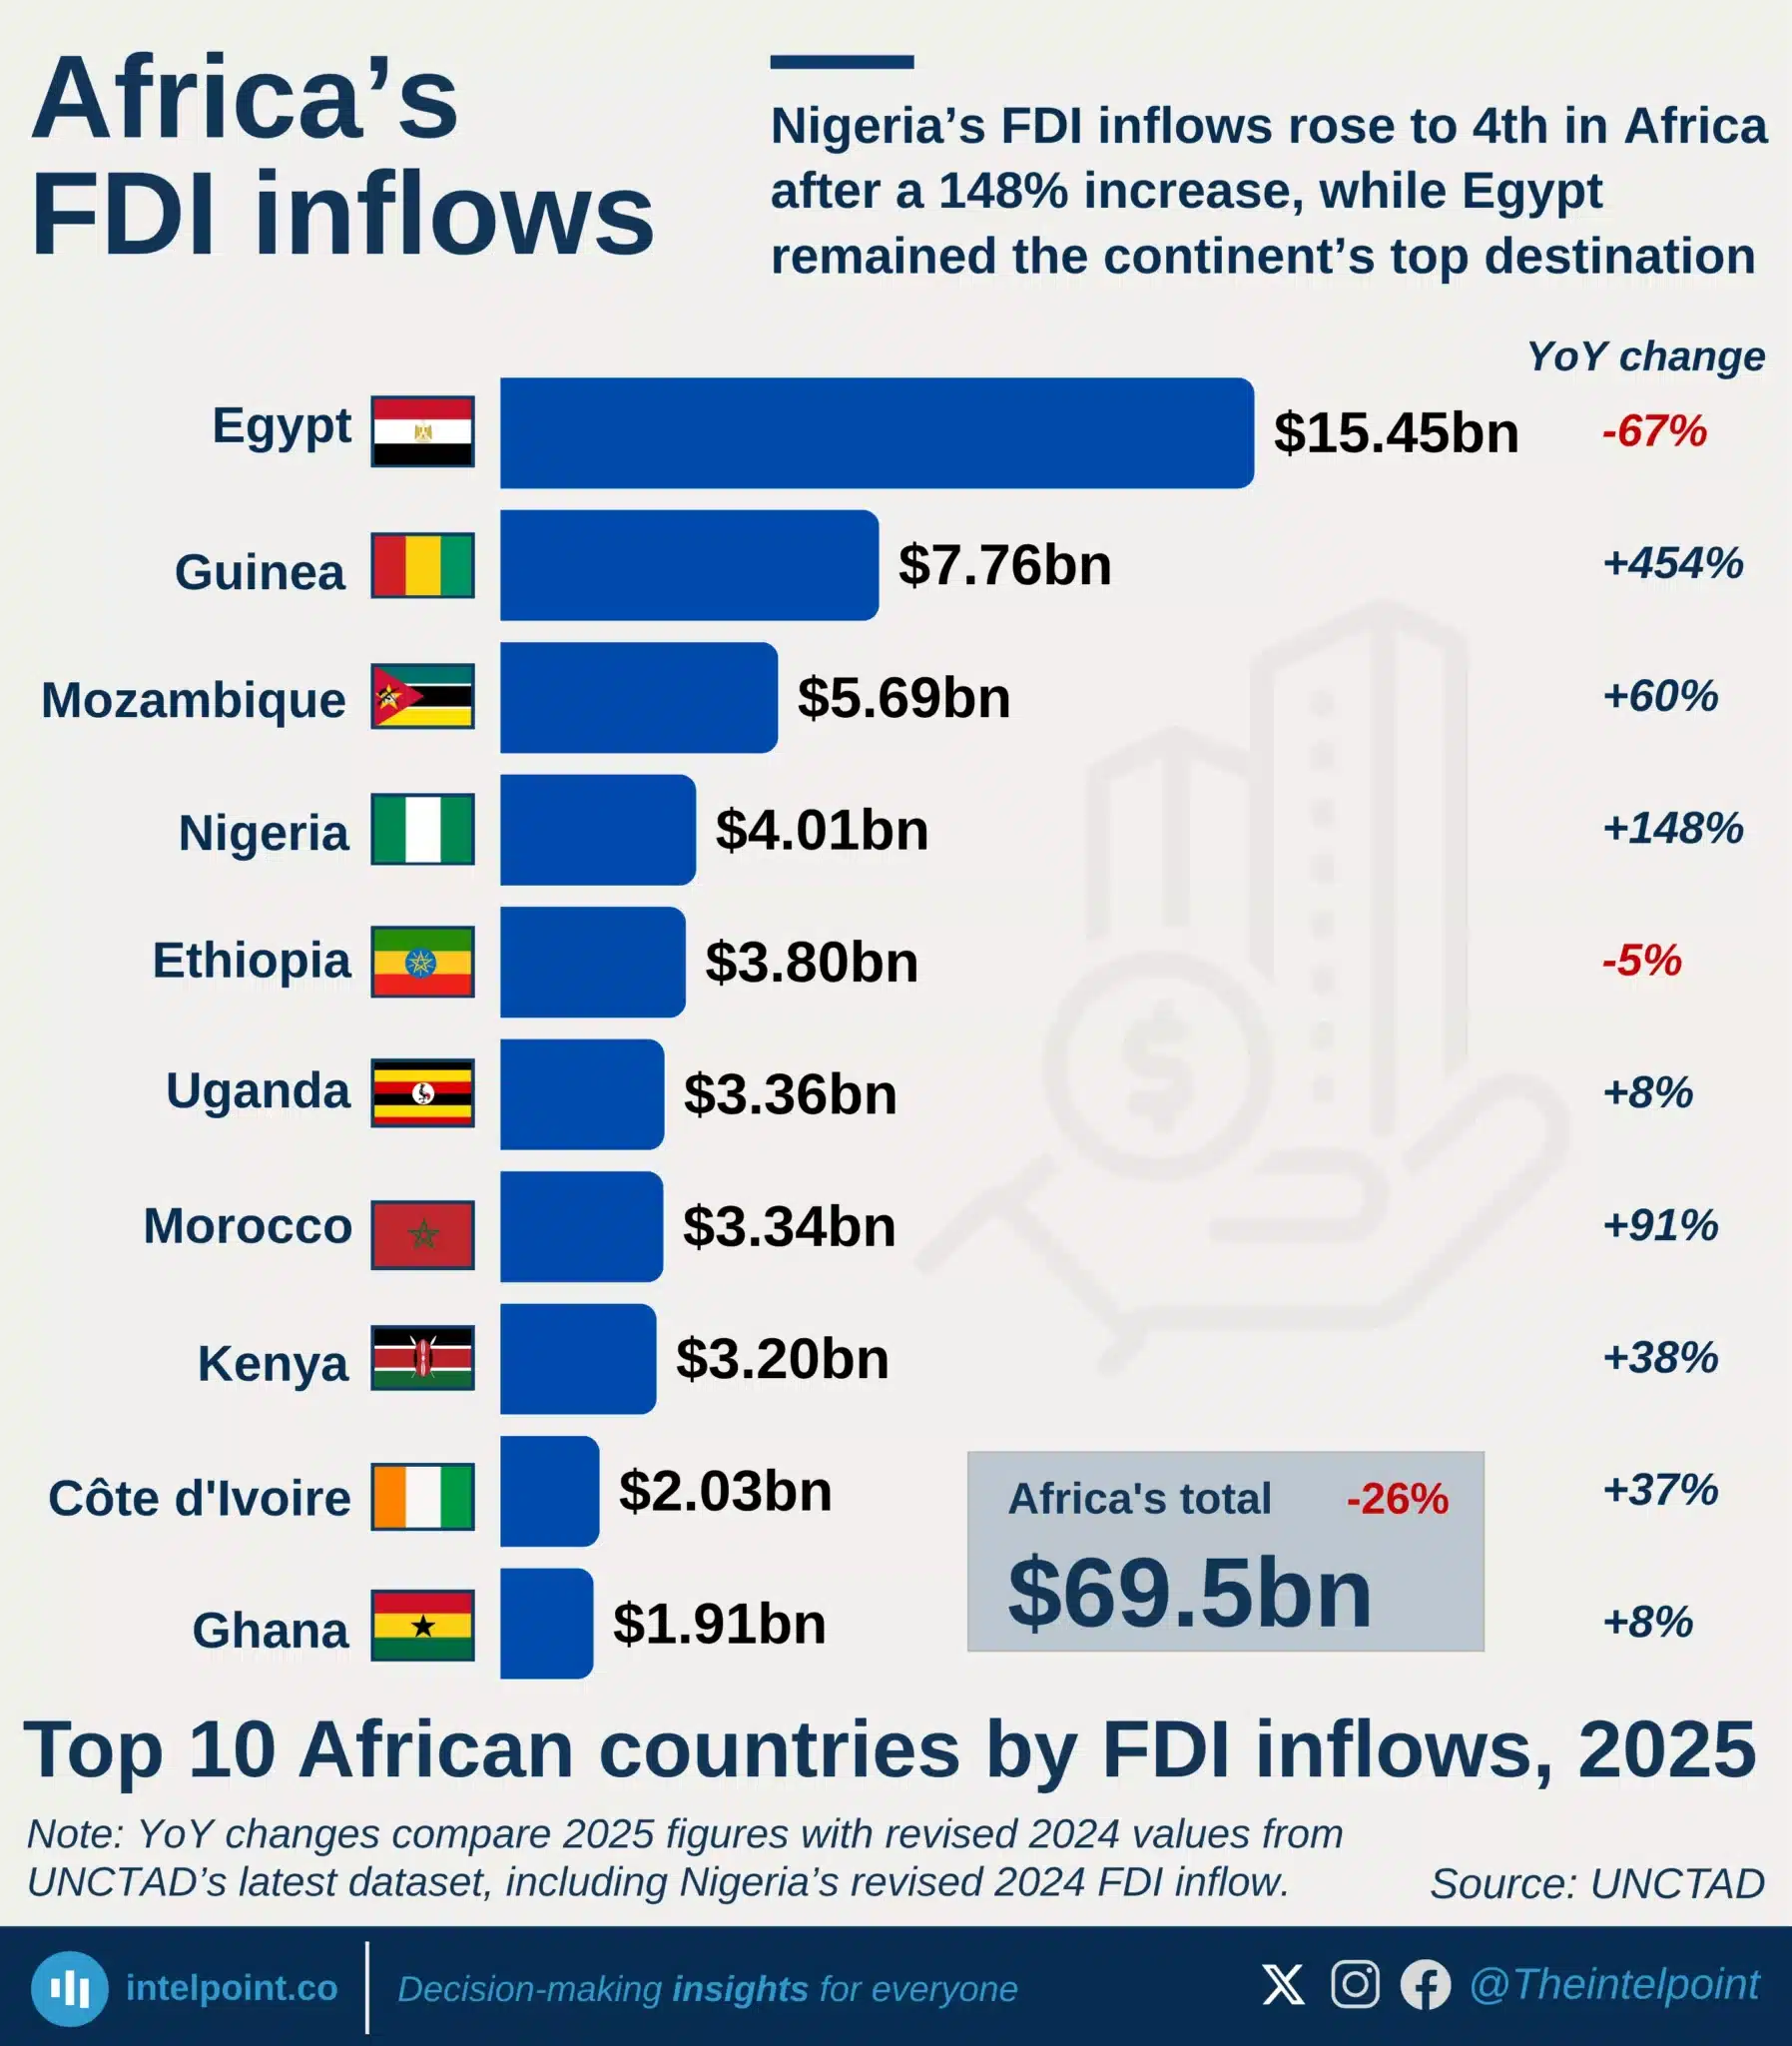
Egypt remained Africa’s top FDI destination with $15.45bn.
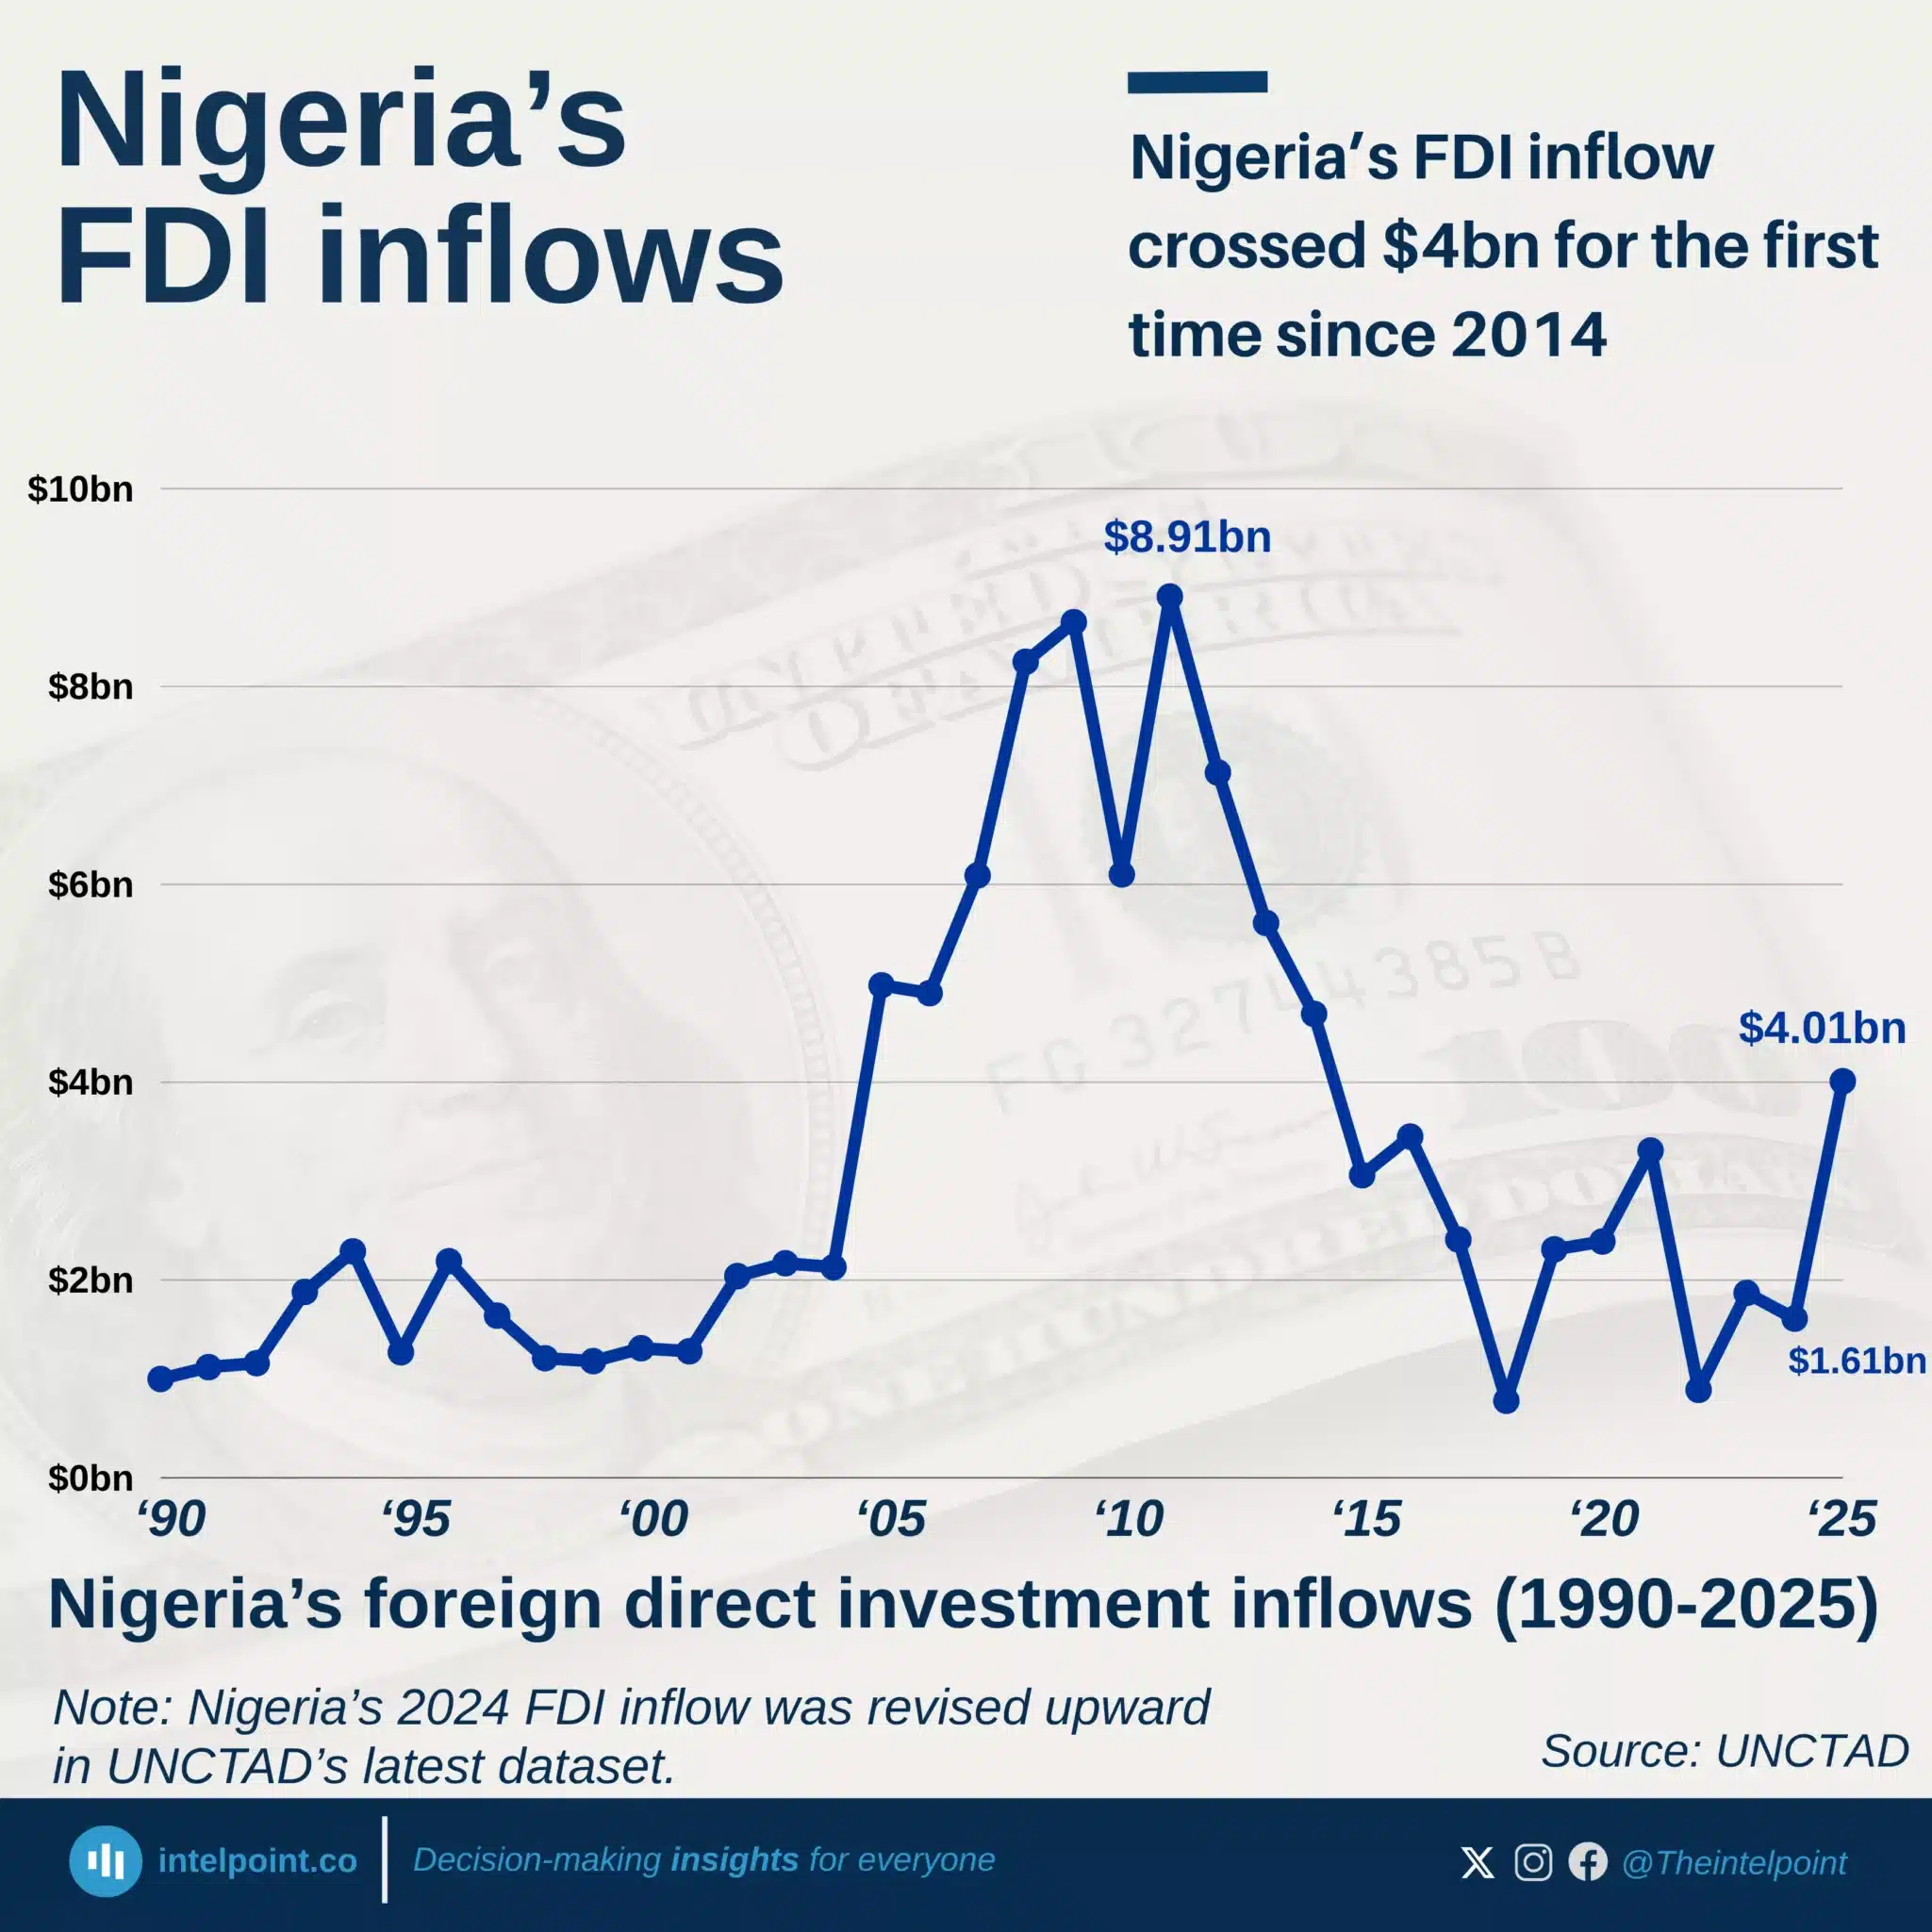
Nigeria ranked 4th after FDI inflows rose 148% to $4.01bn.
Guinea had the biggest top-10 jump, rising 454% to $7.76bn.
Africa’s top 10 accounted for 73% of total FDI inflows.
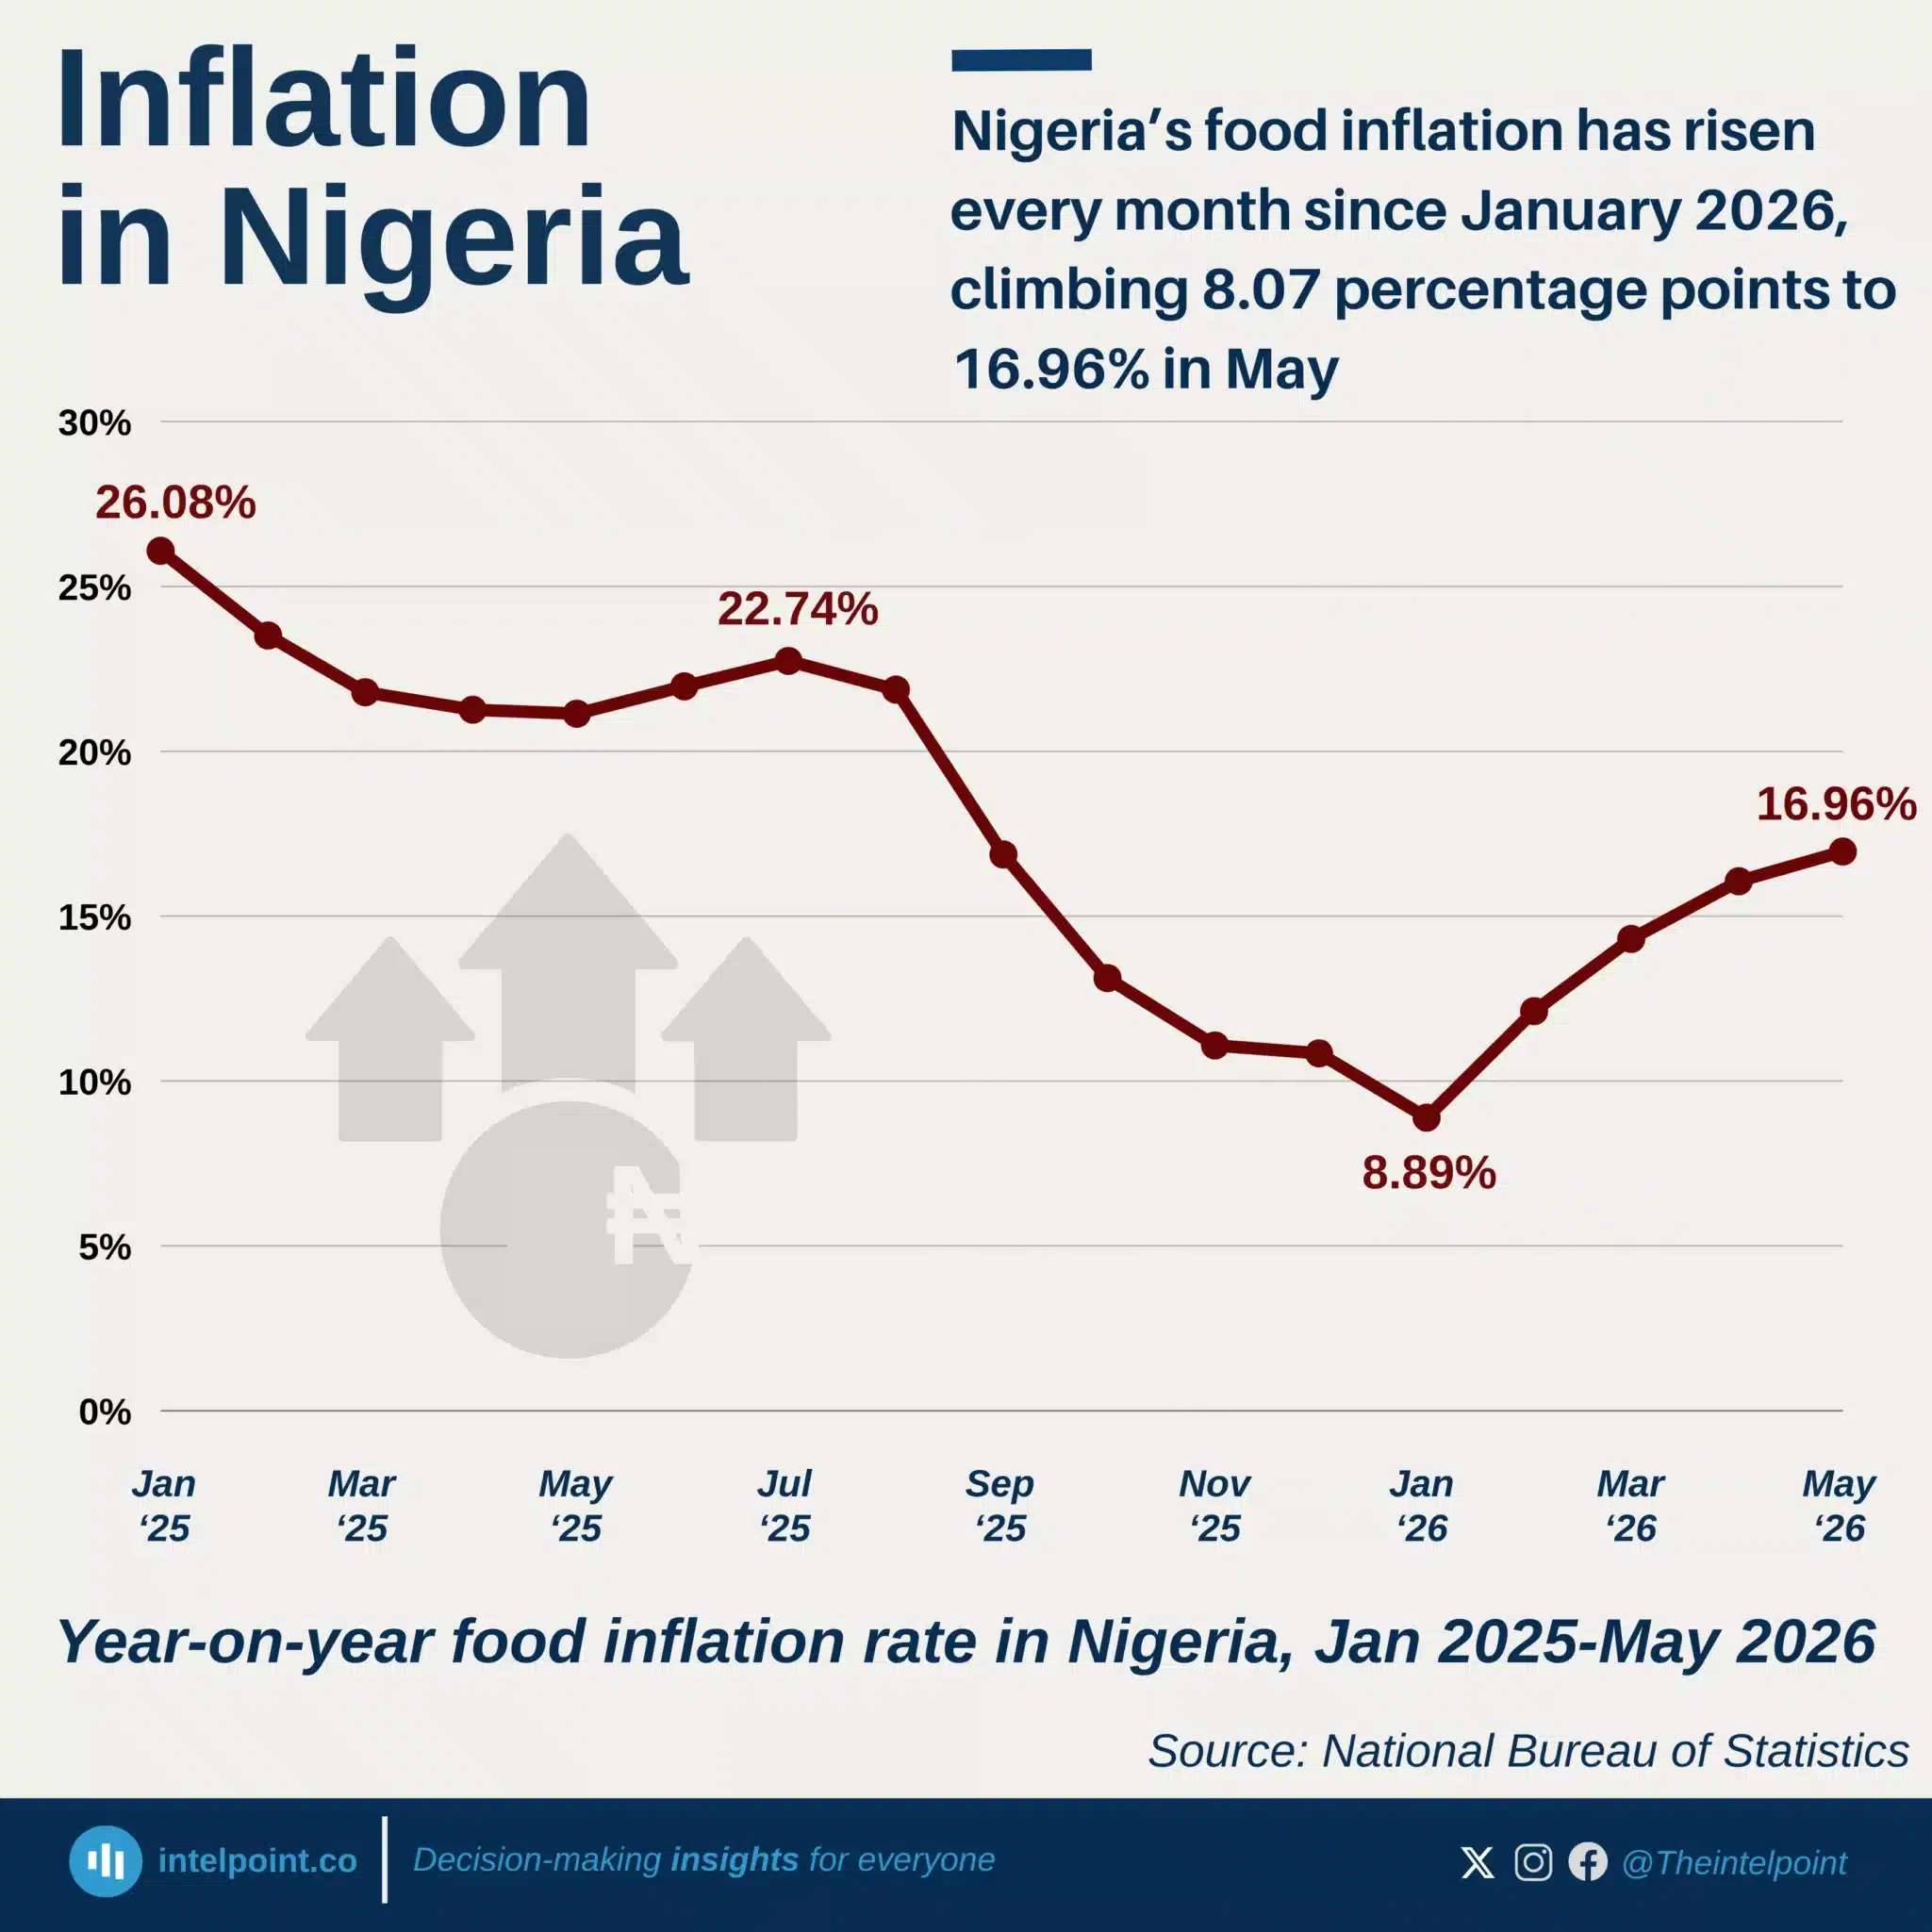
Nigeria’s year-on-year food inflation rose for the fourth consecutive month, from 8.89% in January 2026 to 16.96% in May.
The rate increased by 8.07 percentage points within the first five months of 2026.
May’s 16.96% rate means food prices were, on average, 16.96% higher than they were in May 2025.
Food inflation rose from 12.12% in February to 14.31% in March and 16.06% in April before reaching 16.96% in May.
Food inflation exceeded Nigeria’s 15.93% headline inflation rate in May, showing that food was a major source of renewed pressure on household expenses.