Bite-sized Insights about
 
Providing you with data-based insights about things happening around you.
Ethiopia’s renewable energy capacity grew at an 8.6% compound annual rate from 2015 to 2024
  • Ethiopia’s renewable capacity grew from 2.6 GW in 2015 to 6.0 GW in 2024.
  • The country achieved an 8.6% compound annual growth rate over this period.
  • Ethiopia’s capacity is higher than Nigeria’s 3.7 GW in 2024, despite Nigeria’s larger economy.
  • The biggest surge occurred in 2017, with a 64.9% year-over-year increase.
  • Growth was steady but modest between 2017 and 2021, averaging small annual increments.
  • A slight dip occurred in 2023, but Ethiopia recovered to 6.0 GW in 2024.

After years of growth, Angola's renewable capacity stagnated at 4.1 GW from 2022 to 2024
  • Angola’s renewable energy capacity grew from 1.0 GW in 2015 to 4.1 GW in 2024.
  • Growth has stagnated at 4.1 GW for three consecutive years (2022–2024).
  • Angola recorded an 8.6% compound annual growth rate (CAGR) between 2015 and 2024.
  • The most considerable yearly increase was in 2016, with a sharp 71.8% growth.
  • Growth slowed to single digits after 2019, indicating a decline in momentum.
  • In 2022 and 2023, growth was flat at 0.0% and 0.6% respectively.
  • Despite stagnation, Angola’s renewable capacity in 2024 (4.1 GW) remains higher than Nigeria’s 3.7 GW.

South Africa leads Africa with 13.5 GW of renewable energy capacity
  • South Africa leads Africa with 13.5 GW of renewable energy capacity, the highest on the continent.
  • Egypt follows closely with 11.8 GW, making North Africa a dominant player in the sector.
  • Ethiopia stands out in East Africa with 6 GW of renewable capacity.
  • Nigeria, Africa’s largest economy, ranks 7th with 3.7 GW.
  • The difference between the top performer (South Africa) and the lowest (Niger) is more than 6,000 times in renewable capacity.

Lagos alone consumes 26% of the total supply of power from the national grid
  • Lagos receives the highest average monthly grid supply at 1,051 MW, accounting for 26% of national distribution.
  • The South West (excluding Lagos) comes second with 569 MW.
  • Abuja alone receives 435 MW, higher than the North Central zone at 396 MW.
  • The North East receives the least electricity from the grid, with only 199 MW monthly on average.
  • The combined total for Lagos and the rest of the South West is 1,620 MW, roughly 40% of national grid supply.

Despite raising renewable energy capacity to 70 GW, Africa's share of the global total is declining
  • Africa’s renewable energy capacity more than doubled between 2015 (34.6 GW) and 2024 (70 GW).
  • Despite this growth, Africa’s global share fell from 1.87% in 2015 to 1.57% in 2024.
  • The decline in global share highlights that other regions are expanding renewable energy capacity much faster than Africa.
  • Between 2020 and 2024 alone, Africa added 18.5 GW of renewable energy capacity.
  • The sharpest annual increase occurred between 2022 and 2023, with capacity rising by 6.4 GW.
  • The percentage share of global renewable energy for Africa has consistently trended downward since 2018.
  • Africa’s renewable energy growth, while positive, is not yet keeping pace with the global energy transition.

Asia's renewable energy capacity grew by 21.1% to 2,374 GW in 2024, the highest among regions
  • Asia added 413 GW in one year, marking the most significant renewable energy expansion globally.
  • Asia’s 2024 renewable capacity is larger than the combined totals of all other regions indicated.
  • Europe reached 850 GW of installed capacity in 2024, consolidating its position as the second-largest renewable energy region.
  • North America’s renewable energy grew by 8.7% to 572 GW.
  • Oceania recorded a 12.9% growth rate, one of the highest relative increases despite its small base.
  • The Middle East achieved 10.8% growth, reflecting increased investments in solar and wind energy.
  • Africa’s renewable energy grew modestly to 70 GW.
  • Central America & the Caribbean recorded no growth, staying at 19 GW, making it the only stagnant region in 2024.

In the last one year, petrol prices in Nigeria fluctuated, reaching the maximum average price (₦1,262) in March 2025, before dropping gradually
  • Petrol prices in Nigeria rose by 52% between August 2024 (₦830.5) and March 2025 (₦1,261.7).
  • The highest monthly increase was in September 2024 (+24.1%), while the sharpest drop came in April 2025 (-17.1%).
  • By July 2025, prices had eased to ₦1,025, still 23% higher than a year earlier.
  • NNPC retail outlets offered significantly lower prices than the national average, with Abuja as low as ₦880 at the March 2025 peak.
  • Dangote Refinery offered relatively competitive pricing, ranging from ₦840 to ₦899, creating an alternative supply option.

The United States led global natural gas production in 2024, with Algeria, Egypt, and Nigeria appearing in the top 20
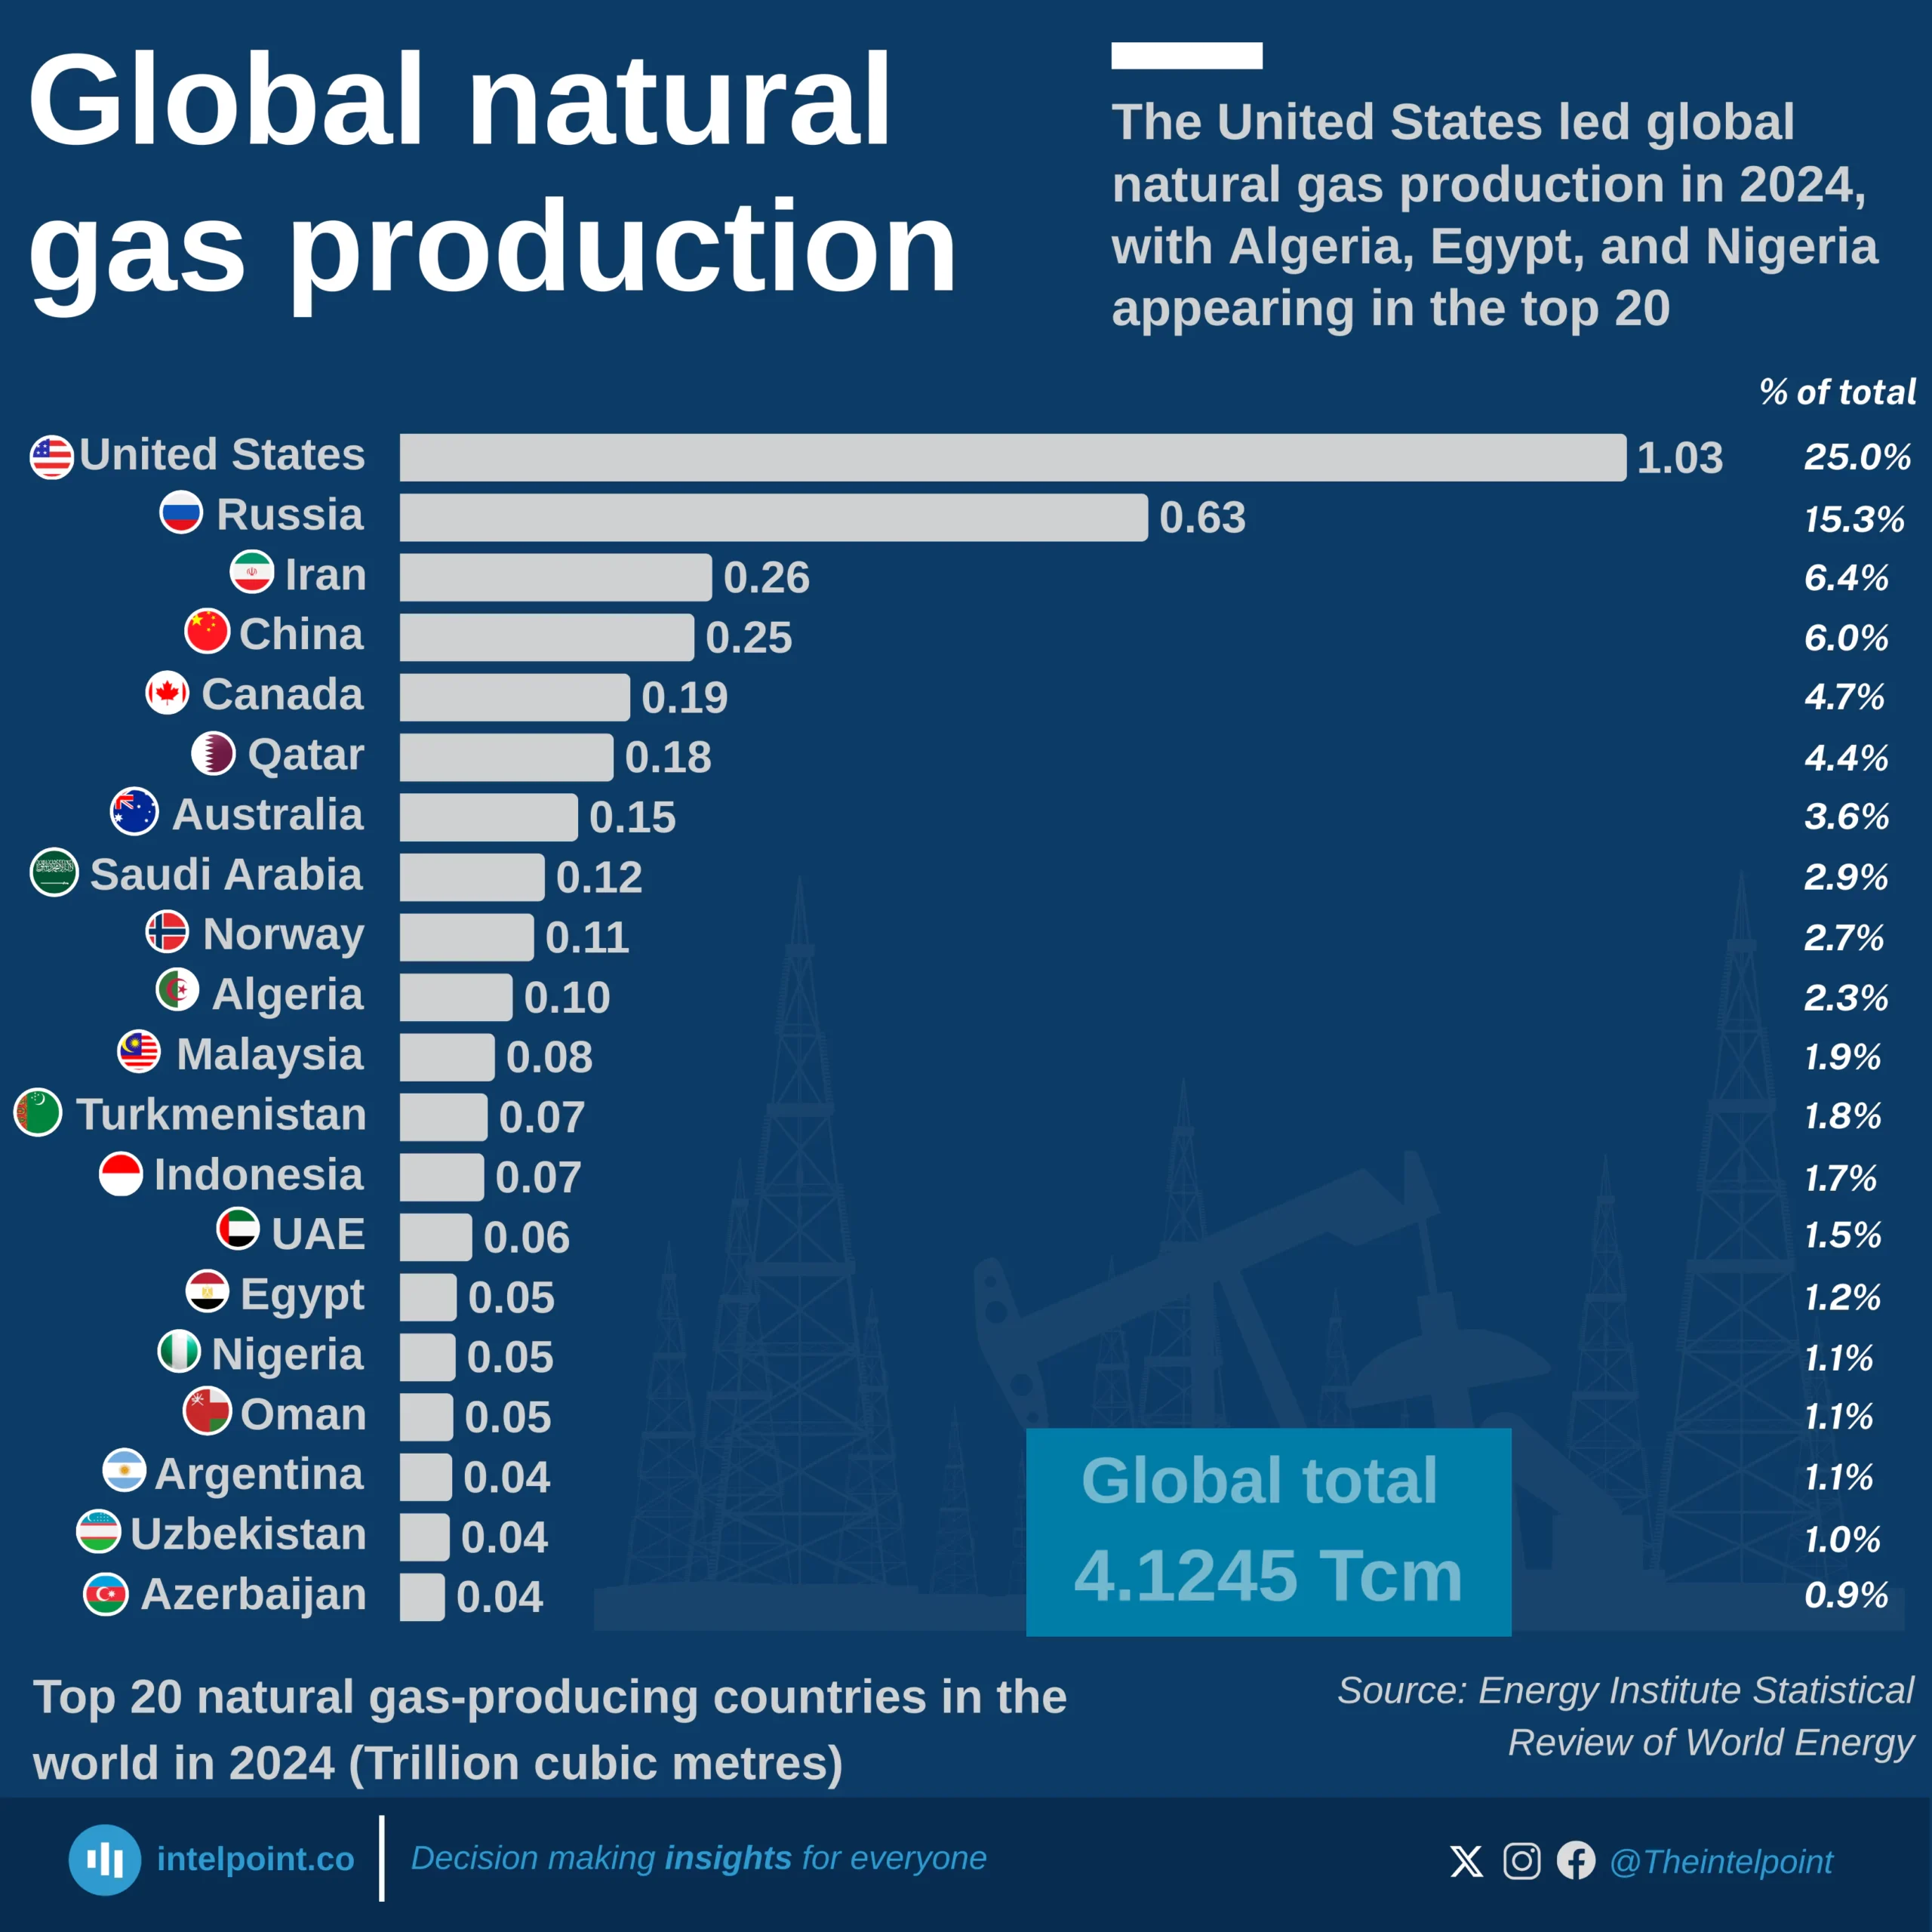
  • The United States dominates global natural gas production in 2024, contributing 1.03 trillion cubic metres (Tcm), nearly one-quarter of the world’s total.

  • Russia (0.63Tcm) and Iran (0.26Tcm) follow as the second and third largest producers.

  • China (0.25Tcm) and Canada (0.19Tcm) also feature strongly, rounding out the top five producers.

  • Collectively, these top five countries account for more than 50% of global production.

  • Emerging producers like Nigeria, Egypt, and Azerbaijan contribute significantly to the supply but remain far behind the leading nations.

Nigeria remained Africa’s top oil producer in 2024, contributing over 22% of the continent's production
  • Nigeria led with 78.9 Mtoe, accounting for over 22% of Africa’s total oil output.
  • Algeria (59.3 Mtoe) and Angola (57.4 Mtoe) followed closely; the three top producers together supplied] 56% of the continent’s oil.
  • Africa’s total oil production was 345.5 Mtoe, just 7.6% of the global total (4,542.7 Mtoe).
  • The top 5 producers accounted for over 80% of Africa’s oil.

The United States dominated the production of gas oil in 2023 with 234,886 metric tons, securing 32.4% of the global total
  • The United States of America dominated the production of gas oil with 234,886 metric tons, making up 32.4% of the global total in 2023.
  • Only four countries in Africa, Niger, Chad, Ghana and Zambia, produced gas oil.
  • Africa barely produced 0.13% of the global total of gas oil.
  • Australia imported 25.1k metric tons of gas oil, making it the country with the highest quantity of gas oil import in 2023.

1 2 3 4 5 10

Can’t find what you’re looking for? Please fill the form below
Contact Form Demo
SIGN UP TO OUR NEWSLETTER
Get periodic updates about the African startup space, access to our reports, among others.
Subscribe Here
Subscription Form

A product of Techpoint Africa. All rights reserved