Despite raising renewable energy capacity to 70 GW, Africa's share of the global total is declining

  • Africa’s renewable energy capacity more than doubled between 2015 (34.6 GW) and 2024 (70 GW).
  • Despite this growth, Africa’s global share fell from 1.87% in 2015 to 1.57% in 2024.
  • The decline in global share highlights that other regions are expanding renewable energy capacity much faster than Africa.
  • Between 2020 and 2024 alone, Africa added 18.5 GW of renewable energy capacity.
  • The sharpest annual increase occurred between 2022 and 2023, with capacity rising by 6.4 GW.
  • The percentage share of global renewable energy for Africa has consistently trended downward since 2018.
  • Africa’s renewable energy growth, while positive, is not yet keeping pace with the global energy transition.

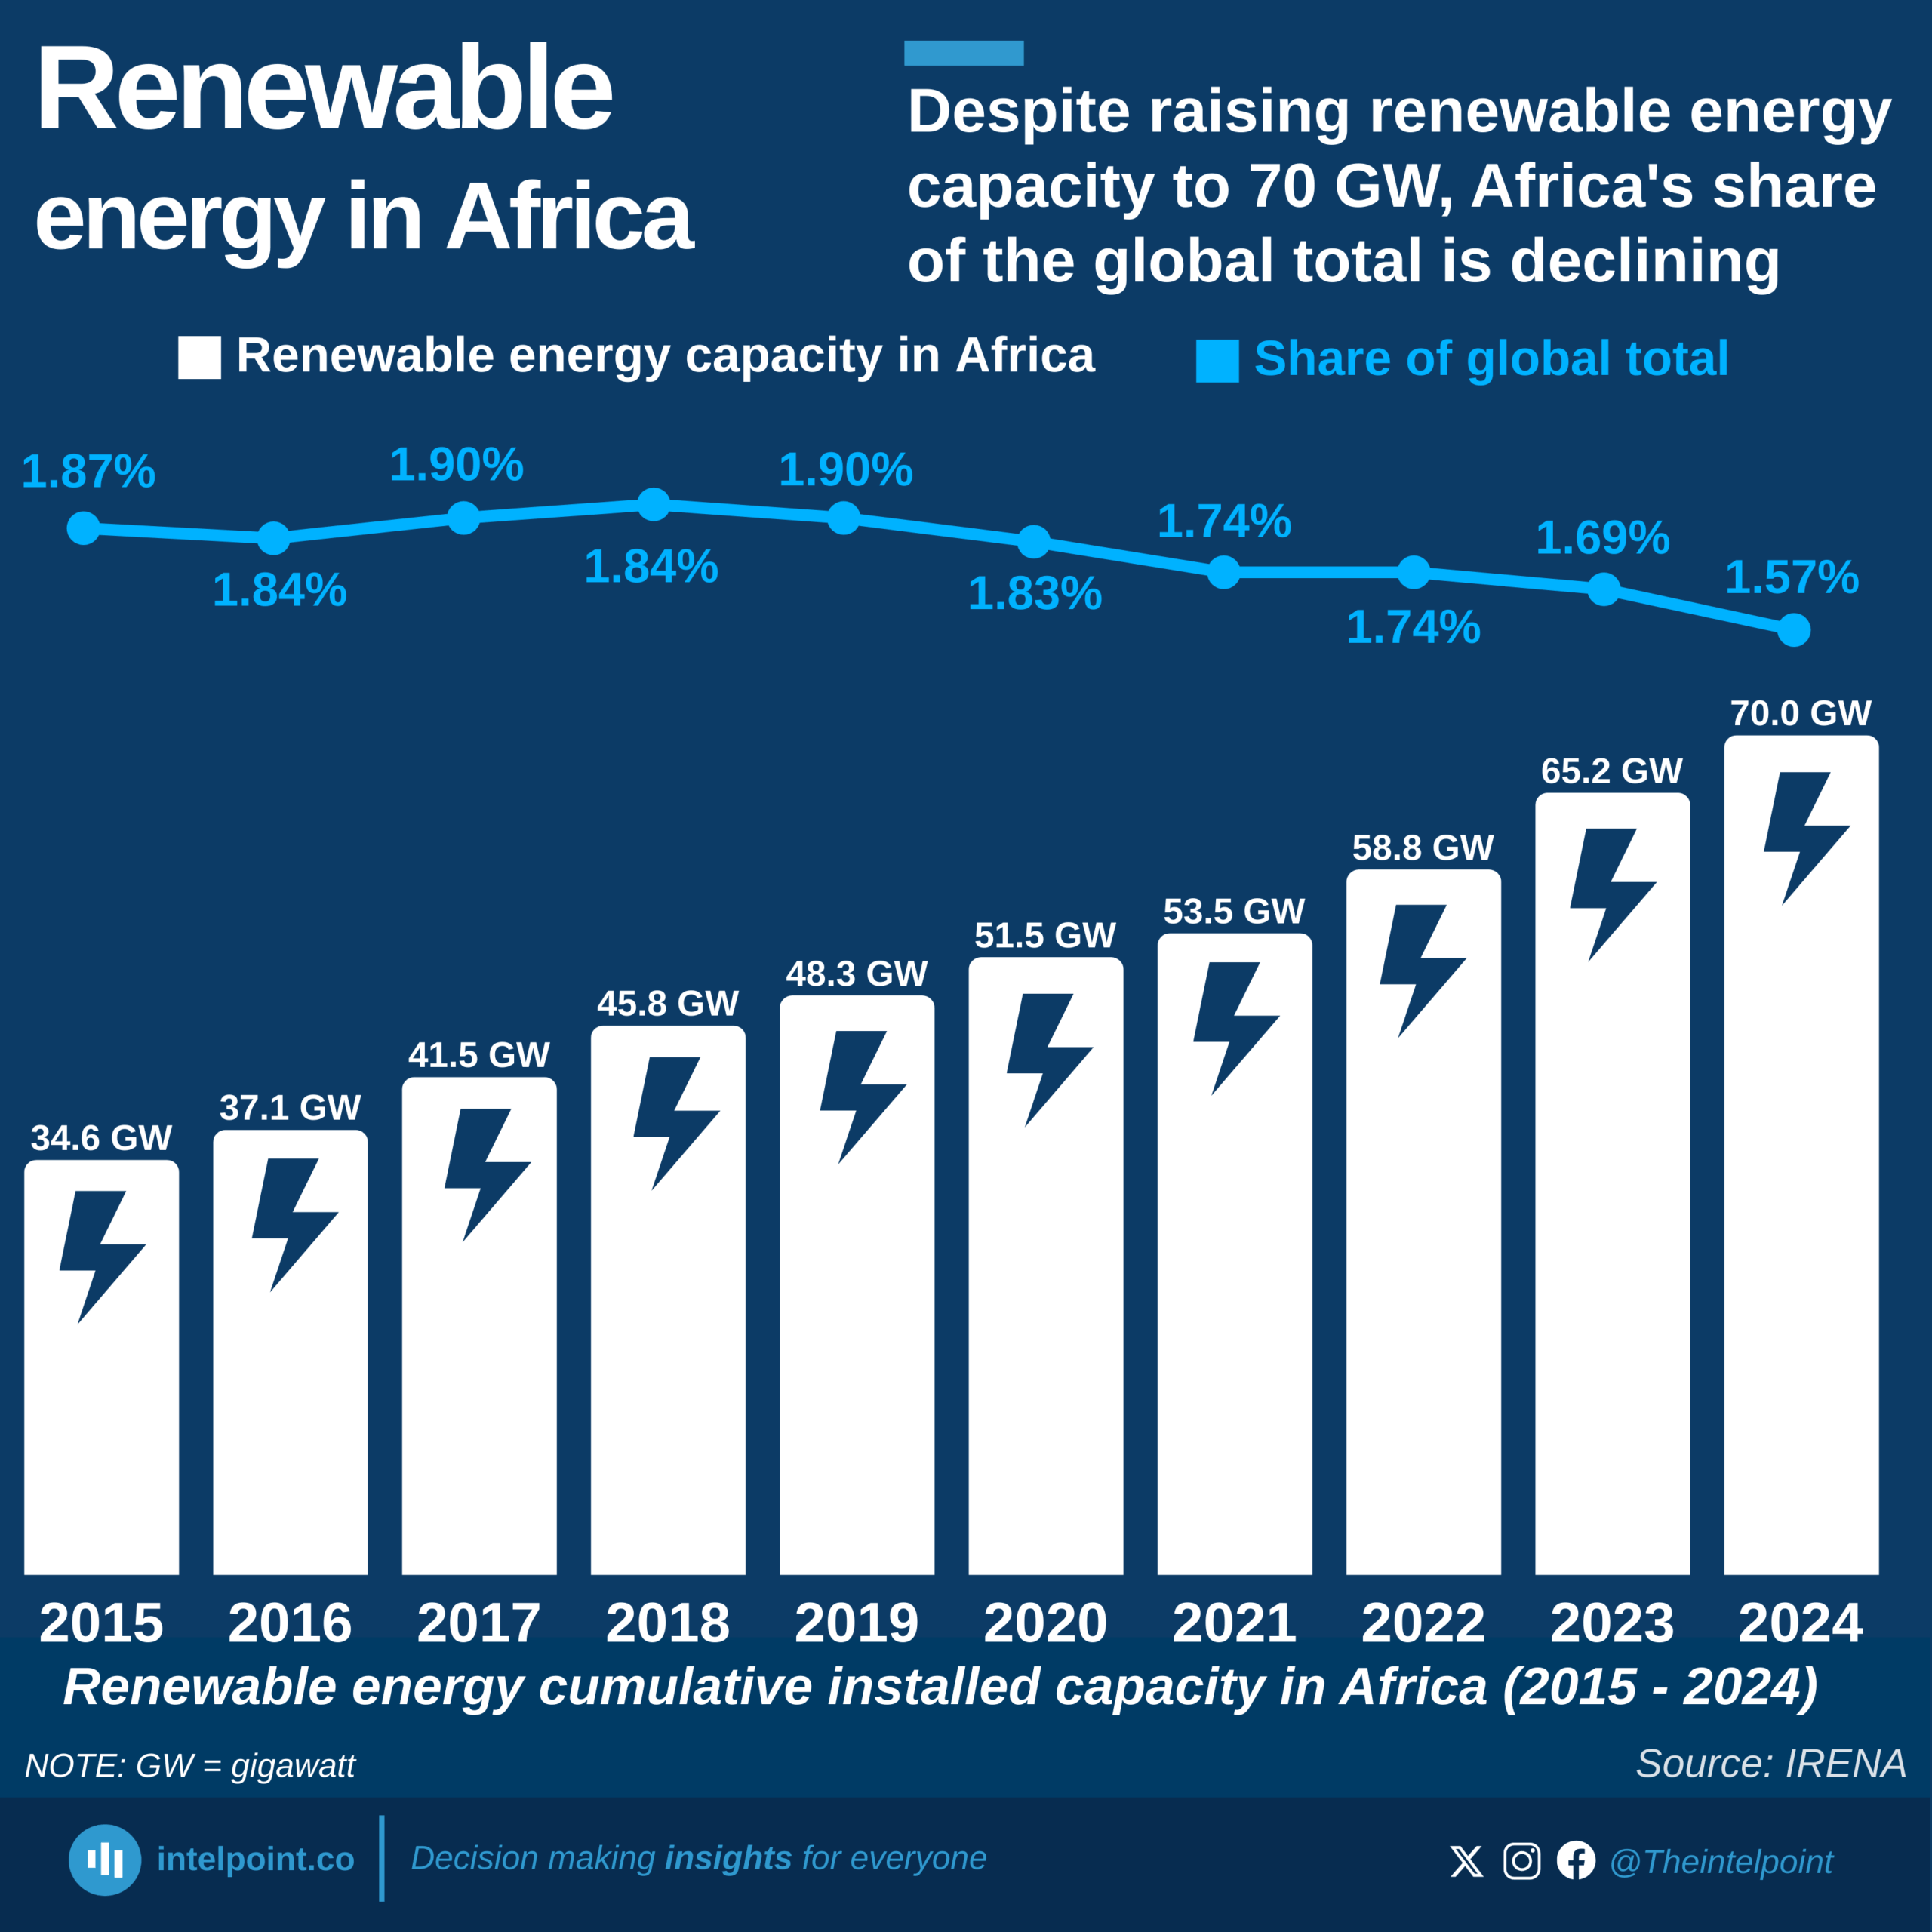
Africa’s renewable energy sector has experienced steady growth in installed capacity over the last decade, increasing from 34.6 GW in 2015 to 70 GW by 2024. This shows a commitment to expanding clean energy infrastructure across the continent.

However, while the volume has more than doubled, Africa’s share of global renewable energy capacity has actually declined. This reveals a concerning trend: other regions are accelerating their investments and scaling up much faster than Africa.

Source:

IRENA

Period:

2015-2024
HTML code to embed chart
Want a bespoke report?
Reach out
Tags
Related Insights

A 12.5kg cooking gas refill now costs over 6x what it did in 2016
  • A 12.5kg refill is now over 6x costlier than in 2016.
  • The April 2026 price reached ₦22.4k, up from ₦3.7k in January 2016.
  • Prices stayed fairly stable until 2021, then surged sharply.
  • Fresh reports suggest gas prices kept rising after April 2026.

Africa’s share of global oil consumption has stayed below 5% for six decades
  • Global oil consumption rose from about 30.9 million barrels per day in 1965 to 101.4 million barrels per day in 2024, more than tripling over the period.
  • Asia Pacific saw the biggest structural shift in global oil demand, increasing its share from 10.7% in 1965 to 37.9% in 2024 to become the world’s largest oil-consuming region.
  • Africa accounted for just 1.9% of global oil consumption in 1965 and 4.5% in 2024, staying below 5% for nearly 60 years.
  • The global centre of oil demand has gradually shifted away from Western economies toward Asia, reflecting industrialisation, urbanisation, and population growth across the region.
  • Africa’s modest share of global oil demand highlights the continent’s relatively low industrial energy consumption despite rapid population growth.

Africa's only nuclear power plant is producing half its 2016 peak
  • South Africa’s Koeberg has been Africa’s only commercial nuclear power station since 1984.
  • Africa produced just 7.8 TWh of nuclear power in 2024, far below France’s 380 TWh and the US’ 823 TWh.
  • Egypt’s El Dabaa plant could change Africa’s nuclear map, adding 4,800 MW when completed.
  • Africa’s nuclear challenge is no longer just generation, but whether countries can finance, regulate, build, and sustain nuclear programmes.

Nigeria's domestic gas market is absorbing an increasing share of the country's gas output
  • Domestic share rose steadily from 34% in 2021 to 45% in 2025, gaining eleven percentage points in five years.
  • Export share fell from 66% to 55%, losing ground every year without a single recovery.
  • 2023 was the sharpest single-year shift; domestic share jumped seven points, from 36% to 43%.
  • The gap between export and domestic share has narrowed from 32 to just 10 points.

Malacca and Hormuz handle about 24% and 22% of global oil supply, respectively
  • The Strait of Malacca is the world’s most important oil chokepoint, carrying about 24–25% of global oil supply in recent years.
  • The Strait of Hormuz moves around 20–23% of global oil supply, making it the second-largest energy transit chokepoint.
  • The Cape of Good Hope carries about 9–10% of global oil flows, and its share tends to increase when other chokepoints face disruptions.
  • The Bab el-Mandeb saw a sharp drop in oil flow share from about 9% in 2023 to around 4% in 2024, reflecting security concerns affecting shipping in the Red Sea corridor.
  • Oil transported through the Suez Canal and the SUMED pipeline system dropped significantly after 2023, falling from about 8.6% to below 5%, showing how quickly routes shift during geopolitical tensions.
  • The Strait of Malacca’s share has remained consistently high and stable, indicating its structural importance to Asian energy demand.
  • Alternative routes like the Cape of Good Hope in South Africa are longer but strategically crucial, especially when Middle Eastern chokepoints become unstable.

The national grid collapses an average of 7 times annually under Tinubu, down from 13 times under Buhari
  • The highest number of grid collapses in the past 16 years occurred in 2010, with 42 incidents recorded.
  • During Goodluck Jonathan’s administration, Nigeria’s grid collapsed an average of 24.4 times a year, the highest among the three administrations.
  • Under Muhammadu Buhari, the annual average dropped to 12.8 collapses per year, indicating improved grid stability compared to earlier years.
  • Under Bola Ahmed Tinubu, the average has fallen further to about 6.7 collapses annually.
  • 2016 recorded the highest number of collapses during the Buhari administration, with 28 incidents.
  • The most stable years in the dataset were 2020 and 2021, with only four collapses each.

POPULAR TOPICS
SIGN UP TO OUR NEWSLETTER
Get periodic updates about the African startup space, access to our reports, among others.
Subscribe Here
Subscription Form

A product of Techpoint Africa. All rights reserved