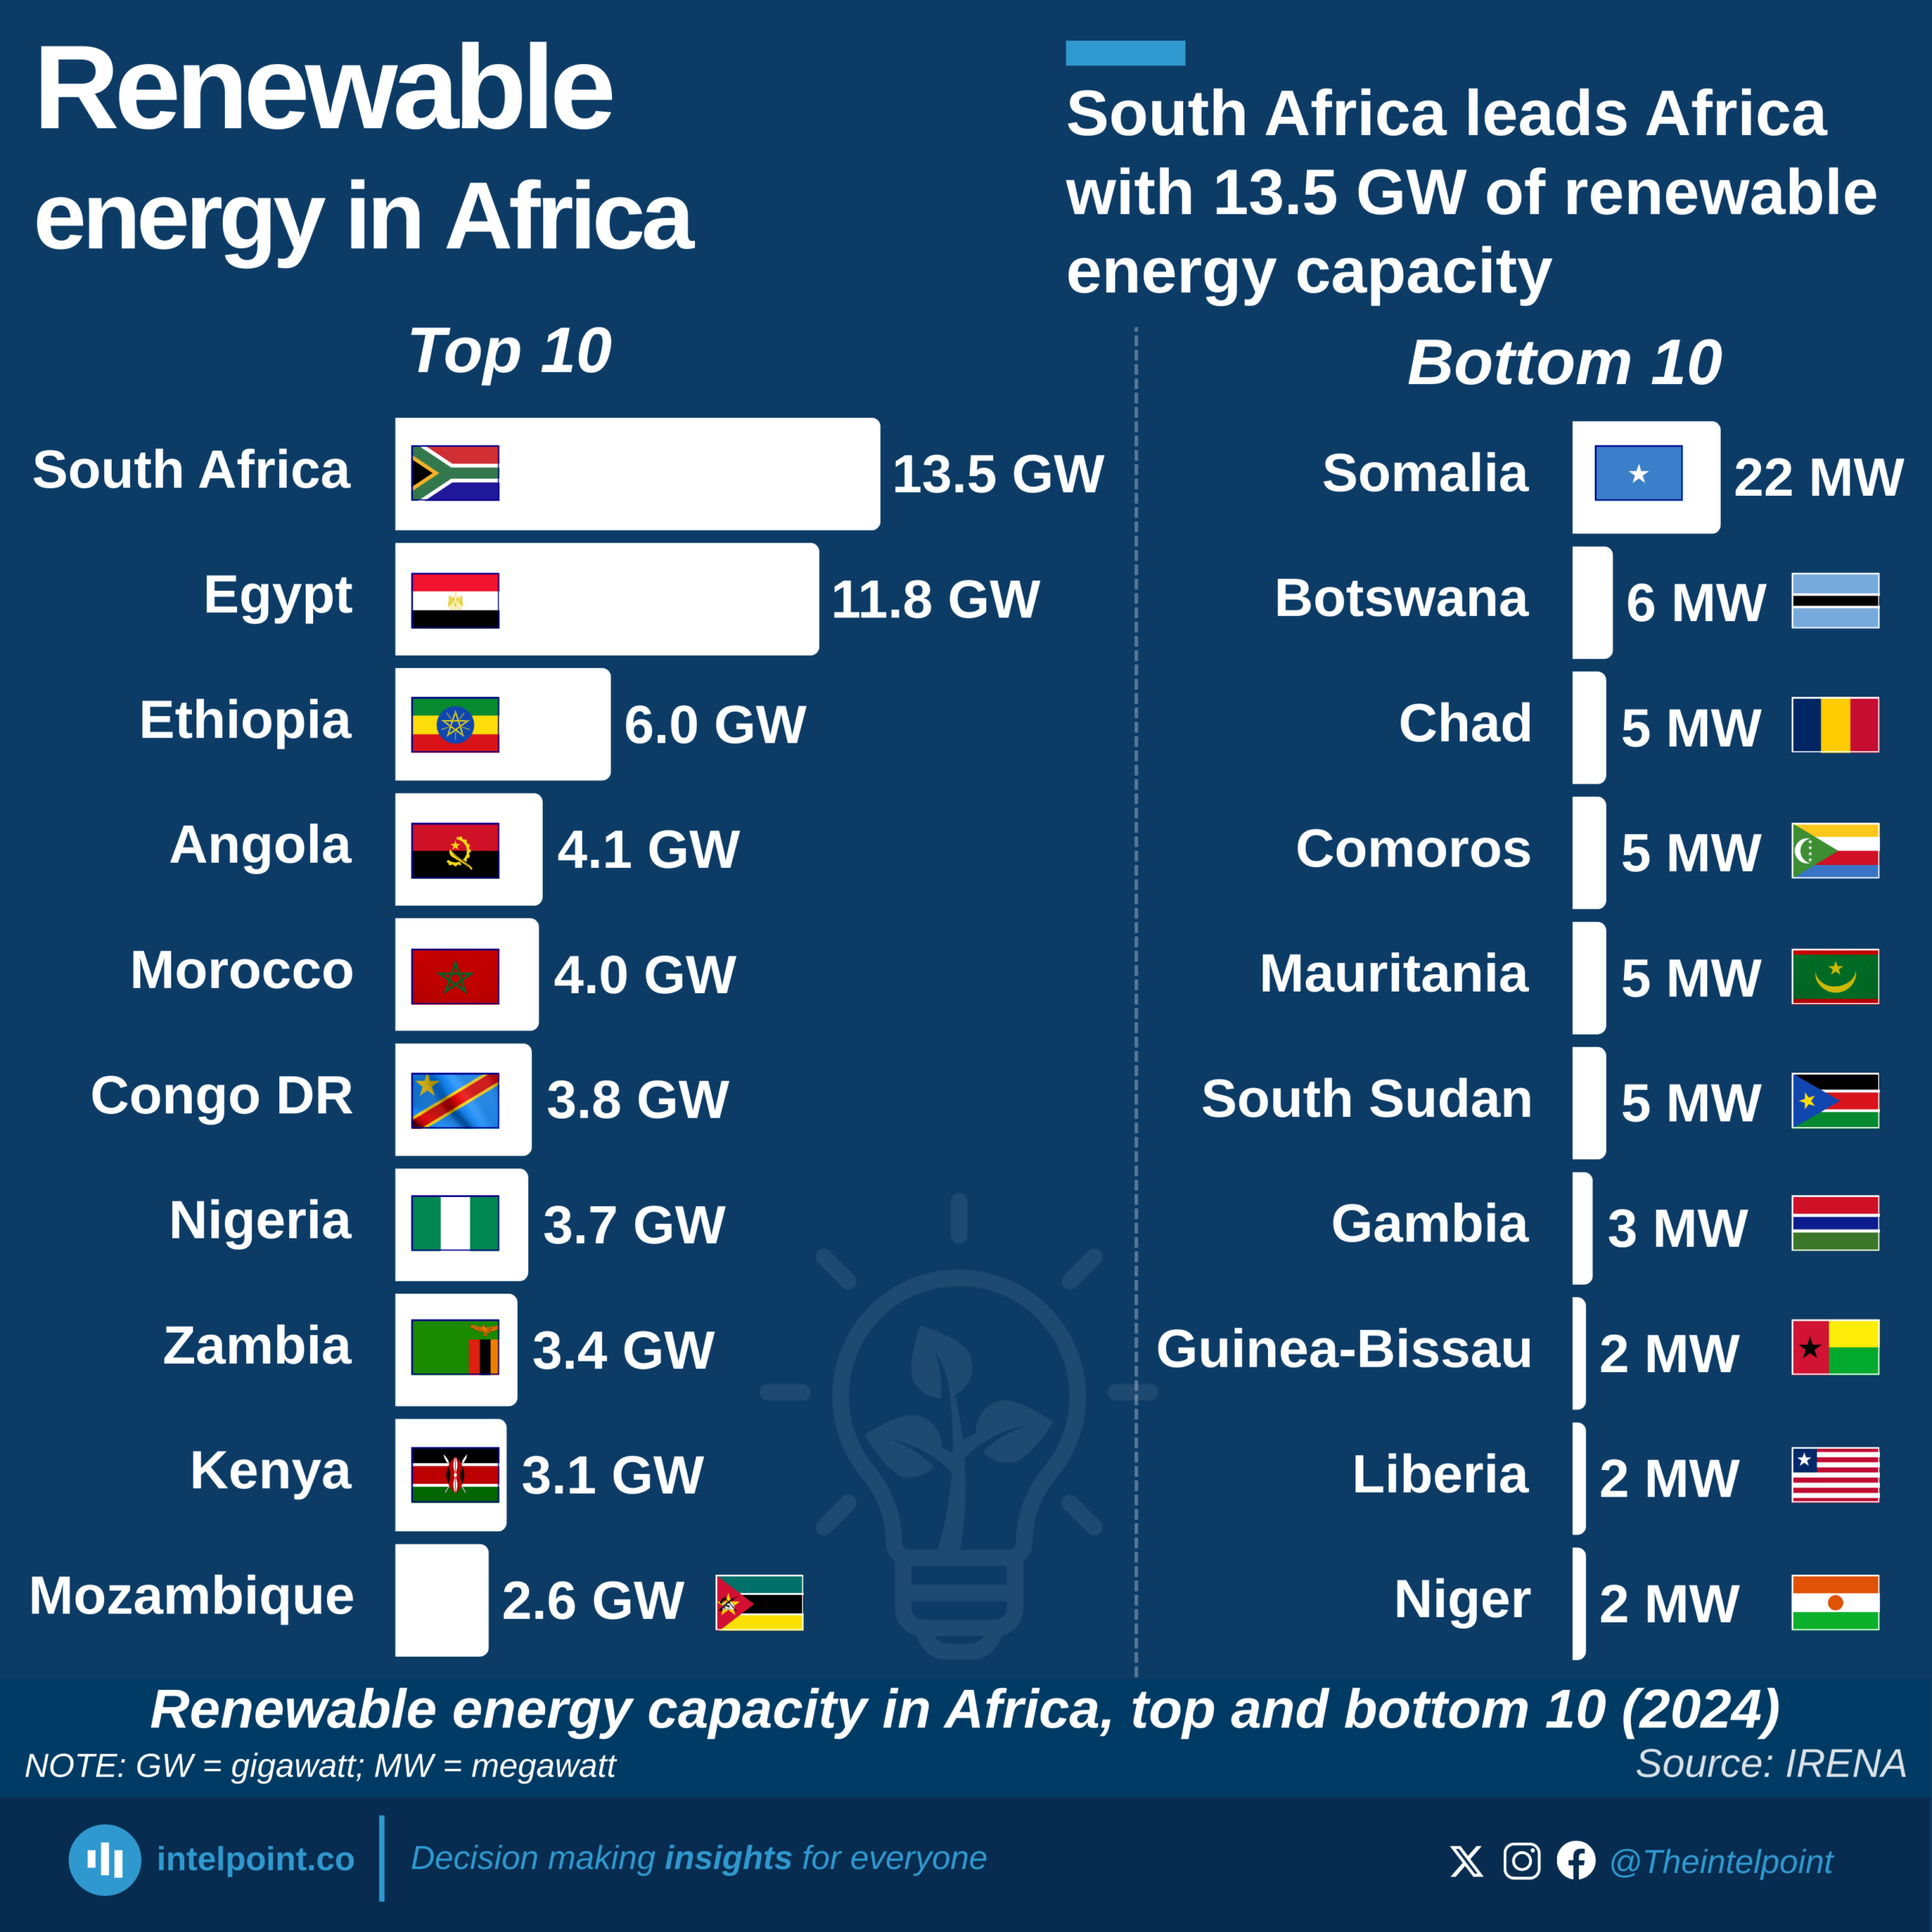
South Africa leads Africa with 13.5 GW of renewable energy capacity

  • South Africa leads Africa with 13.5 GW of renewable energy capacity, the highest on the continent.
  • Egypt follows closely with 11.8 GW, making North Africa a dominant player in the sector.
  • Ethiopia stands out in East Africa with 6 GW of renewable capacity.
  • Nigeria, Africa’s largest economy, ranks 7th with 3.7 GW.
  • The difference between the top performer (South Africa) and the lowest (Niger) is more than 6,000 times in renewable capacity.

Africa’s renewable energy landscape shows that some countries are making significant strides while others remain far behind. South Africa leads the continent with a renewable capacity of 13.5 GW, followed closely by Egypt at 11.8 GW. These two nations dominate the space, accounting for a large share of Africa’s renewable energy capacity.

The gap between leaders and laggards highlights both opportunities and challenges. For instance, South Africa, Egypt, Ethiopia, Angola, and Morocco have all surpassed 4 GW, showing how focused investments and government policies can drive expansion. On the other end, countries like Guinea-Bissau, Niger, and Liberia are struggling with just 2 MW each.

As Africa positions itself for sustainable growth, the disparity in renewable energy adoption will shape its economic and social trajectory. Countries at the top of the list are already proving how renewables can drive industrial competitiveness, while those at the bottom risk being left behind.
Source:

IRENA

Period:

2024
HTML code to embed chart
Want a bespoke report?
Reach out
Tags
Related Insights

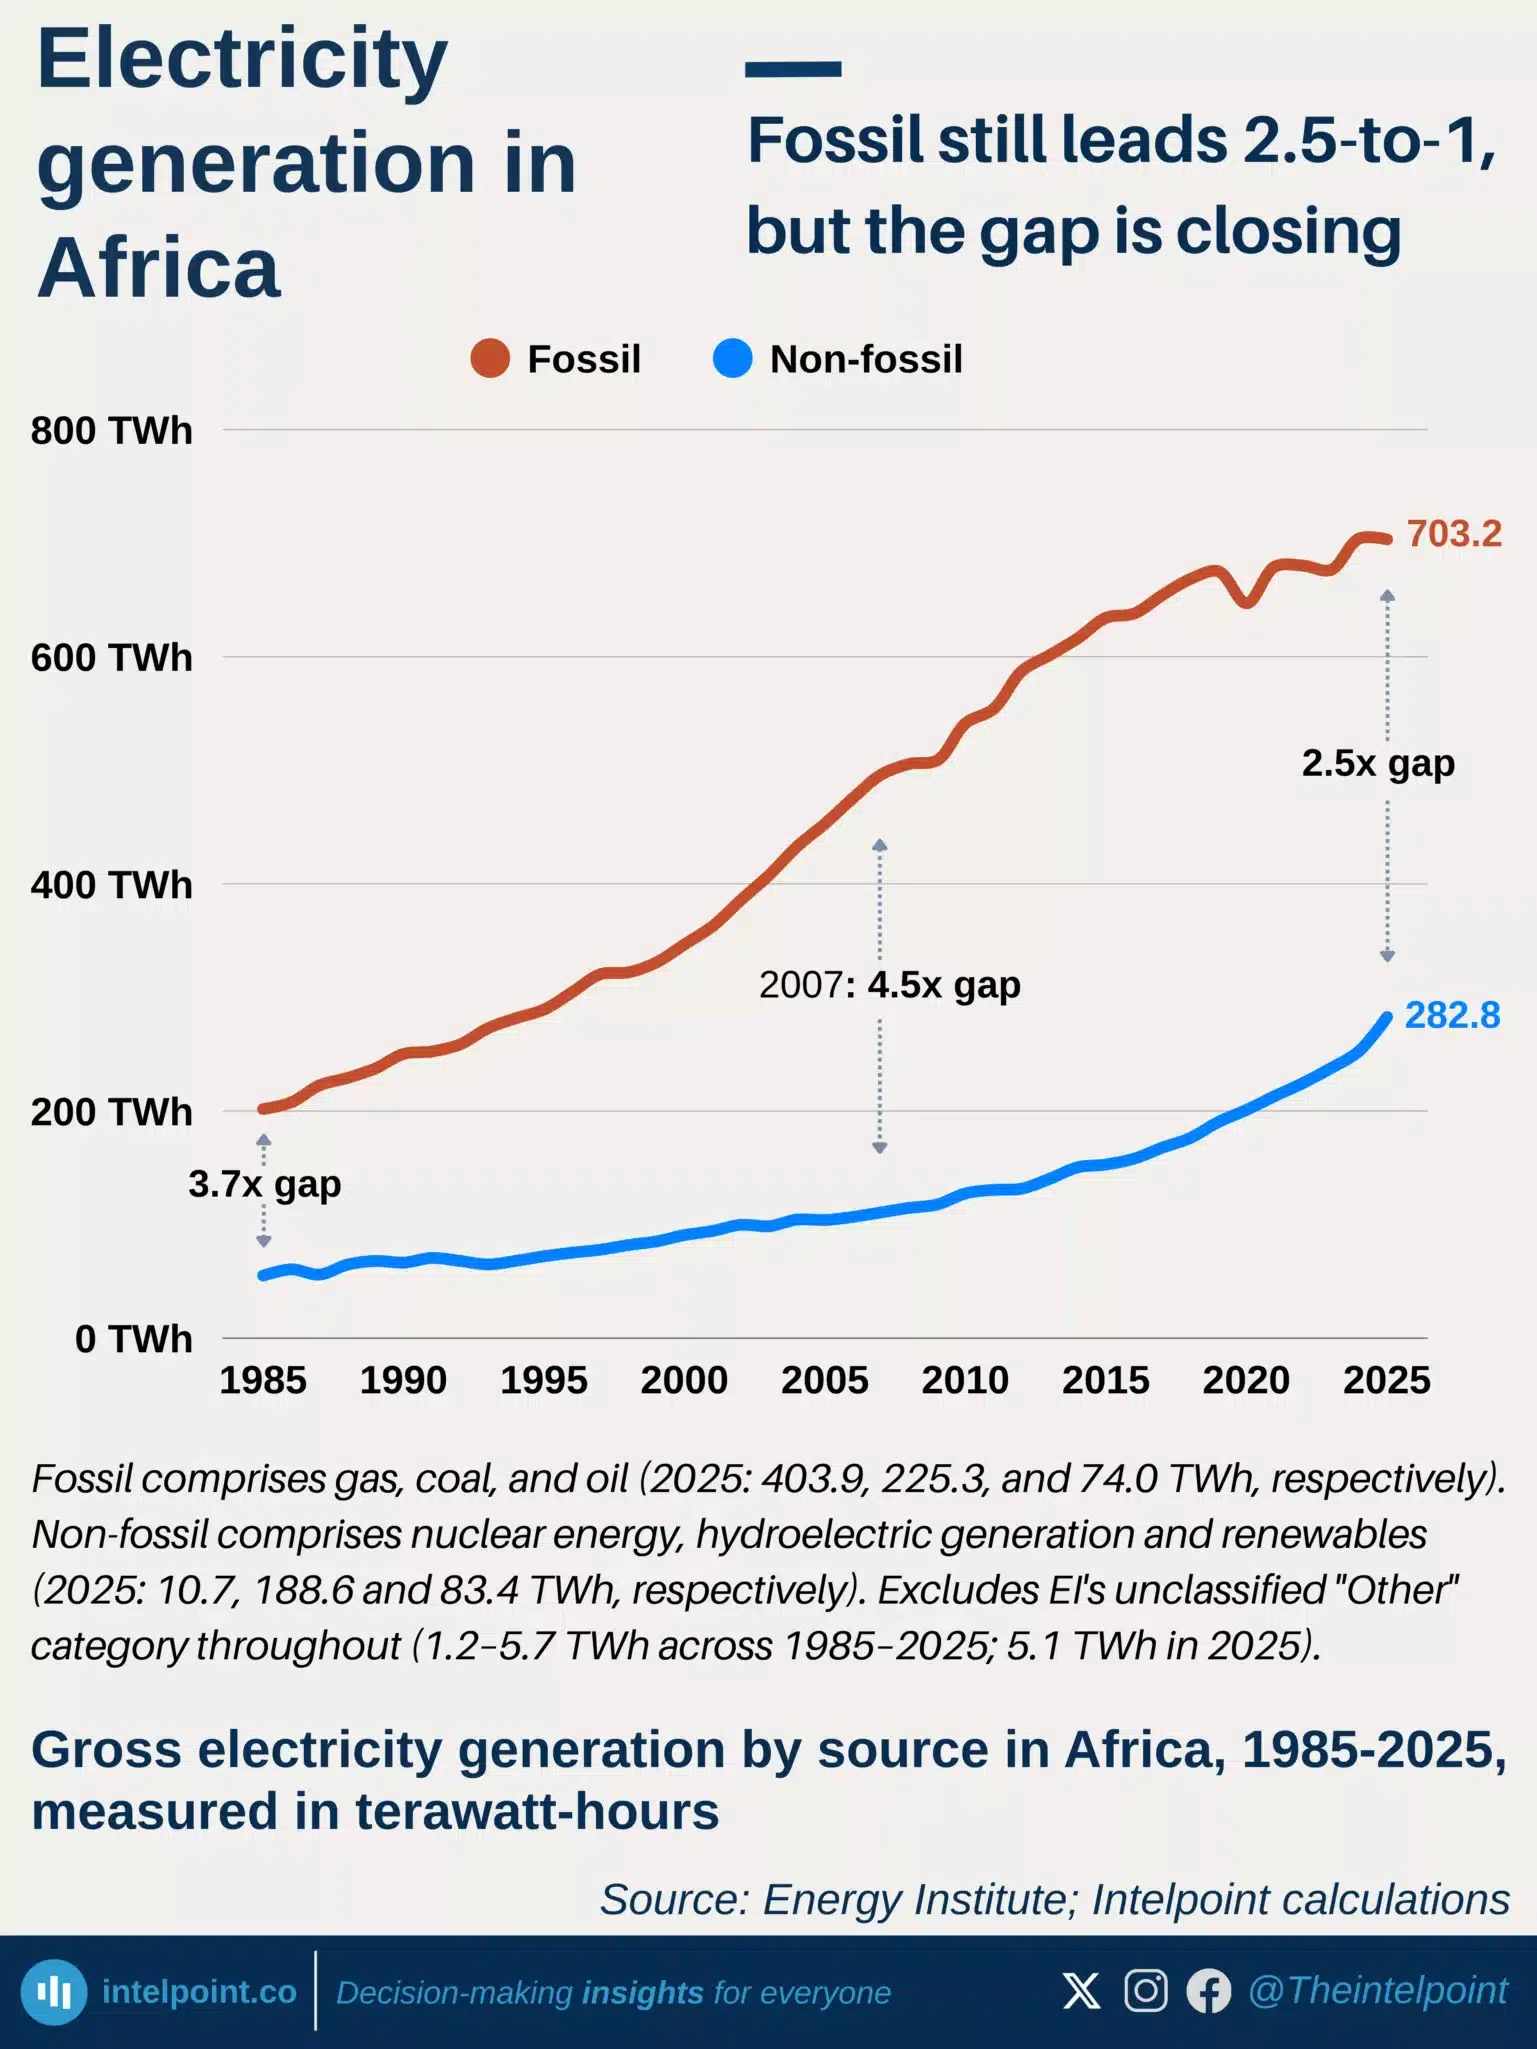
Electricity generation in Africa: fossil still leads 2.5-to-1, but the gap is closing
  • Fossil fuels still generate 2.5x more electricity than non-fossil sources, though the gap has narrowed from a 2007 peak of 4.5x.
  • South Africa and Egypt together account for all of Africa's nuclear power and 59% of its non-hydro renewables.
  • Hydropower, the largest non-fossil source at 188.6 TWh, tells a different geographic story, with 91% generated outside South Africa and Egypt, mainly in Eastern, Middle, and Western Africa.
  • Gas still leads at 403.9 TWh, but its growth slowed to 0.8% in 2025 versus 11.9% growth for non-fossil sources.

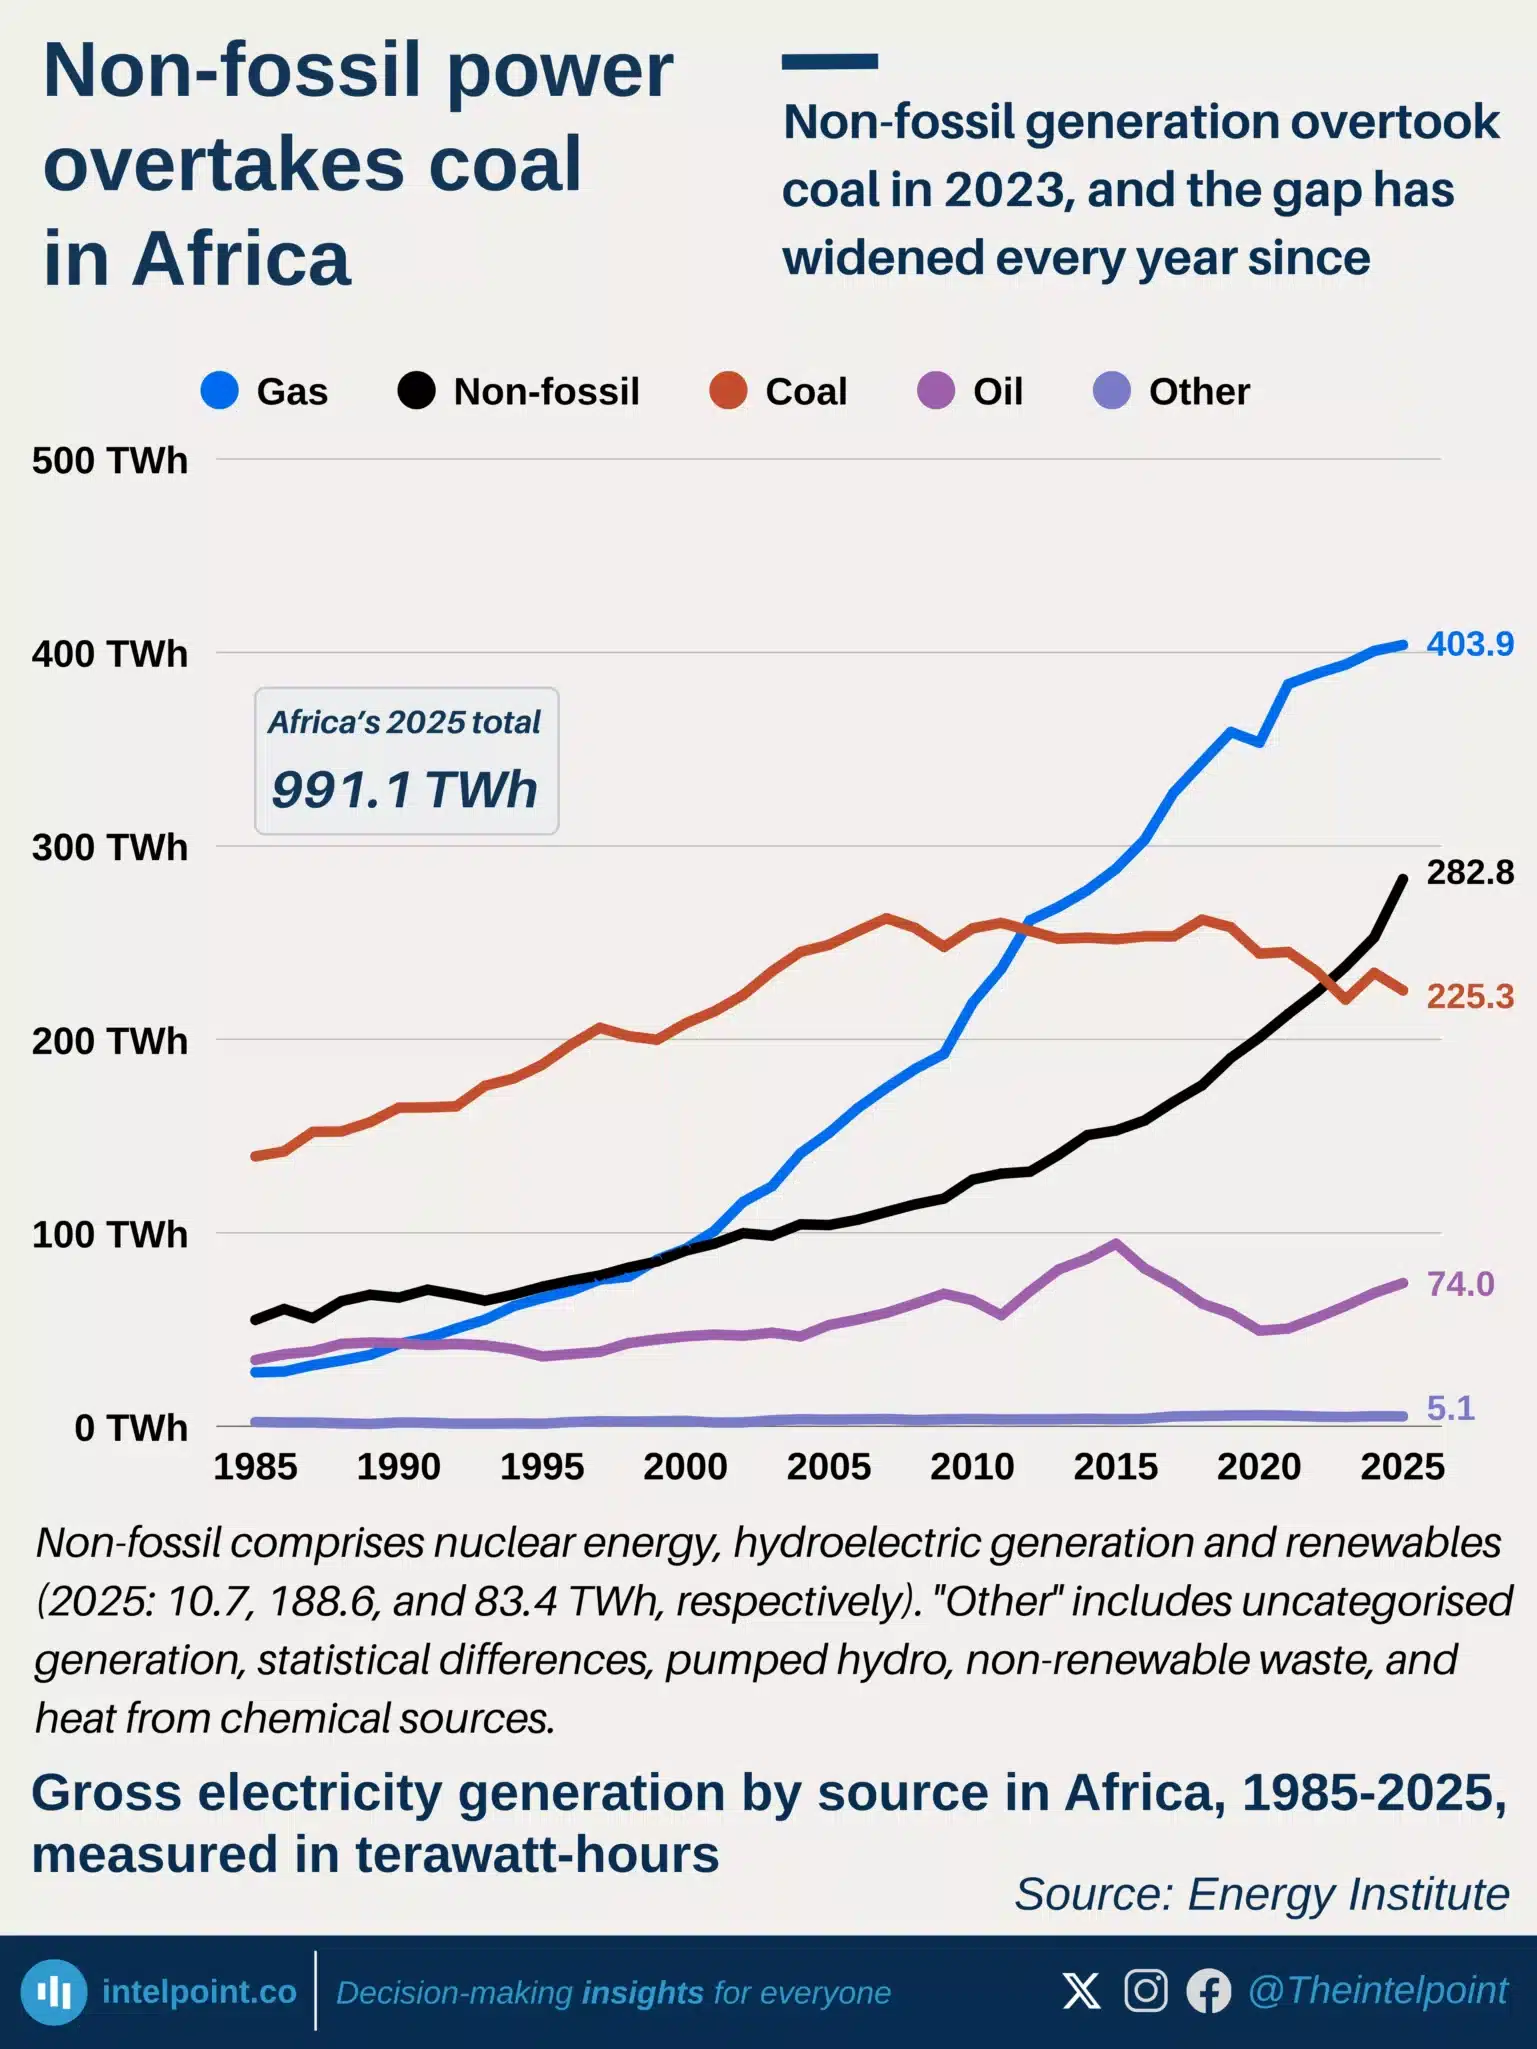
Non-fossil generation overtook coal in 2023, and the gap has widened every year since
  • Non-fossil generation overtook coal in 2023, with the gap reaching 57.5 TWh in 2025.
  • Coal generation fell to 225.3 TWh, below its 262.6 TWh peak in 2007.
  • Hydropower dominates non-fossil generation, producing 188.6 TWh in 2025.
  • Fossil fuels still dominate, generating 703.2 TWh versus 282.8 TWh from non-fossil sources.

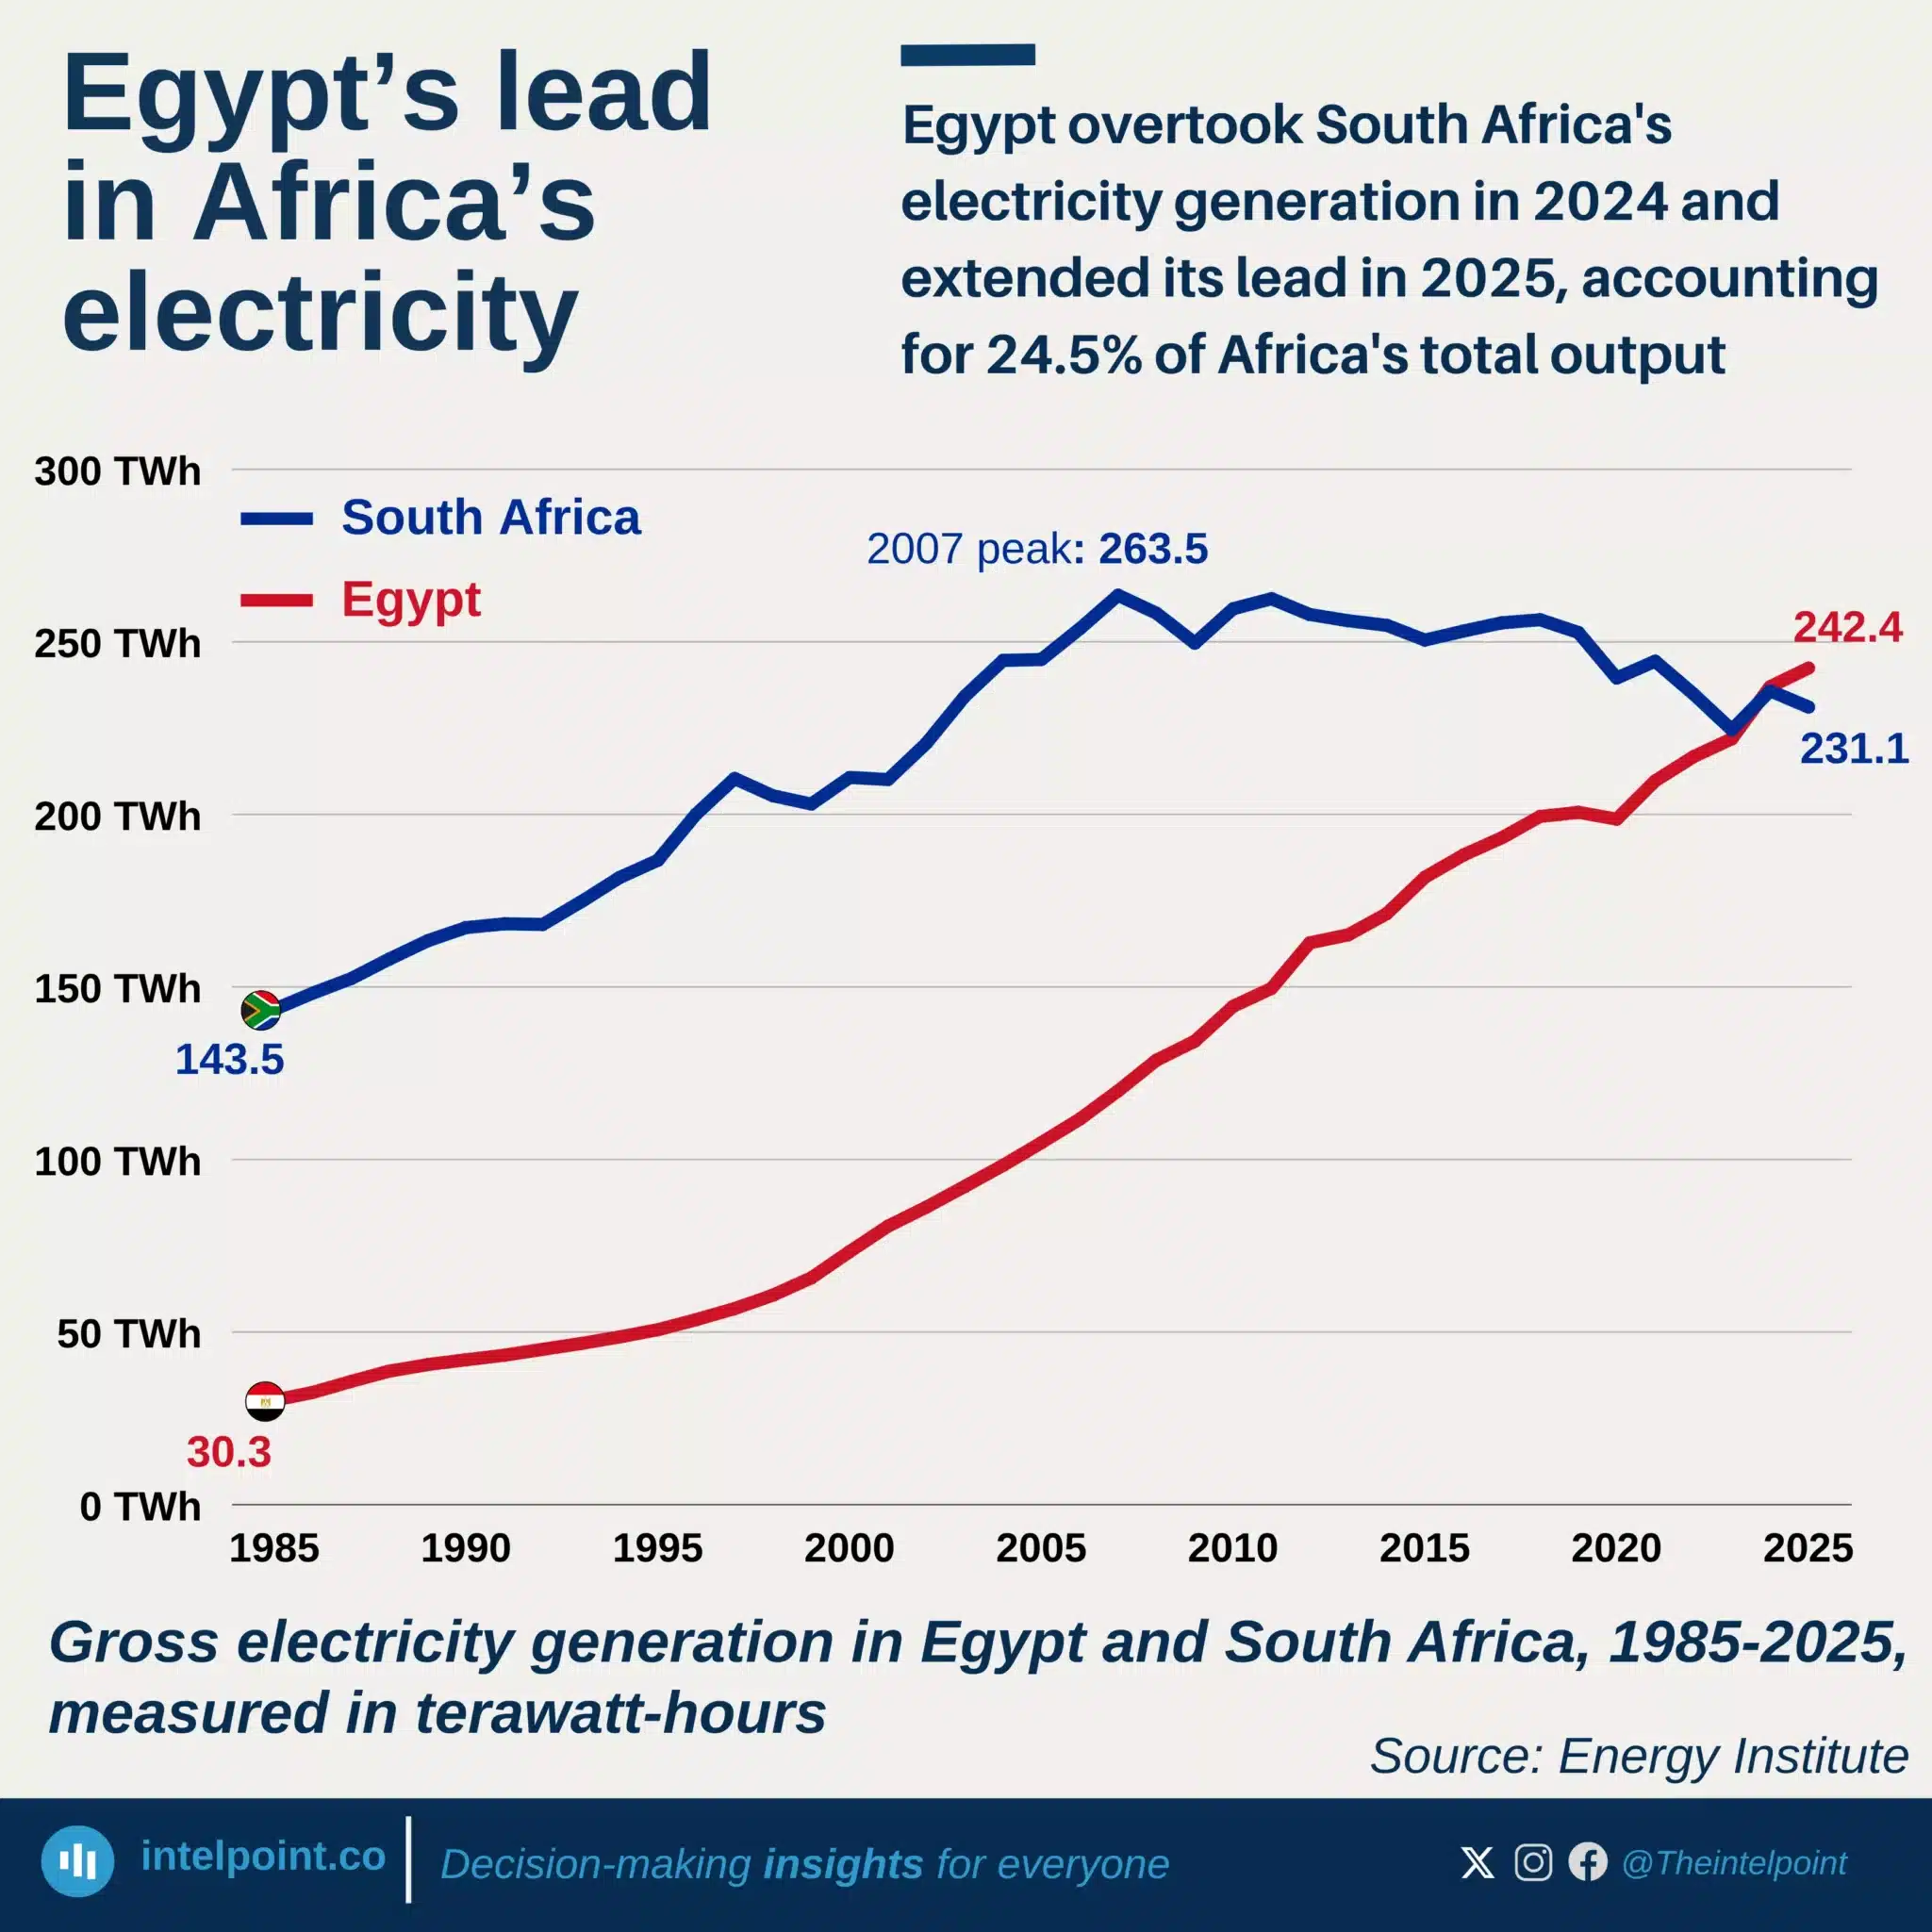
Egypt overtook South Africa's electricity generation in 2024 and extended its lead in 2025
  • Africa’s share of global electricity generation rose only from 2.6% in 1985 to 3.1% in 2025.
  • Africa’s electricity generation increased 283% over the past 40 years.
  • Egypt overtook South Africa as Africa’s largest electricity producer in 2024.
  • Egypt generated 242.4 TWh in 2025, up from 30.3 TWh in 1985.
  • South Africa generated 231.1 TWh in 2025, down from its 263.5 TWh peak in 2007.
  • Egypt and South Africa accounted for 24.5% of Africa’s electricity generation in 2025.

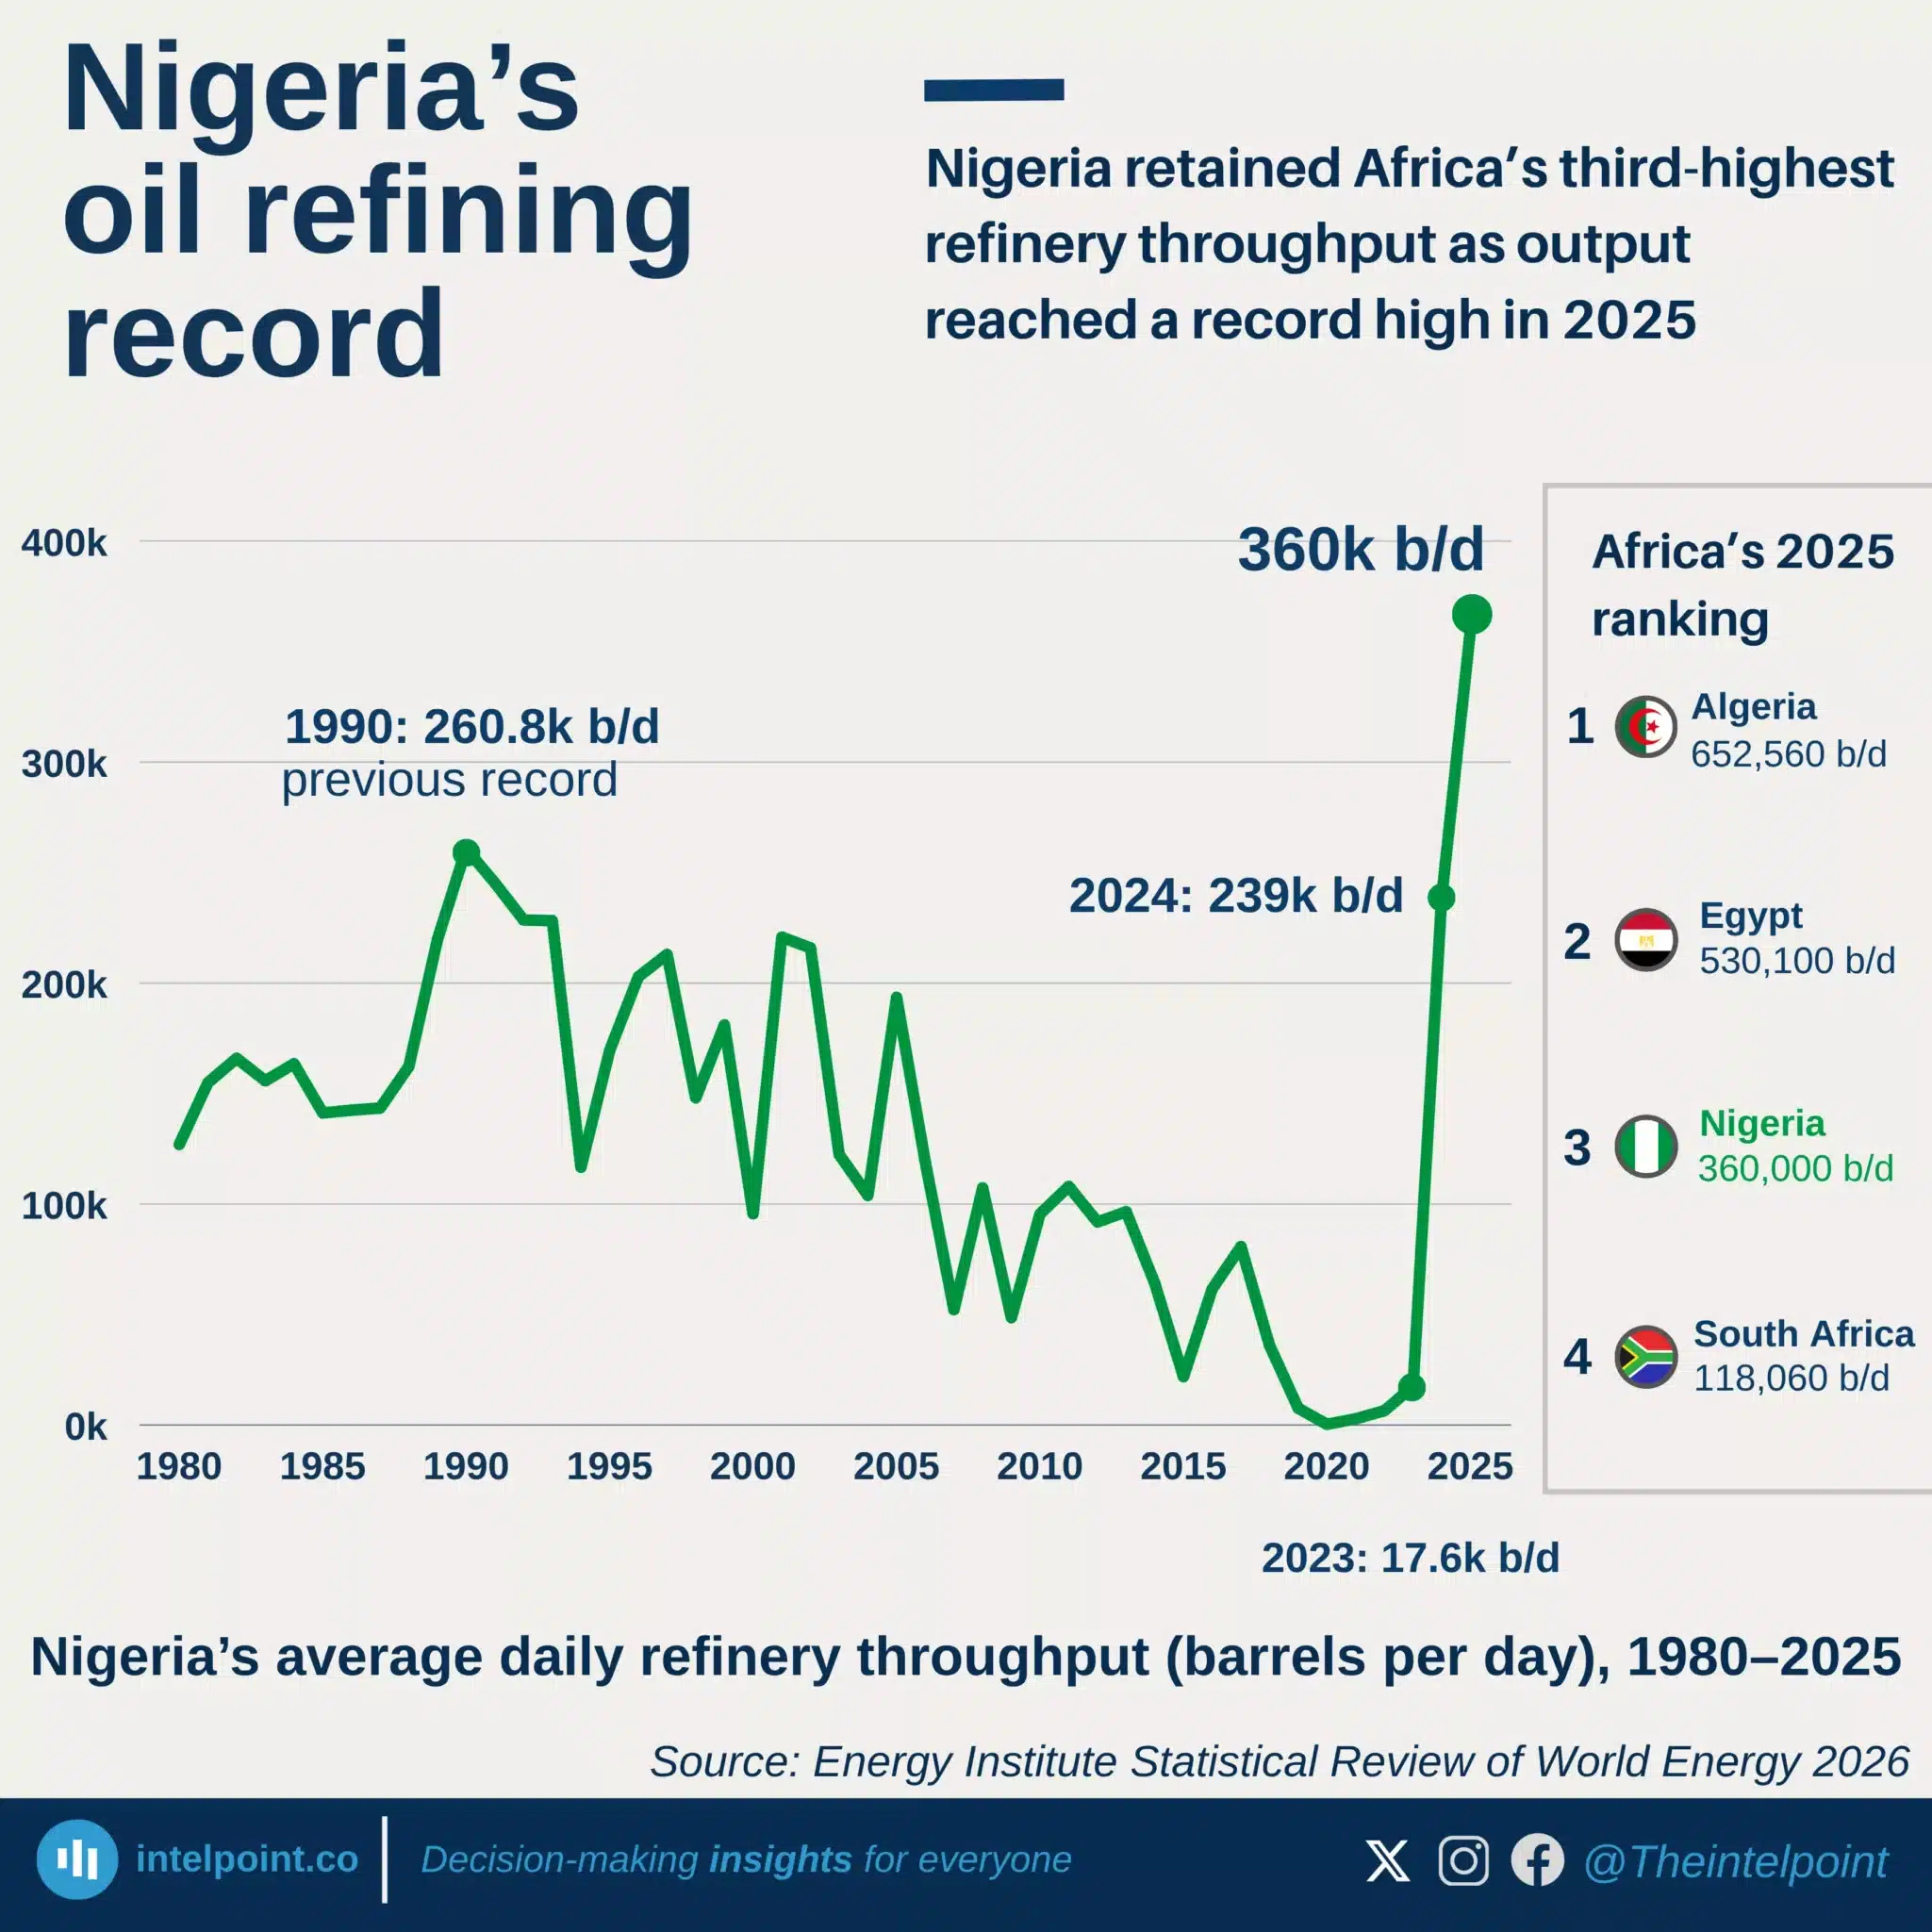
Nigeria retained Africa’s third-highest refinery throughput as output reached a record high in 2025
  • Nigeria recorded its highest refinery throughput since 1990 at 360,000 b/d.
  • Throughput increased by 50.6% from 239,000 b/d in 2024.
  • The 2025 level was more than 20 times the 17,600 b/d recorded in 2023.
  • Nigeria remained Africa’s third-highest, behind Algeria and Egypt.
  • Dangote’s contribution is not reported separately.

East African countries accounted for seven of the continent's 15 biggest electricity access gains in 23 years
  • Eswatini recorded Africa’s largest electricity access gain, rising by 66 percentage points from 2000 to 2023.
  • Kenya and Rwanda followed with gains of 61 pp and 58 pp, respectively.
  • East African countries accounted for 7 of Africa’s top 15 electricity access improvements.
  • Comoros, Ghana and Cape Verde reached very high access levels by 2023, at 90%, 90% and 99% respectively.
  • Nigeria’s electricity access improved by 18 percentage points, from 43% in 2000 to 61% in 2023.
  • Despite that improvement, Nigeria remained outside Africa’s top 15 gainers over the period.
  • Some countries were absent from the ranking because they had already reached high access levels by 2000.

Ibadan and Enugu DisCos together accounted for nearly two million unmetered customers
  • Nigeria still had about 5.25 million unmetered electricity customers across DisCos.
  • The 11 DisCos reported in Q4 2025 had 5.20 million unmetered customers.
  • Nigeria’s reported metering rate stood at 57.3% as of Q4 2025.
  • Ibadan and Enugu had the largest gaps, with nearly two million unmetered customers combined.
  • Ibadan alone had 1.18 million unmetered customers, the highest of any DisCo.
  • Ikeja and Eko had the strongest metering performance, both at about 86%.
  • At the 2025 pace of meter additions, closing the current gap could take close to seven years.

POPULAR TOPICS
SIGN UP TO OUR NEWSLETTER
Get periodic updates about the African startup space, access to our reports, among others.
Subscribe Here
Subscription Form

A product of Techpoint Africa. All rights reserved