Ghana's GDP

Key takeaways

  • From 2013 to 2024, the services sector has consistently dominated Ghana’s GDP, while agriculture has remained the smallest sector.
  • A weak agriculture sector can make Ghana more dependent on food imports.
  • Agriculture’s stagnation reduces its role as a labour buffer.

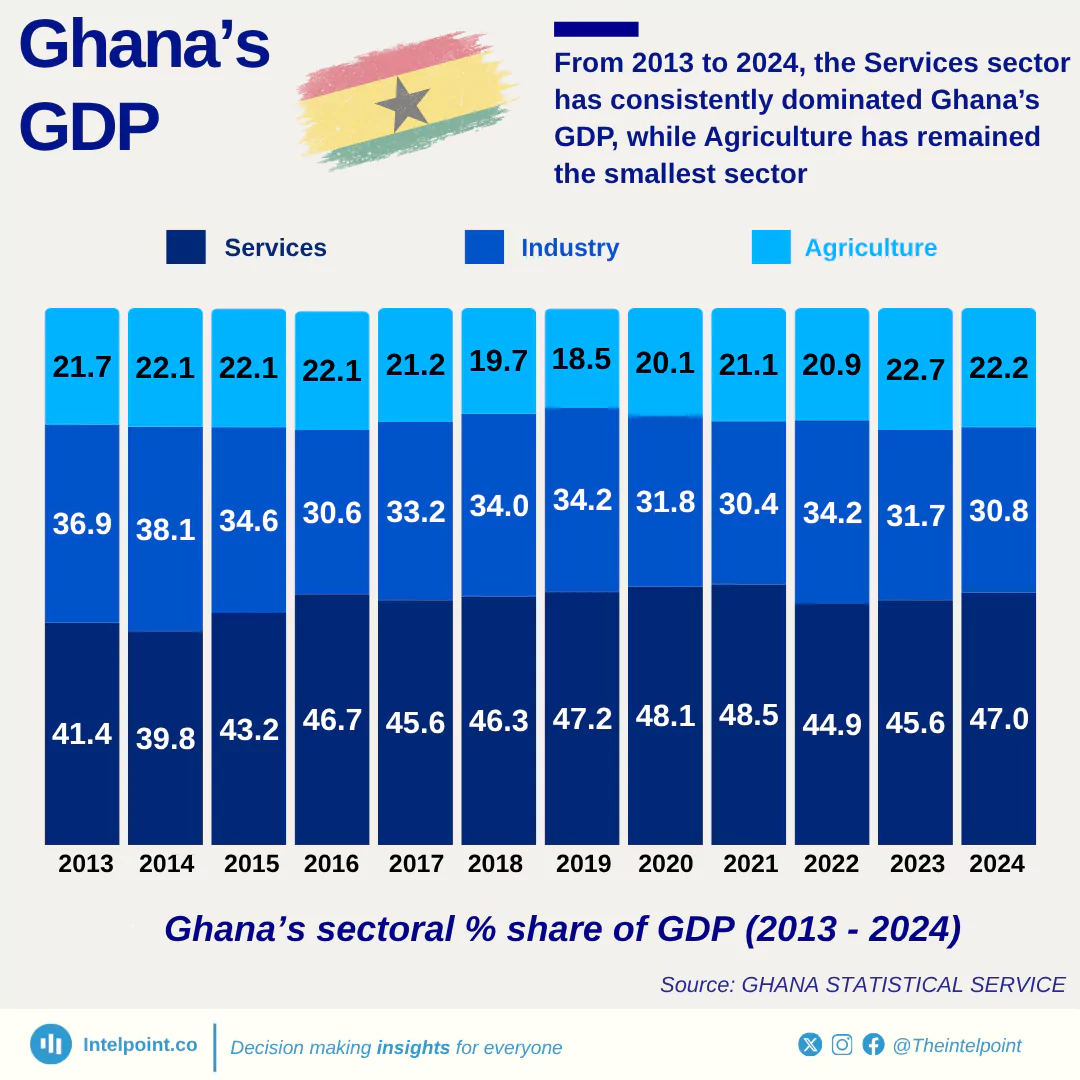
From 2013 through to 2024, Ghana’s economic structure has shown a remarkably consistent pattern in which the Services sector has been the leading contributor to GDP, while agriculture has persistently been the smallest of the three major sectors. Over the years, the decline in agriculture’s share has been gradual but persistent, while services has either held steady or edged up, and industry has been in between.

A large share of Ghana’s population (especially in rural areas) depends on farming for income. If agriculture contributes the least to GDP, it often means incomes in rural communities grow more slowly than in urban, service-driven areas. A relatively weak agricultural sector can make Ghana more dependent on food imports, which raises risks during global price shocks. While services can dominate GDP, they cannot absorb all labour. Agriculture’s stagnation reduces its role as a labour buffer, leading to higher disguised unemployment.

Source:

GHANA STATISTICAL SERVICE

Period:

2013-2024
HTML code to embed chart
Want a bespoke report?
Reach out
Tags
Related Insights

Nigeria’s slice of Africa’s economy since independence: From a peak of 31% to 7% in 2024
  • At independence in 1960, Nigeria contributed about 10% of Africa’s GDP, establishing itself early as one of the continent’s largest economies.
  • Nigeria’s share peaked at 31% in 1981 during the oil boom, highlighting the dramatic impact of natural resources on the economy.
  • Between the mid-1980s and 2000s, Nigeria’s share fluctuated significantly, dropping to 9.2% in 1999 due to political instability, economic mismanagement, and external shocks.
  • By 2024, Nigeria’s share fell to 7.1%, despite a GDP of $187.8 billion, showing slower relative growth compared to other African economies and the ongoing need for economic diversification.
  • This share reflects Nigeria’s relative position in Africa’s economy over time, showing how it moved in relation to the growth of the rest of the continent.

Yams produced in Nigeria in 2023 were valued at $25.4b, the highest among major reported commodities
  • After yielding 61.9 million tonnes, yams were valued at $25.4 billion in 2023, the highest among reported commodities.
  • With 62.7 million tonnes produced, cassava generated $9.1 billion, making it the second most valuable crop.
  • Okra ($818/t), tomatoes ($808/t), and pineapples ($753/t) earned the highest returns per unit despite smaller volumes (1.6–3.8 million tonnes).
  • Maize ($3.7 b, 11.1 m t), rice ($3.1 b, 8.9 m t), sorghum ($2.3 b, 6.4 m t), cowpeas ($1.2 b, 4.3 m t), and groundnuts ($0.9 b, 4.3 m t) form the backbone of production.

The basket of food that cost ₦100k in January 2025 cost approximately ₦114k in August
  • Food prices rose roughly 13.9% from January to August 2025, according to the rebased Consumer Price Index (CPI) from the National Bureau of Statistics.
  • Month-on-month inflation for food fluctuated, with some months seeing sharper increases than others.
  • Using January as a baseline, the purchasing power of money for food declined steadily, meaning households need more naira to buy the same items.
  • Food carries a large weight in the CPI basket, making it a major driver of overall inflation and cost-of-living increases.

Trade and agriculture led Nigeria’s ₦51.20 trillion economy in Q2 2025, as oil’s share remained modest
  • Trade contributed 18.28%, making it the largest sector in Q2 2025's GDP.
  • Crop production followed with 17.8%, underscoring agriculture’s central role.
  • Oil and gas added just 4.05%, highlighting its shrinking share compared to non-oil sectors.
  • Real estate and telecoms reinforced the growing strength of services in the Nigerian economy.

Kenya's private sector credit growth plunged to 0.9% from a peak of 13.5% and has now rebounded to 4.4%
  • Private sector credit growth peaked at 13.5% in Q4 2023.
  • Growth remained stable between 12 and 13% throughout 2022 and 2023.
  • A sharp decline began in 2024, dropping to 11.5% in Q1.
  • Credit growth plunged to 5.4% in Q2 2024, showing a steep contraction.
  • The lowest point was Q4 2024, at just 0.9%.
  • A rebound started in early 2025, with growth rising to 2.4% in Q1.
  • By Q2 2025, private sector credit growth recovered to 4.4%, though still far below its 2023 highs.

Private sector lending in Kenya is concentrated in manufacturing, trade, and households, accounting for a combined 54.5%
  • Private households hold the largest share of credit at 27.8%.
  • Trade accounts for 14.4% of outstanding private sector loans.
  • Manufacturing makes up 12.3% of the private sector credit share.
  • Combined, households, trade, and manufacturing absorb 54.5% of all private credit.
  • Consumer durables contribute 9.4% of outstanding loans.

POPULAR TOPICS
SIGN UP TO OUR NEWSLETTER
Get periodic updates about the African startup space, access to our reports, among others.
Subscribe Here
Subscription Form

A product of Techpoint Africa. All rights reserved