Nigeria’s nominal GDP has grown by over 80%, but real GDP has grown by only 6%

Key Takeaways

  • Real GDP grew from ₦205.1 trillion in 2019 to ₦217.8 trillion in 2024, a modest 6% rise.
  • Nominal GDP jumped from ₦205.1 trillion to ₦372.8 trillion over the same period, an 82% increase.
  • The gap between nominal and real GDP widened sharply after 2021, reaching ₦155 trillion in 2024.
  • Nominal GDP has grown year-on-year, with the steepest jump between 2023 (₦314.0 trillion) and 2024 (₦372.8 trillion).
  • Inflationary pressures have driven nominal gains, masking subdued real economic expansion.

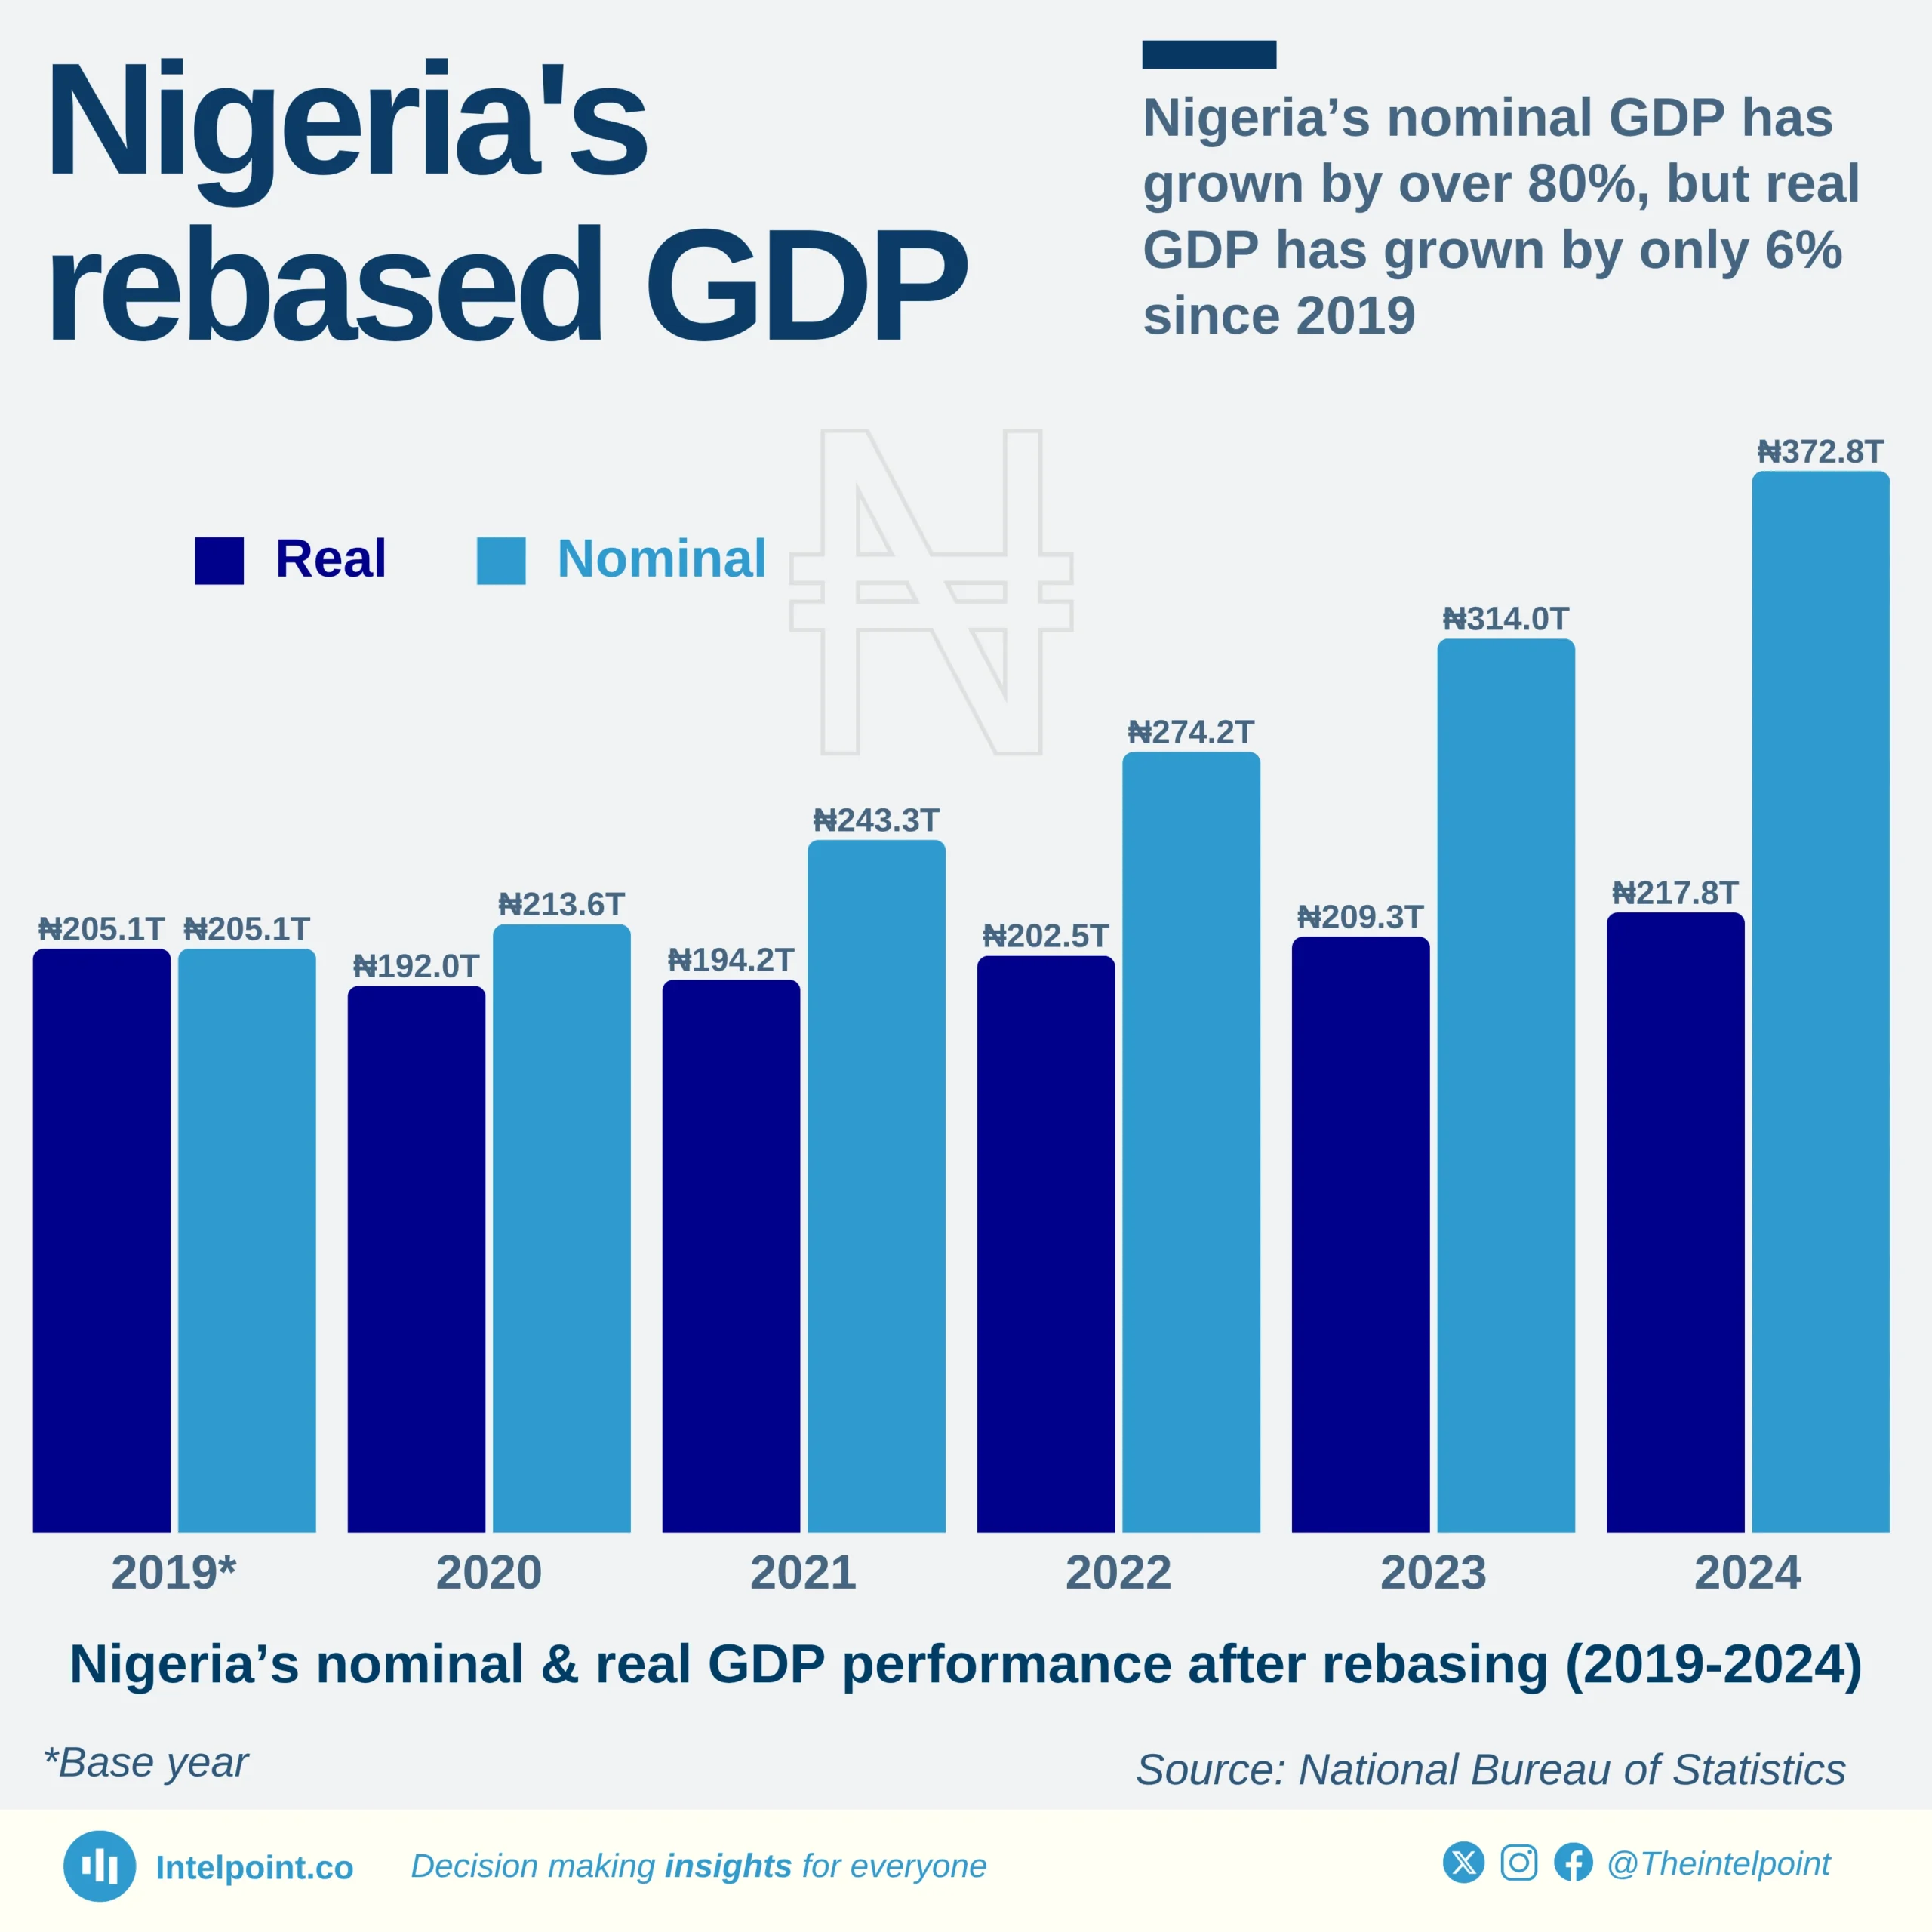
Following Nigeria’s 2025 GDP rebasing, where it adopted 2019 as the new base year, nominal GDP has climbed by more than 80%, rising from ₦205.1 trillion in 2019 to ₦372.8 trillion in 2024. In contrast, real GDP has barely shifted, inching up by just 6% over the same period. The divergence has grown particularly stark in recent years, with nominal gains accelerating while real output remains largely stagnant. The data underscores how much of Nigeria’s economic growth has been driven by price inflation rather than expanded production, leaving real economic progress subdued despite headline increases.

Source:

National Bureau of Statistics

Period:

2019 - 2024
HTML code to embed chart
Want a bespoke report?
Reach out
Tags
Related Insights

Morocco’s GDP per capita has more than doubled since 2000, reaching a new high ($3,993) in 2024
  • Morocco’s GDP per capita has shown a fluctuating pattern in the last 25 years, with periods of steady growth and also fall.
  • The years 2003–2008 stand out as a high-growth phase, with GDP per capita rising rapidly from $1,941.9 to $3,183.2.
  • In 2021, a dramatic 15.9% rebound took GDP per capita up to $3,785.9.
  • In 2024, nominal GDP per capita stood at $3,993.4.
  • The last 25 years depict a more than twofold increase in Morocco’s GDP per capita, moving from $1,499.1 to $3,993.4.

South Africa’s GDP per capita has grown in 21 of the past 24 years, climbing to a record high in 2024
  • South Africa’s GDP per capita rose from $440 in 2000 to an all-time high of $2,692 in 2024.
  • Growth was relatively steady in the 2000s, with notable jumps after 2006 and again in the post-pandemic years.
  • Despite dips in 2008 (global financial crisis) and 2020 (COVID-19 shock), the economy showed resilience with quick rebounds.
  • By 2024, South Africa achieved its strongest per capita GDP on record, cementing its role as one of Africa’s leading middle-income economies.
  • The country recorded growth in 21 of the past 24 years.

Algeria’s GDP per capita has risen four straight years since 2020, edging closer to its 2014 oil-driven peak
  • Algeria’s GDP per capita more than tripled in 25 years, rising from $1,772.9 in 2000 to $5,631.2 in 2024.
  • The 2000s boom saw rapid growth, peaking at $5,180.9 in 2008, fuelled by high oil and gas prices.
  • Between 2014 and 2016, GDP per capita fell from $6,094.7 to $4,425.0, reflecting oil price collapses and domestic fiscal strain.
  • After pandemic-era lows in 2020 ($3,743.5), Algeria rebounded to its second-highest level on record in 2024 ($5,631.2), regaining its regional standing.

Egypt’s GDP per capita has more than doubled since 2000, but has fallen sharply since its 2022 peak
  • Egypt’s GDP per capita grew from $1,366 in 2000 to $3,339 in 2024, a 144% increase over 25 years.
  • The economy peaked at $4,233 in 2022, marking the highest point in the series before a two-year decline.
  • Sustained growth was driven by the 2000s and 2010s, with resilience after the 2008 financial crisis and Arab Spring disruptions.
  • The dip after 2022 reflects external pressures, currency adjustments, and inflationary challenges, though per capita levels remain well above early 2000s baselines.

Burundi’s GDP per capita rose to $280.97 in 2015, its highest point in 25 years, before falling to $153.93 in 2024
  • Burundi recorded its highest GDP per capita in 2015 ($280.97).

  • By 2024, GDP per capita dropped to $153.93, a decline of nearly 45% from its peak.

  • Burundi’s population exceeds 13 million (2024), which dilutes income per person even when overall GDP grows.

  • Structural challenges like limited industrialization, reliance on subsistence farming, and political instability contribute to stagnation.

  • Since 2015, Burundi has held the lowest GDP per capita in Africa—and at $153.9 in 2024, it is the poorest country in the world by GDP per capita.


Zimbabwe’s GDP per capita recorded a 472% increase over the 25-year period from 2000 to 2024
  • Zimbabwe’s GDP per capita nearly quintupled since 2000, marking a 472% increase over 25 years.
  • The country's GDP per capita declined consistently from 2001 to 2008.
  • It soared to $3,448.1 in 2017, which is still the highest in the country's history.
  • The GDP per capita plummeted to $2,271.9 in 2019, recording a (34.1%) decrease.

POPULAR TOPICS
SIGN UP TO OUR NEWSLETTER
Get periodic updates about the African startup space, access to our reports, among others.
Subscribe Here
Subscription Form

A product of Techpoint Africa. All rights reserved