Microsoft’s Q1 2025 revenue passes $70 billion; net income surges by 160% from 2018

Key takeaways

  • Microsoft’s revenue has grown steadily from $26.8B in Q1 2018 to $70.1B in Q1 2025, marking a 161% increase over the seven-year period.
  • Its net income more than tripled from $7.4B in Q1 2018 to $25.8B in Q1 2025, with consistent year-on-year growth, especially sharp increases between 2020 and 2023.
  • The company crossed the $50B quarterly revenue mark for the first time in Q4 2021, and hasn’t dropped below that threshold since Q1 2022.
  • From Q1 2023 to Q1 2025 alone, Microsoft’s net income surged by over $7.5B, signalling an era of record profitability, with each quarter surpassing $20B in profit since Q2 2023.

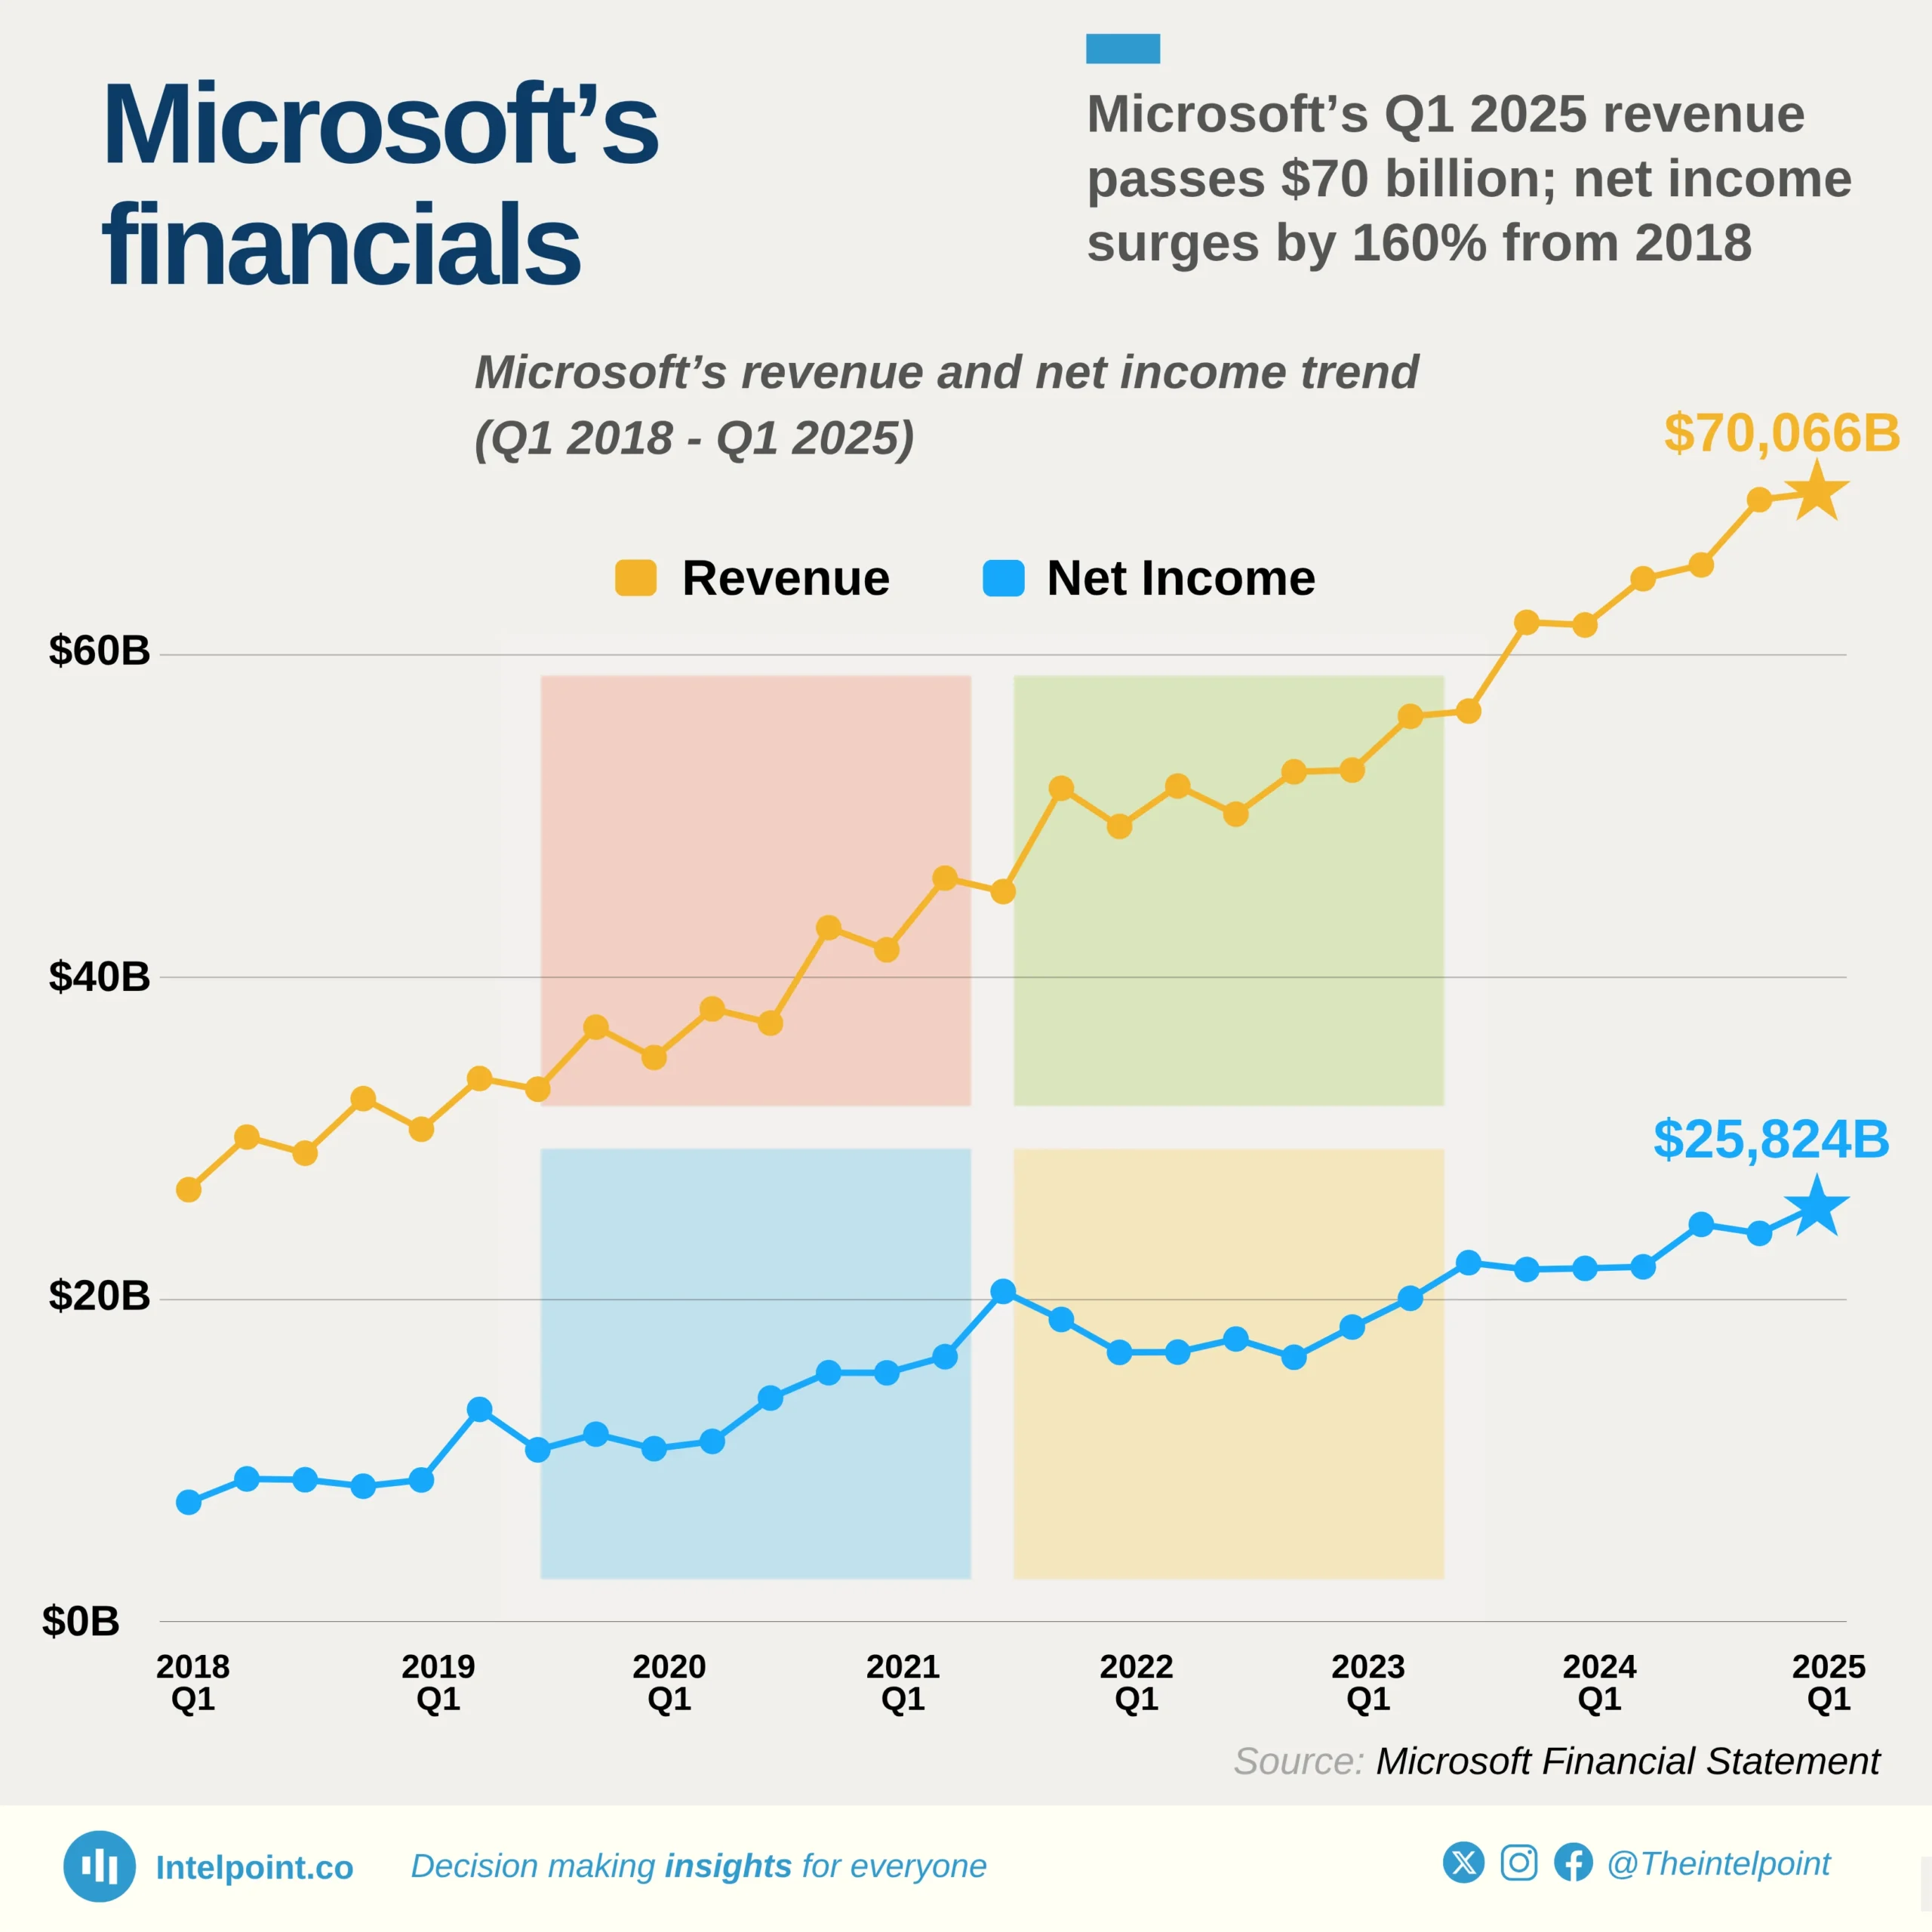
Microsoft’s financial performance between 2018 and 2025 paints a compelling picture of robust and consistent growth. Starting with $26.8 billion in revenue in Q1 2018, the tech giant steadily expanded its earnings, culminating in $70.1 billion by Q1 2025, a more than 2.5x increase in just seven years. This growth trajectory was not limited to top-line revenue; net income followed a similar upward path, moving from $7.4 billion to an all-time high of $25.8 billion over the same period.

The company’s most aggressive financial leap occurred post-2020, with revenue consistently surpassing the $50 billion mark from late 2021 onwards. Particularly notable is the period from 2023 to 2025, during which Microsoft achieved sustained quarterly net profits above $20 billion. This financial momentum reflects Microsoft’s operational efficiency, market dominance, and successful expansion across its cloud, enterprise, and AI-driven services, positioning it as one of the most profitable companies of the decade.

Source:

Microsoft Financial Statement

Period:

Q1 2018 - Q1 2025
HTML code to embed chart
Want a bespoke report?
Reach out
Tags
Related Insights

Protected: Zero Losses: Every Access Holdings’ subsidiary made a profit in H1 2025
  • Every subsidiary reported profit in H1 2025, compared to three loss-making units in H1 2024.
  • Nigeria’s profit eased, but stronger performance across other African markets helped support overall group results.
  • Zambia, Sierra Leone, the DRC, Cameroon, and Kenya showed notable turnarounds from previous low or negative earnings.
  • The UK operation remained a major contributor, reinforcing the benefits of Access Holdings’ diversified regional presence.

UBA is the only Tier 1 bank in Nigeria that grew its profit in the first three quarters of 2025 compared to 2024
  • FUGAZ posted a combined ₦2.91 trillion in profit from Q1 to Q3 of 2025.
  • Access Bank recorded the lowest PAT among the FUGAZ
  • UBA recorded a 3% year-on-year increase in PAT
  • FUGAZ recorded an average year-on-year percentage change of -11.2% for the period

Conoil's profit after tax soared 585% from 2020 to the 2023 peak; profit before tax jumped 471%
  • Profit Before Tax (PBT) surged 471% from ₦2.15 billion (2020) to ₦12.28 billion (2023); Profit After Tax (PAT) jumped 585% to ₦9.87 billion.
  • Both metrics declined ~11% from the 2023 peak but remained well above historical averages.
  • Effective tax rate fell from 38% (2012) to 20% (2024), allowing the company to retain 80% of pre-tax profits.
  • Absolute tax payments increased from an average of ₦1.01 billion (2011-2020) to ₦2.30 billion (2021-2024), reflecting higher profitability.

Nigeria exited the FATF grey list in October 2025, after being placed on it in February 2023, approximately 32 months later
  • Nigeria exited the FATF grey list in October 2025, after 32 months of monitoring.
  • The country was added to the grey list in February 2023 due to technical compliance shortcomings.
  • FATF conducted an assessment of Nigeria’s AML/CFT measures in 2008, marking the beginning of its oversight of the measures.
  • Between 2010 and 2013, Nigeria appeared repeatedly in FATF statements for strategic AML/CFT deficiencies.

Stablecoins are the most frequently transacted asset for outbound payments among Nigerian users (38.3%), outpacing bitcoin (27.3%)
  • Stablecoins lead the market, accounting for 38.3% of all crypto sent, highlighting Nigerians’ preference for stability and dollar-backed assets.
  • Bitcoin ranks second at 27.3%, showing it remains a major channel for store-of-value transfers and remittances.
  • Altcoins like SOL, ADA, SHIB, and DOGE (15.4%) attract younger and experimental users but remain secondary to stable assets.
  • Ethereum (10.2%) and BNB (8.9%) maintain moderate transaction volumes, suggesting users favor low-fee and widely accepted tokens for transfers.

Over 40% of surveyed Nigerian crypto users are students
  • Students are the largest crypto-holding group (43.6%), underscoring the youthful nature of Nigeria’s crypto community and their early adoption of digital finance.
  • Entrepreneurs follow closely (25.7%), showing strong participation from self-employed Nigerians, traders, business owners, and hustlers who use crypto for investment and business flexibility.
  • Traditional employees make up 17.4%, indicating growing acceptance of crypto beyond informal or youth circles, even among salary earners.
  • Freelancers and gig workers (5.6%) also feature, reflecting crypto’s role in global online work and cross-border earnings. Unemployed and retired individuals remain a small minority, under 3.5% combined.

POPULAR TOPICS
SIGN UP TO OUR NEWSLETTER
Get periodic updates about the African startup space, access to our reports, among others.
Subscribe Here
Subscription Form

A product of Techpoint Africa. All rights reserved