Wheat accounted for 46.43% of the United States’ agricultural exports to Nigeria in 2024

Key Takeaways:

  • The United States exported $318.7 million worth of agricultural products to Nigeria in 2024.
  • Wheat accounted for nearly half of the US' agricultural exports to Nigeria, valued at $148 million.
  • The trade balance substantially favours the United States, with exports to Nigeria ($318.7 million) nearly double imports ($114.7 million).
  • The top three products account for 74.49% of all agricultural exports to Nigeria.

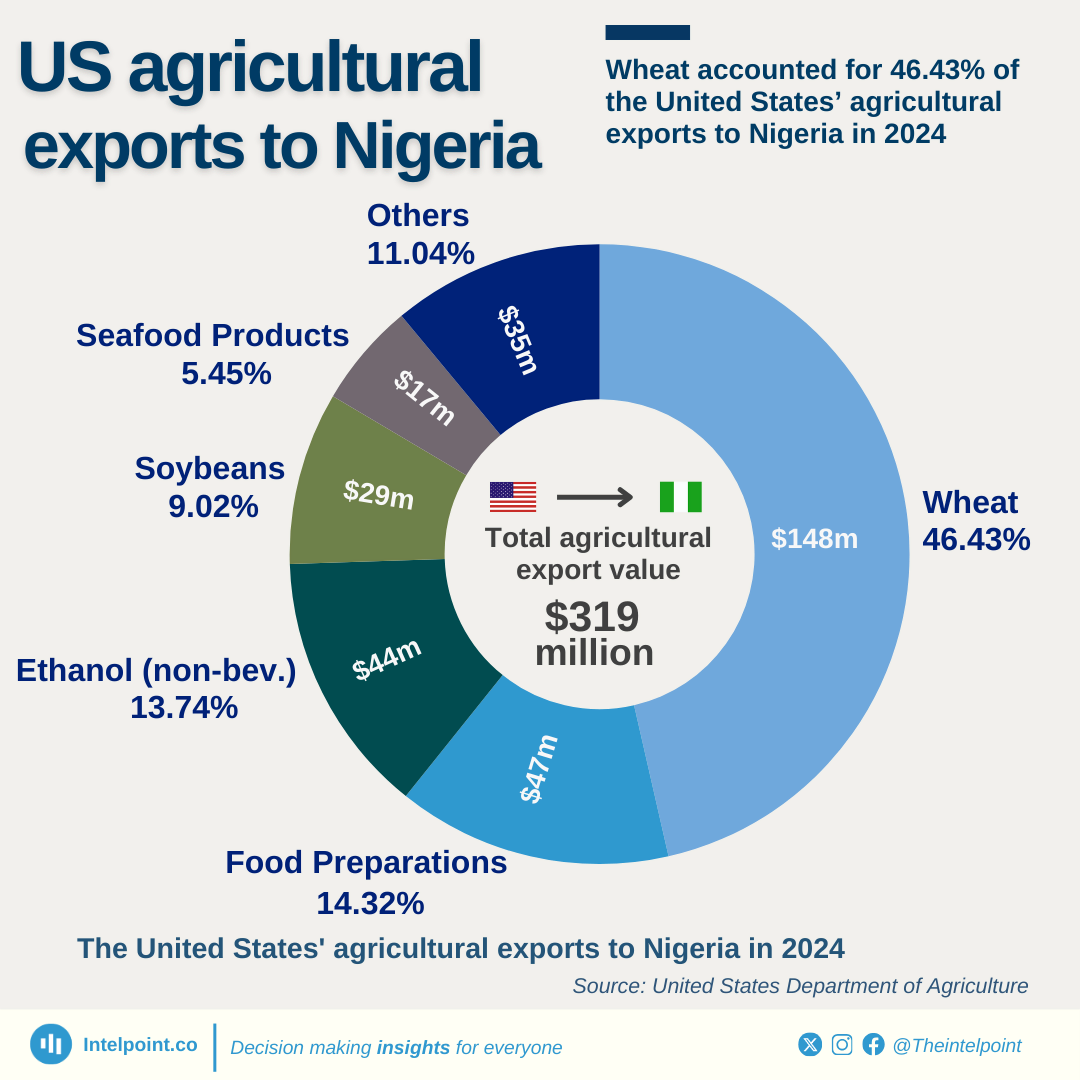
In 2024, the US exported $318.7 million in agricultural products to Nigeria.  Wheat emerged as the top export at $147.97 million, and accounted for nearly half (46.43%) of all exports.

Processed food preparations and non-beverage ethanol followed at 14.3% and 13.7%, respectively.  Soybeans and seafood products were also substantial exports, totalling more than $46 million.

Source:

United States Department of Agriculture

Period:

2024
HTML code to embed chart
Want a bespoke report?
Reach out
Tags
Related Insights

Nigeria's energy goods imports have stayed low and stable for 7 years, while exports increased from ₦37B to ₦263B
  • Nigeria’s energy goods exports rose from ₦37.3B in 2017 to ₦262.9B in 2024, before falling to ₦154.2B in H1 2025.
  • Imports remained consistently low, ranging from ₦24.2M to ₦353.1M throughout the period.
  • Export growth outpaced imports, showing a widening trade surplus in energy goods.
  • The 2024 spike in exports represents the highest export value within the nine-year window.
  • Energy imports stayed below ₦400M yearly, indicating low dependency on foreign energy goods.

For most of the period (2013-H1 2025), China's share of Nigeria's imports from Asia hovers around 50%-55%, showing dominance
  • China has dominated Nigeria’s imports from Asia, maintaining a 50–55% share for most of the period.
  • China’s share reached its highest level at 58.6% in H1 2025.
  • India's import share remained volatile, ranging between 11% and 25%.
  • Total imports from Asia surged from ₦2.6 trillion in 2013 to ₦16.4 trillion in H1 2025.

Nigeria's agricultural imports' share has been dropping, from 83.9% (2017) to a low of 42.9% (H1 2025)
  • Agricultural imports fell from 83.9% in 2017 to 42.9% in H1 2025, indicating a significant decline in import dependency.
  • Agricultural exports grew from 16.1% in 2017 to 54.0% in 2024, surpassing imports for the first time since 2017.
  • Total agricultural trade increased from ₦1.1 trillion in 2017 to ₦8.2 trillion in 2024.
  • Between 2022 and 2024, the import share dropped significantly from 75.7% to 46.0%.

Crude oil imports in Nigeria emerged in H1 2025 (the first since 2017), capturing a 10.2% share of the total crude oil trade
  • Crude oil imports into Nigeria in H1 2025 marked the first occurrence since 2017.
  • Crude oil imports accounted for 10.2% of total crude oil trade.
  • From 2017 to 2024, exports made up 100% of crude oil trade annually.
  • Total crude oil trade peaked at ₦55.3 trillion in 2024.
  • The emergence of crude oil imports can be linked to domestic refinery operations, especially the Dangote Refinery.

Asia and Europe (combined) have consistently represented over 70% of Nigeria's total imports since 2013
  • Asia and Europe have consistently represented over 70% of Nigeria’s imports since 2013.
  • Asia’s share of imports reached a record 53.5% in H1 2025.
  • Europe contributed 23.1% of total imports in H1 2025.
  • Imports from the American region averaged between 10%–14% over the period.
  • Africa’s import share remained below 10%, showing limited regional trade.

The Netherlands held the largest share of Nigeria's imports from Europe for most of the period, averaging 20% of annual imports
  • The Netherlands has mostly been the top European import source, with Nigeria averaging 20% of annual imports from the region.
  • Netherlands' highest share of Nigeria's imports was 27.9% in 2018.
  • The United Kingdom consistently contributed around 5–15% of Nigeria’s European imports.
  • Germany’s share remained relatively stable at 5–10% over the years.
  • France, Italy, and Spain maintained smaller shares, mostly under 7%.

POPULAR TOPICS
SIGN UP TO OUR NEWSLETTER
Get periodic updates about the African startup space, access to our reports, among others.
Subscribe Here
Subscription Form

A product of Techpoint Africa. All rights reserved