Egypt and Morocco lead Africa’s trade deficit with a combined $50.8 billion

Key takeaways

  • Egypt and Morocco dominate Africa’s trade deficit, with a combined shortfall of $50.8 billion dollars, which surpasses the total deficit of the other eight countries on the list
  • North African economies — Egypt, Morocco and Tunisia — account for more than half of the total trade deficit across the top 10
  • East African economies also feature prominently, with Ethiopia, Kenya, and Tanzania making up a significant share of the deficit
  • Smaller economies like Rwanda and Uganda post notable deficits, though on a much smaller scale than their North and East African counterparts

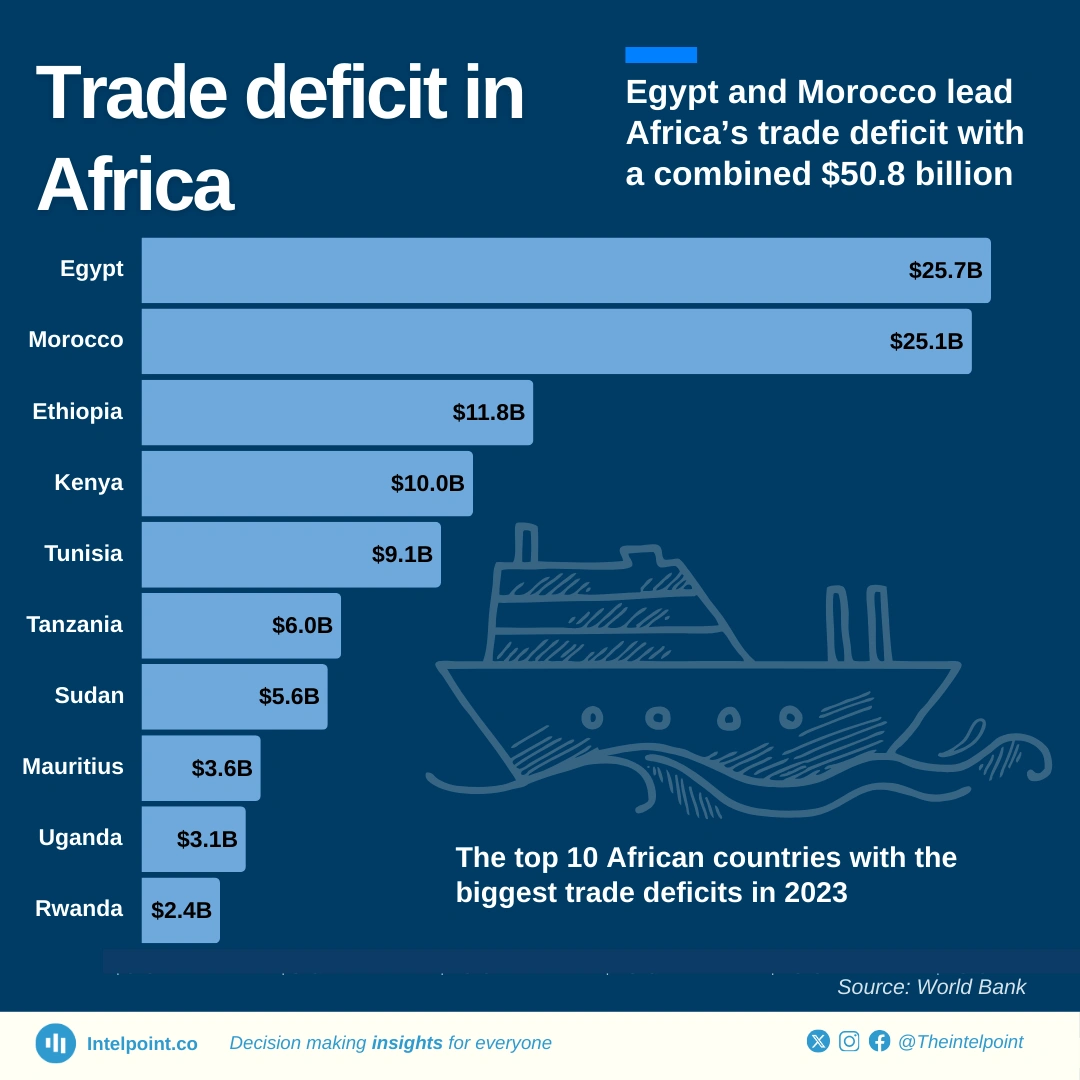
Africa’s trade deficit is largely driven by two countries, Egypt and Morocco, whose combined $50.8 [billion shortfall] exceeds the total trade deficit of the next eight largest contributors. The presence of East African economies like Tanzania and Kenya suggests that multiple regions on the continent struggle with import dependency.

Source:

World Bank

Period:

2023
HTML code to embed chart
Want a bespoke report?
Reach out
Tags
Related Insights

Nigeria's energy goods imports have stayed low and stable for 7 years, while exports increased from ₦37B to ₦263B
  • Nigeria’s energy goods exports rose from ₦37.3B in 2017 to ₦262.9B in 2024, before falling to ₦154.2B in H1 2025.
  • Imports remained consistently low, ranging from ₦24.2M to ₦353.1M throughout the period.
  • Export growth outpaced imports, showing a widening trade surplus in energy goods.
  • The 2024 spike in exports represents the highest export value within the nine-year window.
  • Energy imports stayed below ₦400M yearly, indicating low dependency on foreign energy goods.

For most of the period (2013-H1 2025), China's share of Nigeria's imports from Asia hovers around 50%-55%, showing dominance
  • China has dominated Nigeria’s imports from Asia, maintaining a 50–55% share for most of the period.
  • China’s share reached its highest level at 58.6% in H1 2025.
  • India's import share remained volatile, ranging between 11% and 25%.
  • Total imports from Asia surged from ₦2.6 trillion in 2013 to ₦16.4 trillion in H1 2025.

Nigeria's agricultural imports' share has been dropping, from 83.9% (2017) to a low of 42.9% (H1 2025)
  • Agricultural imports fell from 83.9% in 2017 to 42.9% in H1 2025, indicating a significant decline in import dependency.
  • Agricultural exports grew from 16.1% in 2017 to 54.0% in 2024, surpassing imports for the first time since 2017.
  • Total agricultural trade increased from ₦1.1 trillion in 2017 to ₦8.2 trillion in 2024.
  • Between 2022 and 2024, the import share dropped significantly from 75.7% to 46.0%.

Crude oil imports in Nigeria emerged in H1 2025 (the first since 2017), capturing a 10.2% share of the total crude oil trade
  • Crude oil imports into Nigeria in H1 2025 marked the first occurrence since 2017.
  • Crude oil imports accounted for 10.2% of total crude oil trade.
  • From 2017 to 2024, exports made up 100% of crude oil trade annually.
  • Total crude oil trade peaked at ₦55.3 trillion in 2024.
  • The emergence of crude oil imports can be linked to domestic refinery operations, especially the Dangote Refinery.

Asia and Europe (combined) have consistently represented over 70% of Nigeria's total imports since 2013
  • Asia and Europe have consistently represented over 70% of Nigeria’s imports since 2013.
  • Asia’s share of imports reached a record 53.5% in H1 2025.
  • Europe contributed 23.1% of total imports in H1 2025.
  • Imports from the American region averaged between 10%–14% over the period.
  • Africa’s import share remained below 10%, showing limited regional trade.

The Netherlands held the largest share of Nigeria's imports from Europe for most of the period, averaging 20% of annual imports
  • The Netherlands has mostly been the top European import source, with Nigeria averaging 20% of annual imports from the region.
  • Netherlands' highest share of Nigeria's imports was 27.9% in 2018.
  • The United Kingdom consistently contributed around 5–15% of Nigeria’s European imports.
  • Germany’s share remained relatively stable at 5–10% over the years.
  • France, Italy, and Spain maintained smaller shares, mostly under 7%.

POPULAR TOPICS
SIGN UP TO OUR NEWSLETTER
Get periodic updates about the African startup space, access to our reports, among others.
Subscribe Here
Subscription Form

A product of Techpoint Africa. All rights reserved