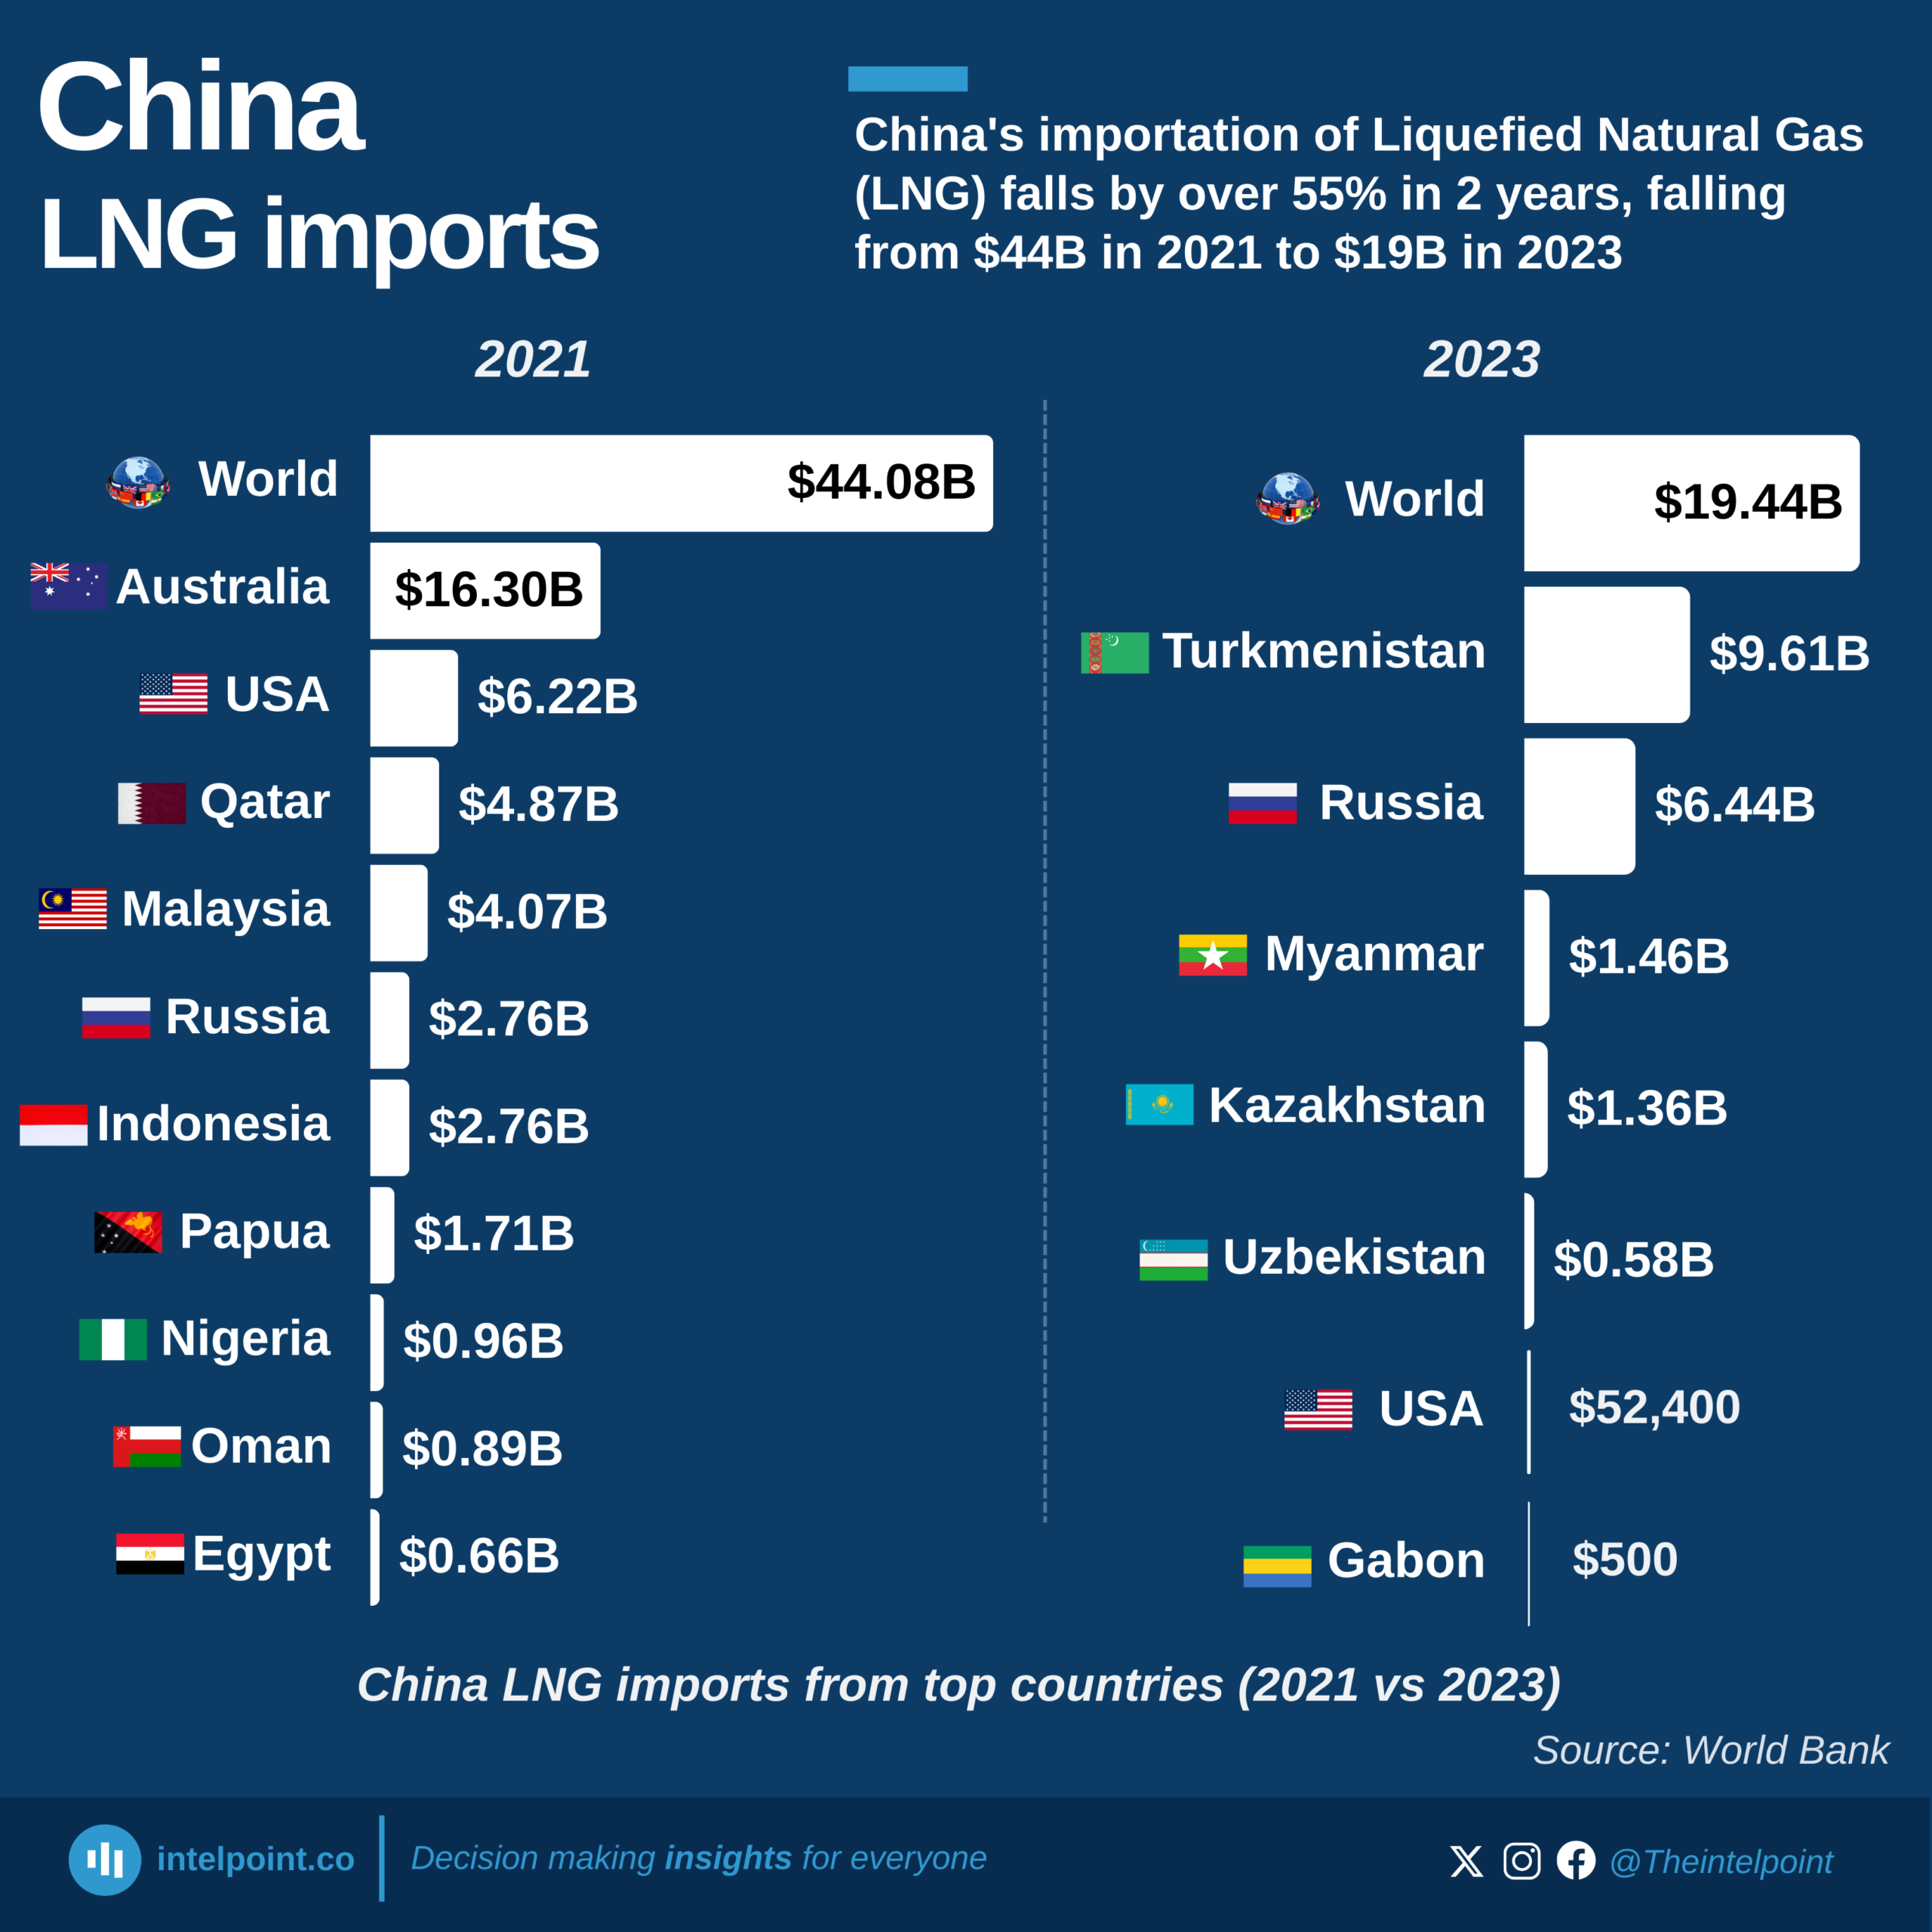
China's importation of Liquefied Natural Gas (LNG) falls by over 55% in 2 years, falling from $44B in 2021 to $19B in 2023

Key takeaways:

  • China's total LNG imports dropped by over 55%, from $44 billion in 2021 to $19.4 billion in 2023, showing a significant reduction in demand and a shift in sourcing.
  • Australia, which was China’s largest LNG supplier in 2021 ($16.3 billion), is no longer among the sources in 2023, signaling a shift in China’s energy diversification strategy.
  • Russia and Turkmenistan have emerged as dominant suppliers in 2023, with Turkmenistan leading at $9.61 billion and Russia following at $6.44 billion
  • The U.S. has nearly disappeared from China's LNG market, dropping from $6.22 billion in 2021 to just $52,400 in 2023, a staggering 99.99% decline, likely due to geopolitical tensions and trade policies.

China’s importation of Liquefied Natural Gas (LNG) has declined, dropping from $44 billion in 2021 to just $19.4 billion in 2023. This steep fall of over 55% reflects a major shift in China’s energy-sourcing strategy. In 2021, Australia led as the top supplier with $16.3 billion in LNG exports to China, but by 2023, the entire landscape had changed, with Turkmenistan ($9.61 billion) and Russia ($6.44 billion) emerging as the dominant suppliers.
2021 also saw importations from Nigeria and other 26 countries, but in 2023, importations were just from 7 countries with Nigeria out of the scene.
This shift is not just about numbers, it tells a bigger story about geopolitical realignments and shifting trade preferences. The near disappearance of traditional suppliers like the U.S., Australia, and Qatar from China’s top LNG sources indicates a major transformation in global energy flows. The United States, which supplied $6.22 billion worth of LNG in 2021, saw its exports to China go down to an almost negligible $52,400 by 2023.
Source:

World Bank

Period:

2021 and 2023
HTML code to embed chart
Want a bespoke report?
Reach out
Tags
Related Insights

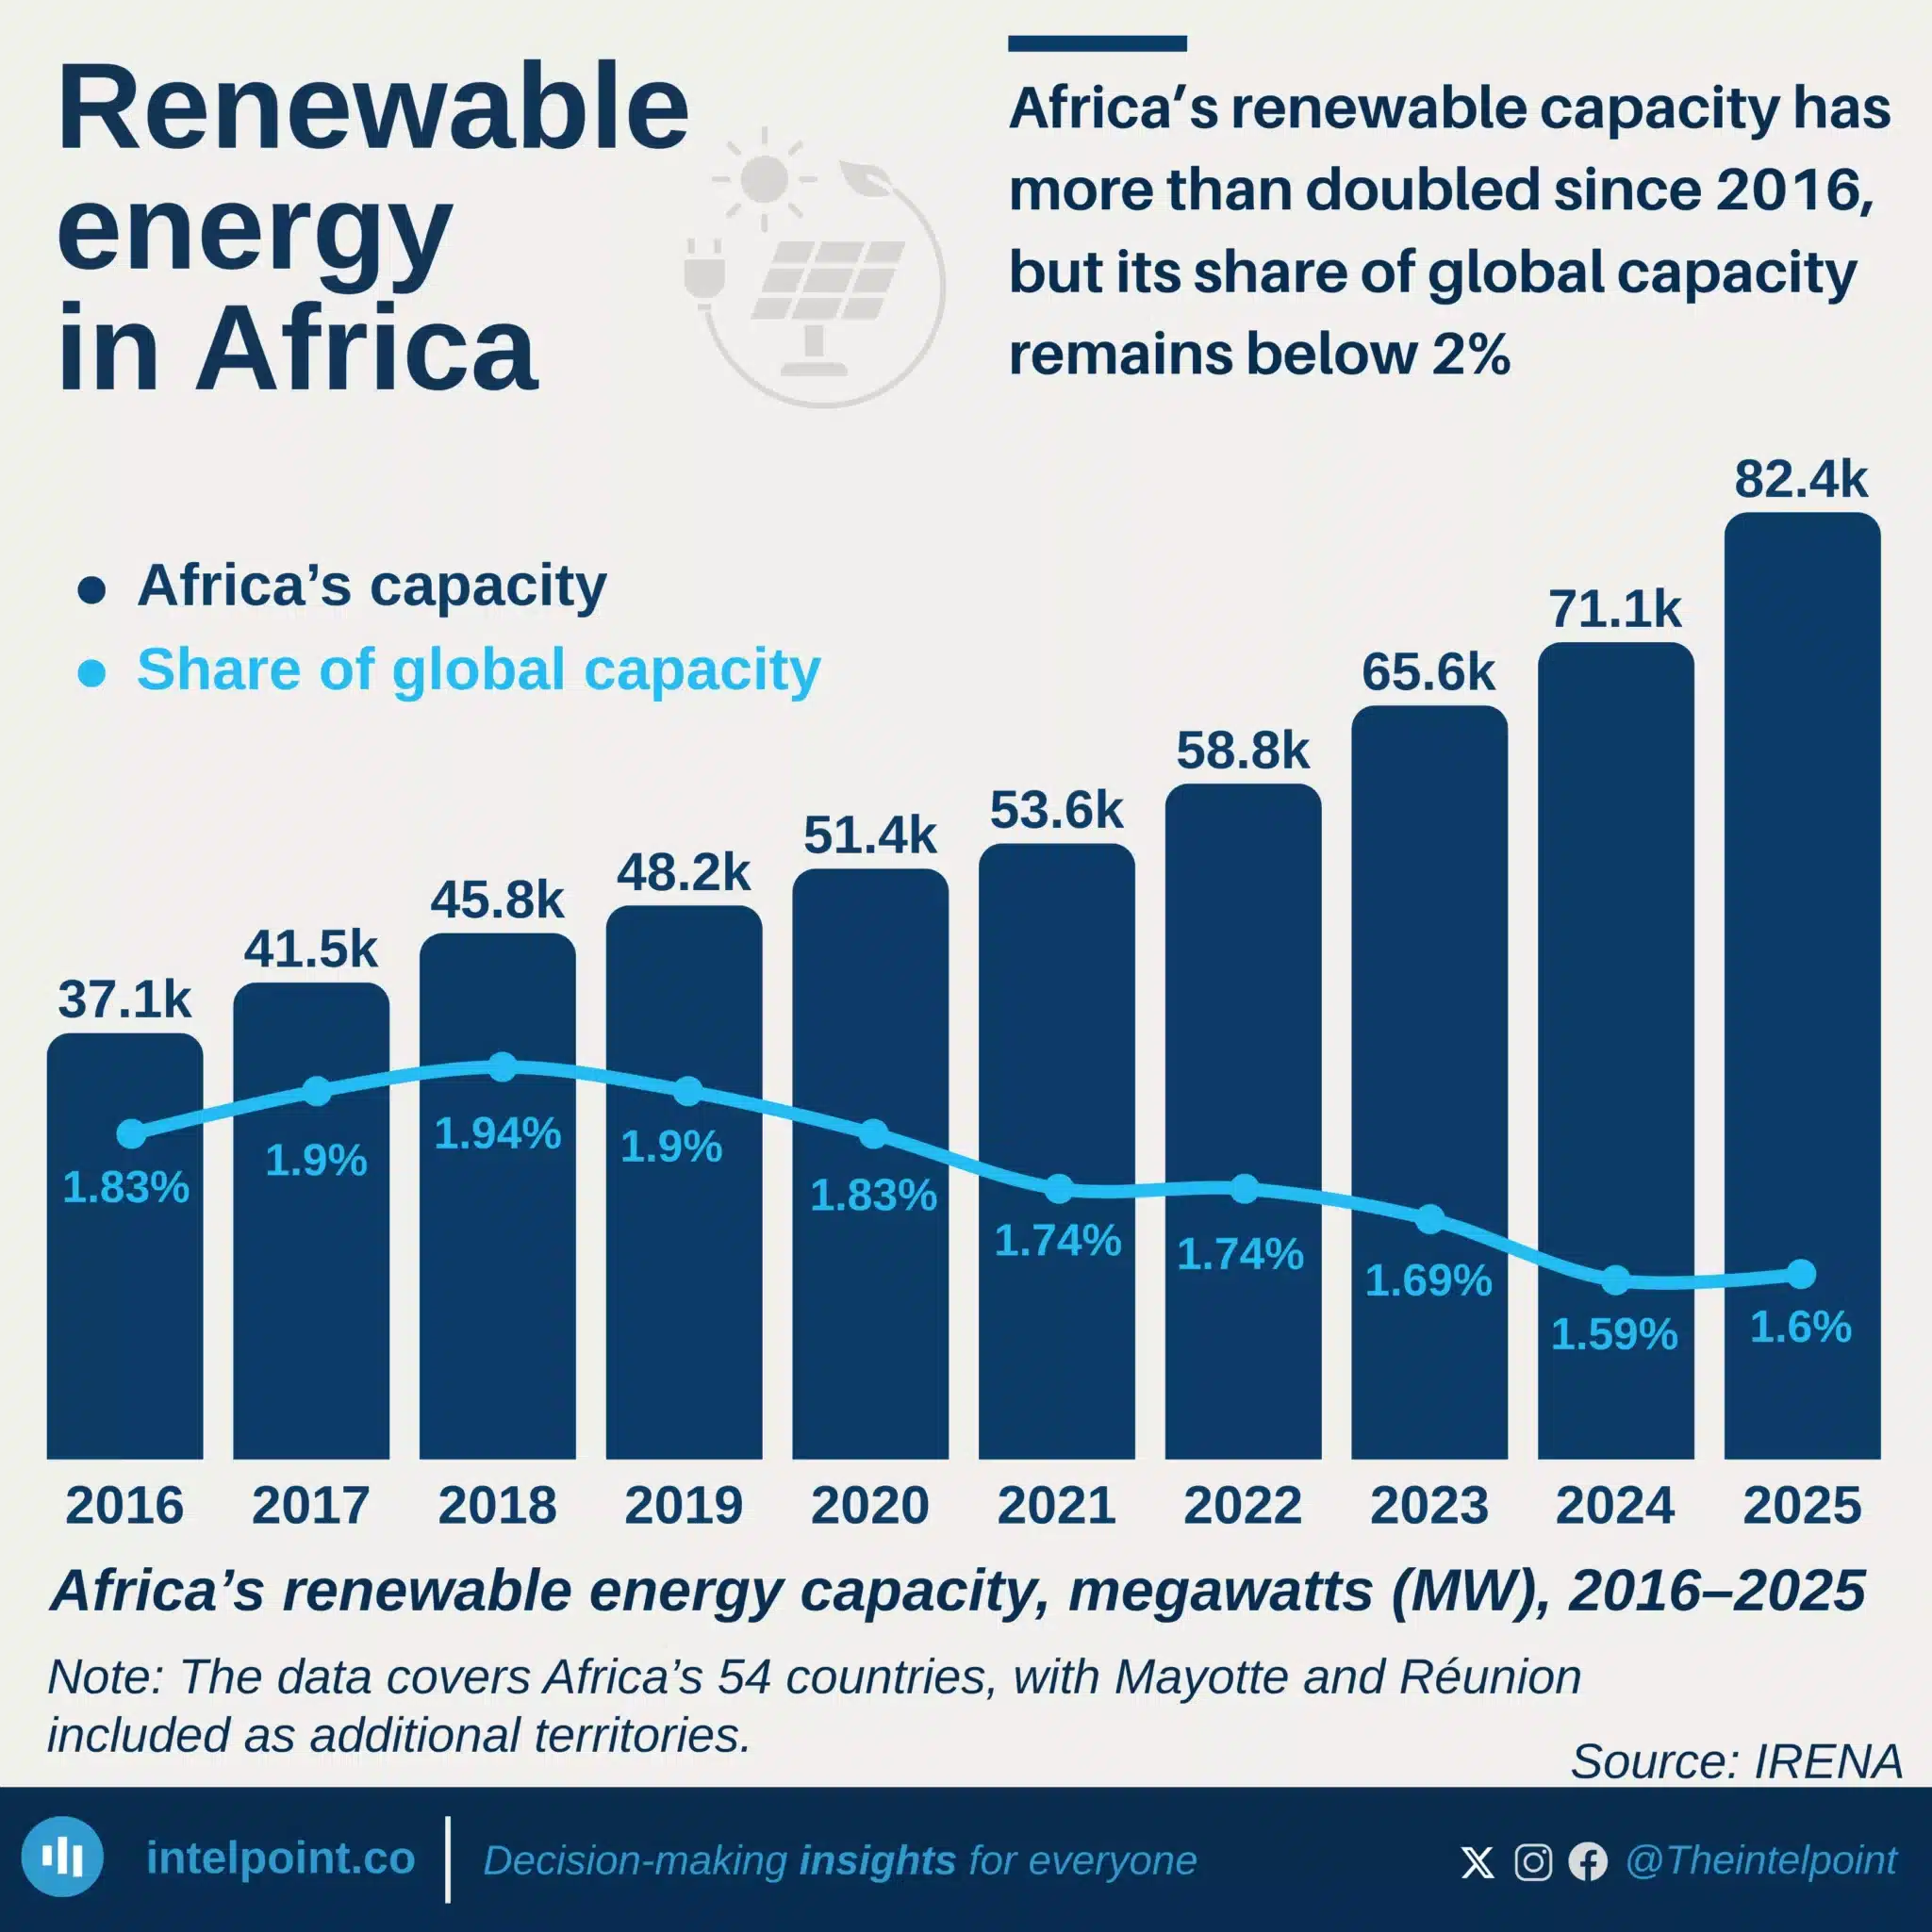
Africa’s renewable capacity has more than doubled since 2016, but its share of global capacity remains below 2%
  • About 600 million Africans still lack access to electricity.
  • Africa has 20% of the world's population but receives less than 3% of global energy investment.
  • South Africa added the most renewable capacity from 2016–2025, followed by Ethiopia, Egypt, Morocco and Tanzania.
  • Africa's renewable capacity is growing, but its share of global capacity remains small.

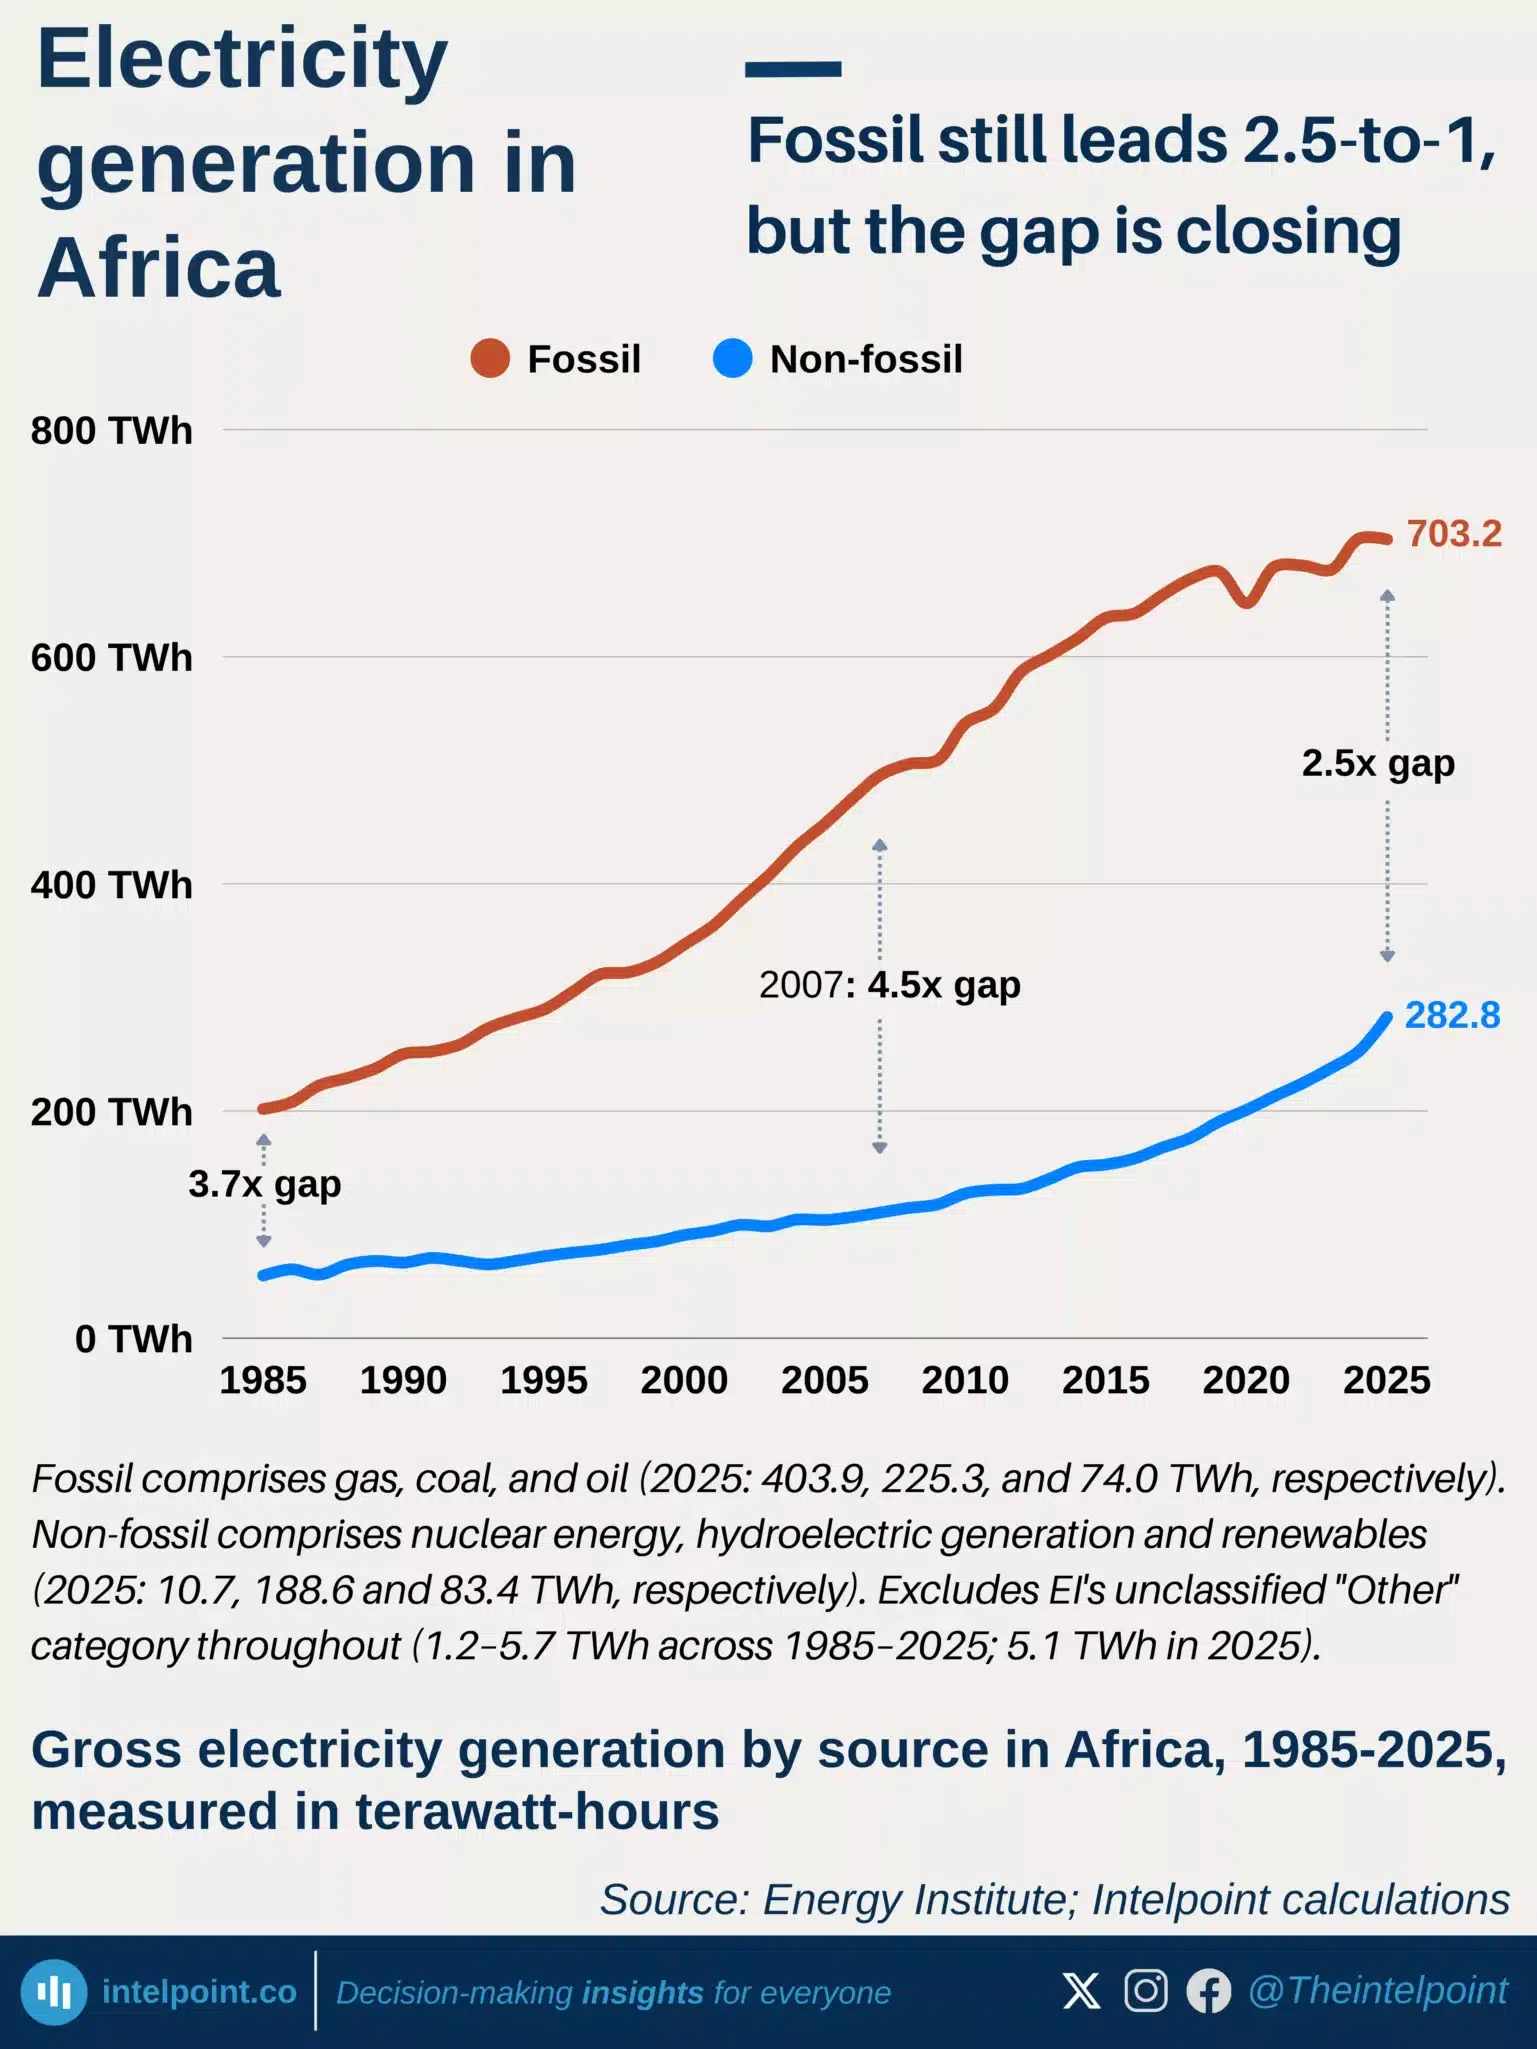
Electricity generation in Africa: fossil still leads 2.5-to-1, but the gap is closing
  • Fossil fuels still generate 2.5x more electricity than non-fossil sources, though the gap has narrowed from a 2007 peak of 4.5x.
  • South Africa and Egypt together account for all of Africa's nuclear power and 59% of its non-hydro renewables.
  • Hydropower, the largest non-fossil source at 188.6 TWh, tells a different geographic story, with 91% generated outside South Africa and Egypt, mainly in Eastern, Middle, and Western Africa.
  • Gas still leads at 403.9 TWh, but its growth slowed to 0.8% in 2025 versus 11.9% growth for non-fossil sources.

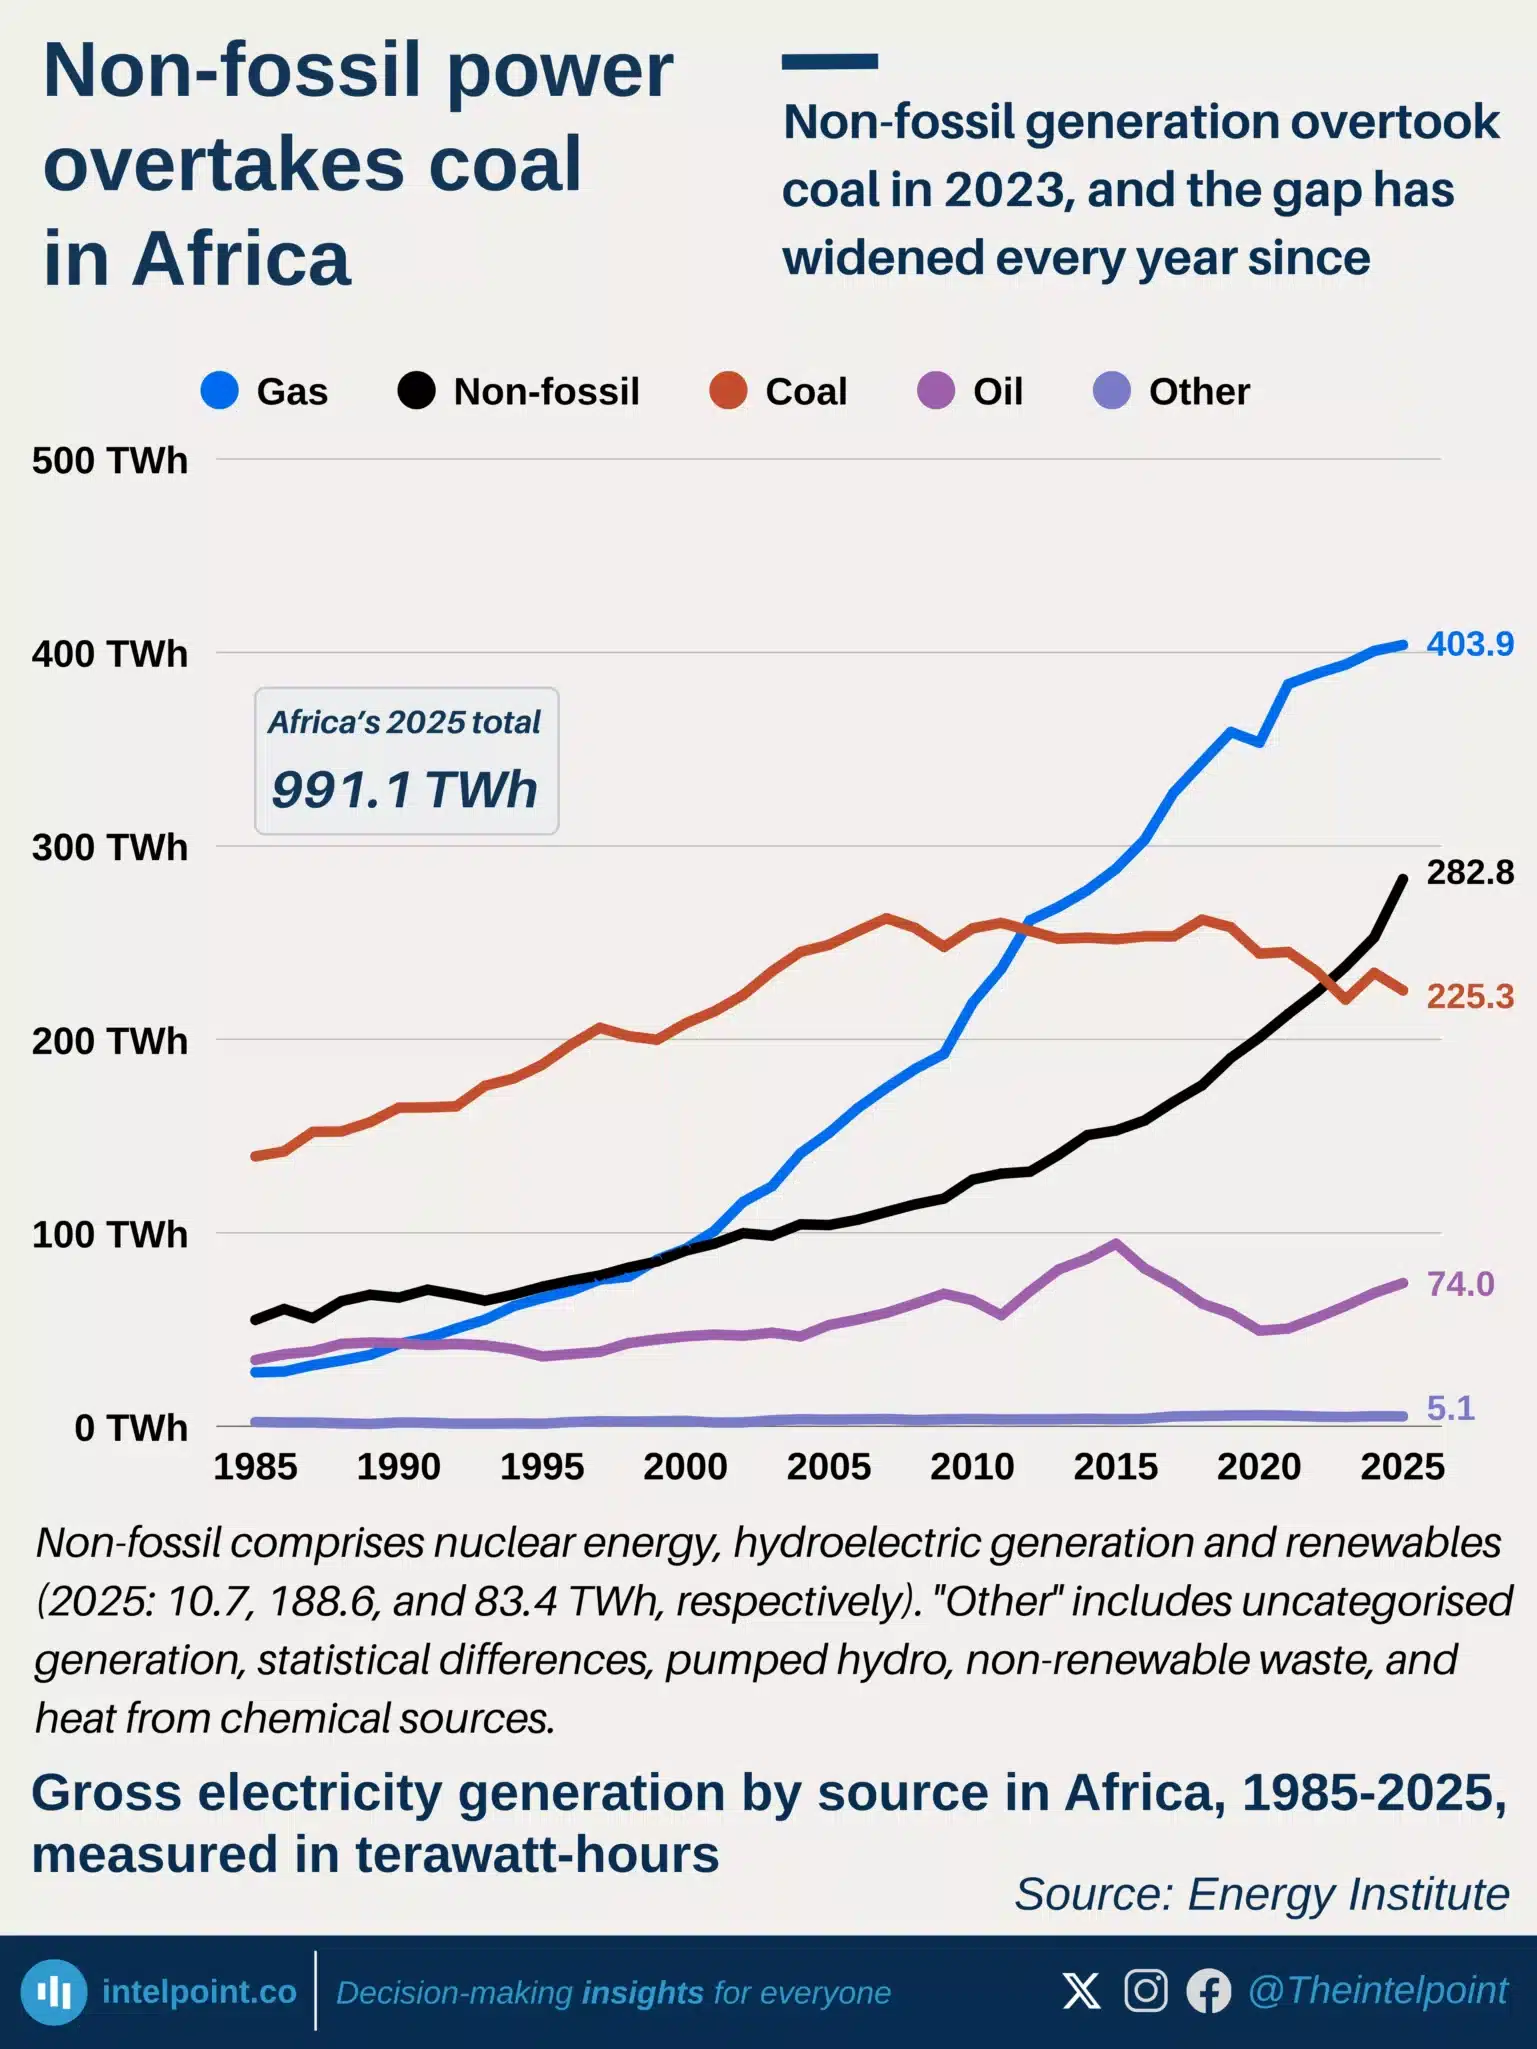
Non-fossil generation overtook coal in 2023, and the gap has widened every year since
  • Non-fossil generation overtook coal in 2023, with the gap reaching 57.5 TWh in 2025.
  • Coal generation fell to 225.3 TWh, below its 262.6 TWh peak in 2007.
  • Hydropower dominates non-fossil generation, producing 188.6 TWh in 2025.
  • Fossil fuels still dominate, generating 703.2 TWh versus 282.8 TWh from non-fossil sources.

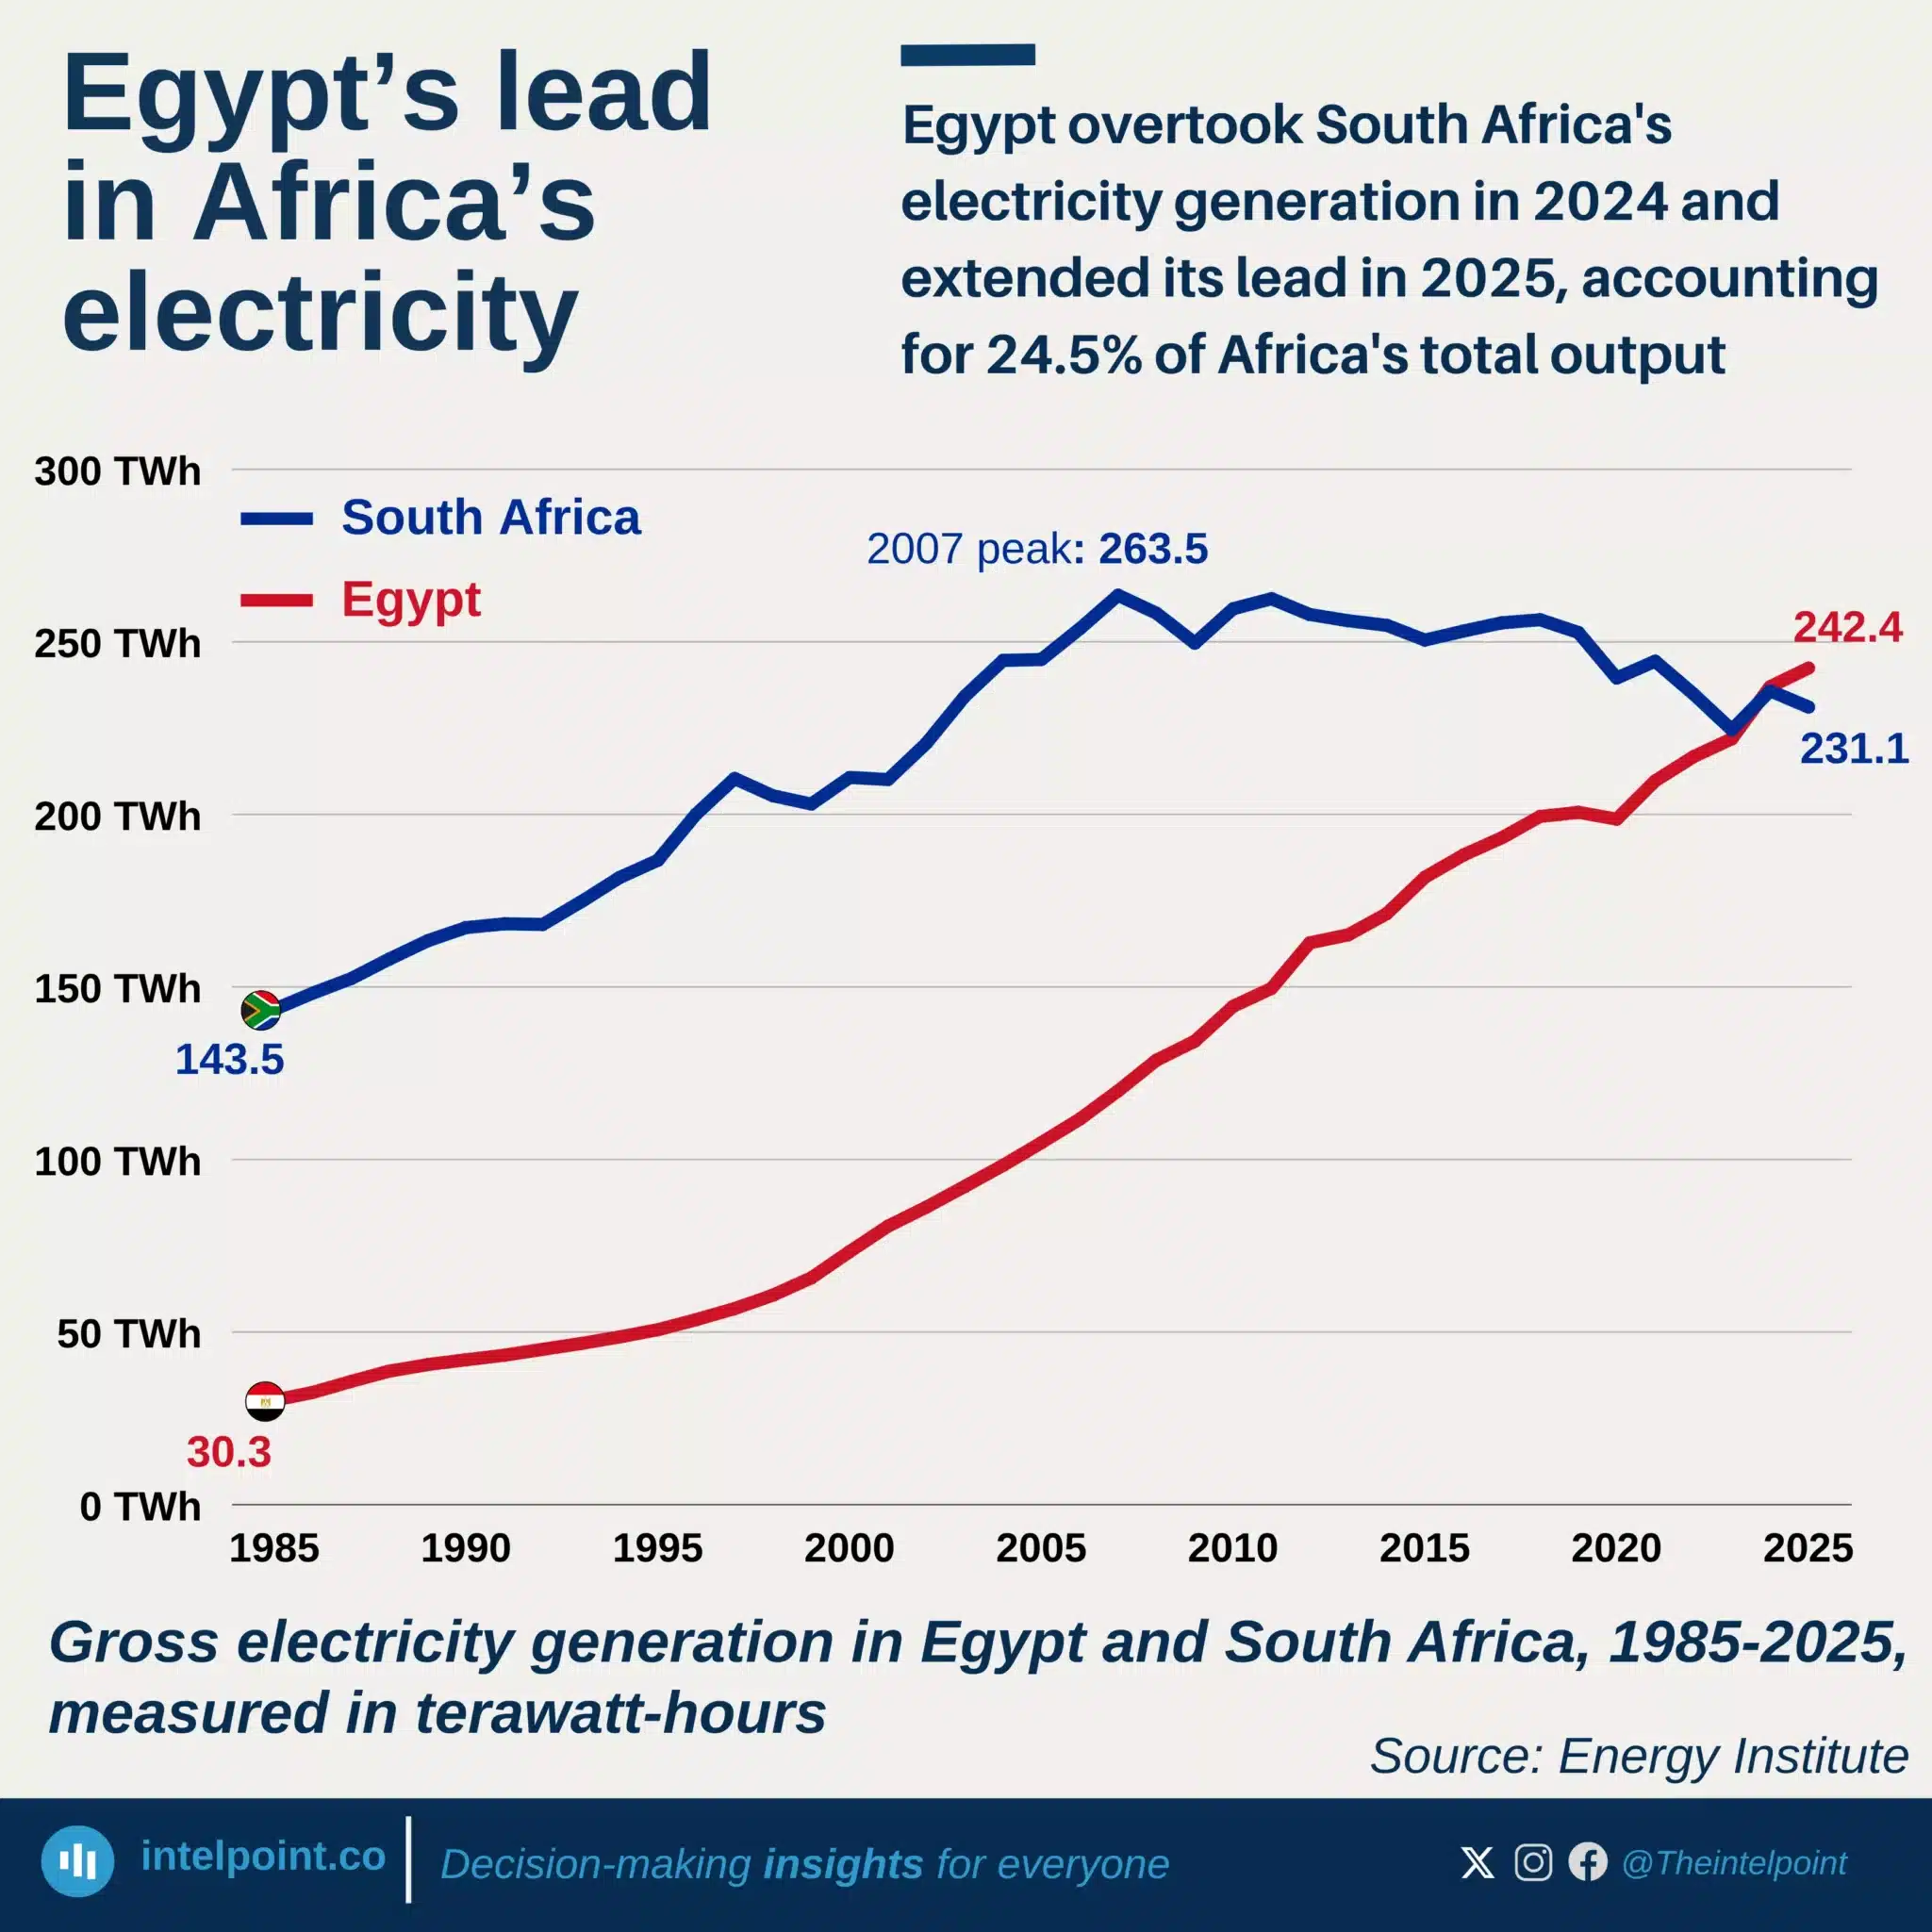
Egypt overtook South Africa's electricity generation in 2024 and extended its lead in 2025
  • Africa’s share of global electricity generation rose only from 2.6% in 1985 to 3.1% in 2025.
  • Africa’s electricity generation increased 283% over the past 40 years.
  • Egypt overtook South Africa as Africa’s largest electricity producer in 2024.
  • Egypt generated 242.4 TWh in 2025, up from 30.3 TWh in 1985.
  • South Africa generated 231.1 TWh in 2025, down from its 263.5 TWh peak in 2007.
  • Egypt and South Africa accounted for 24.5% of Africa’s electricity generation in 2025.

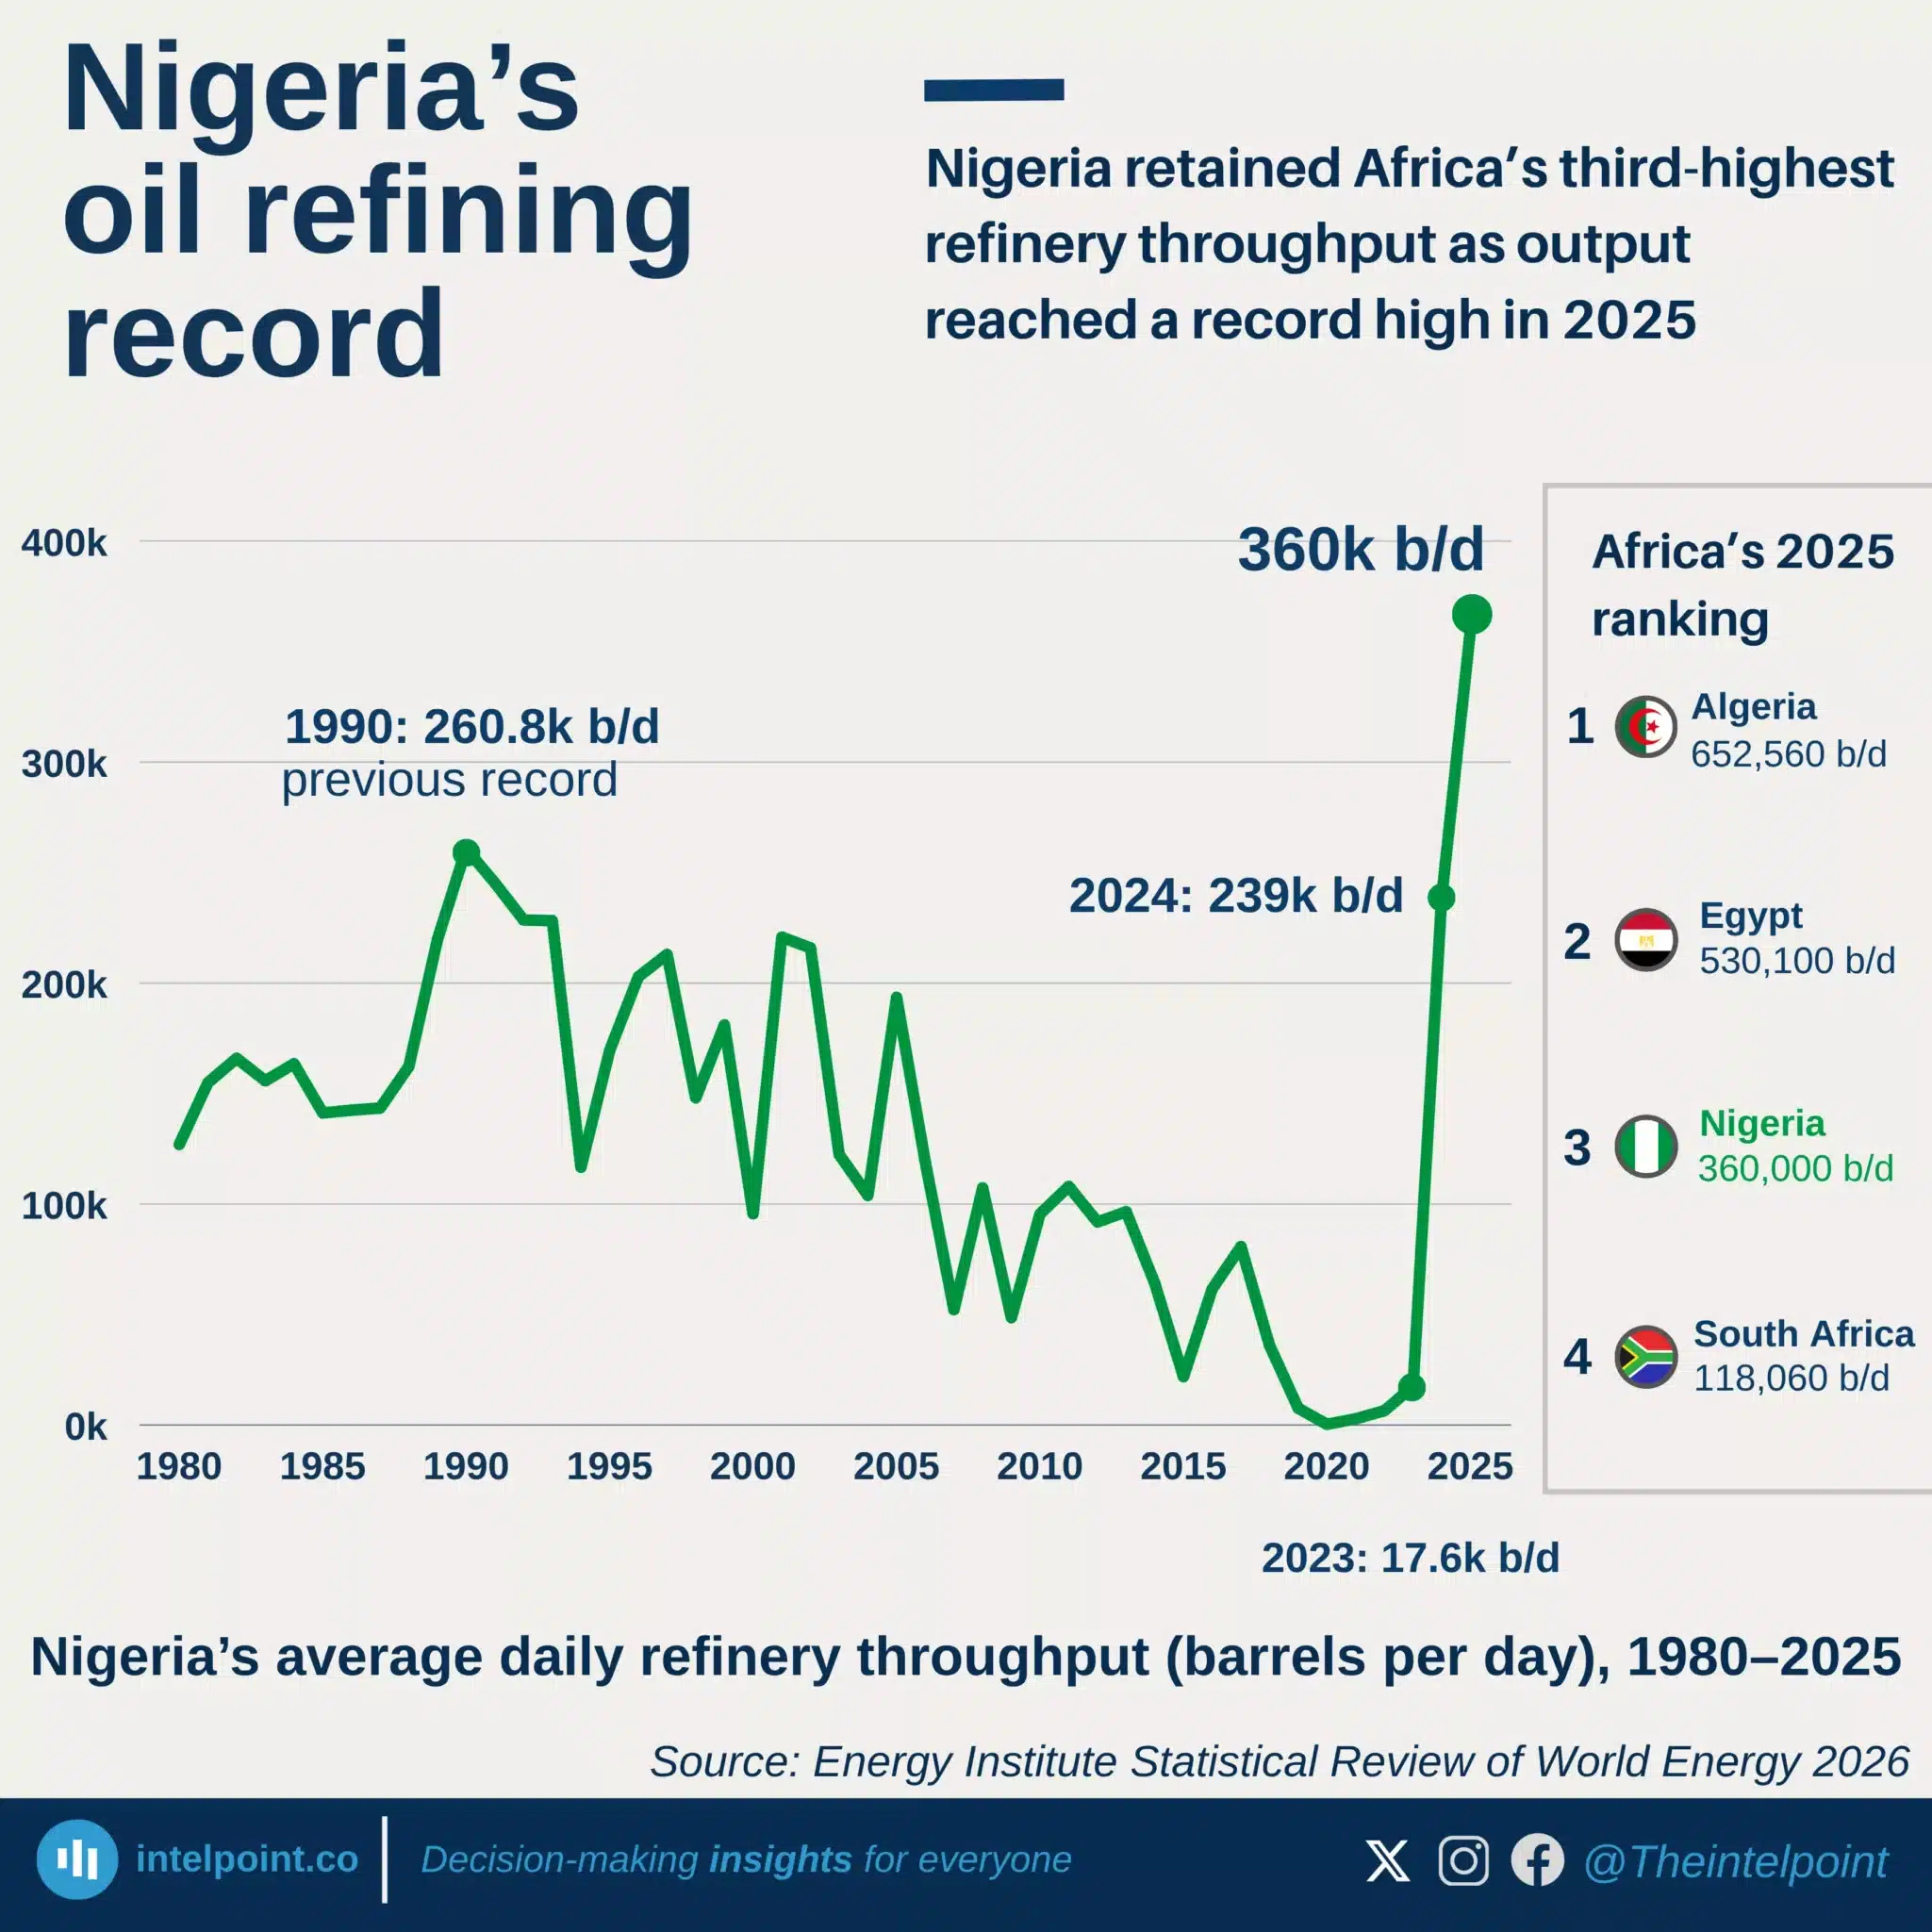
Nigeria retained Africa’s third-highest refinery throughput as output reached a record high in 2025
  • Nigeria recorded its highest refinery throughput since 1990 at 360,000 b/d.
  • Throughput increased by 50.6% from 239,000 b/d in 2024.
  • The 2025 level was more than 20 times the 17,600 b/d recorded in 2023.
  • Nigeria remained Africa’s third-highest, behind Algeria and Egypt.
  • Dangote’s contribution is not reported separately.

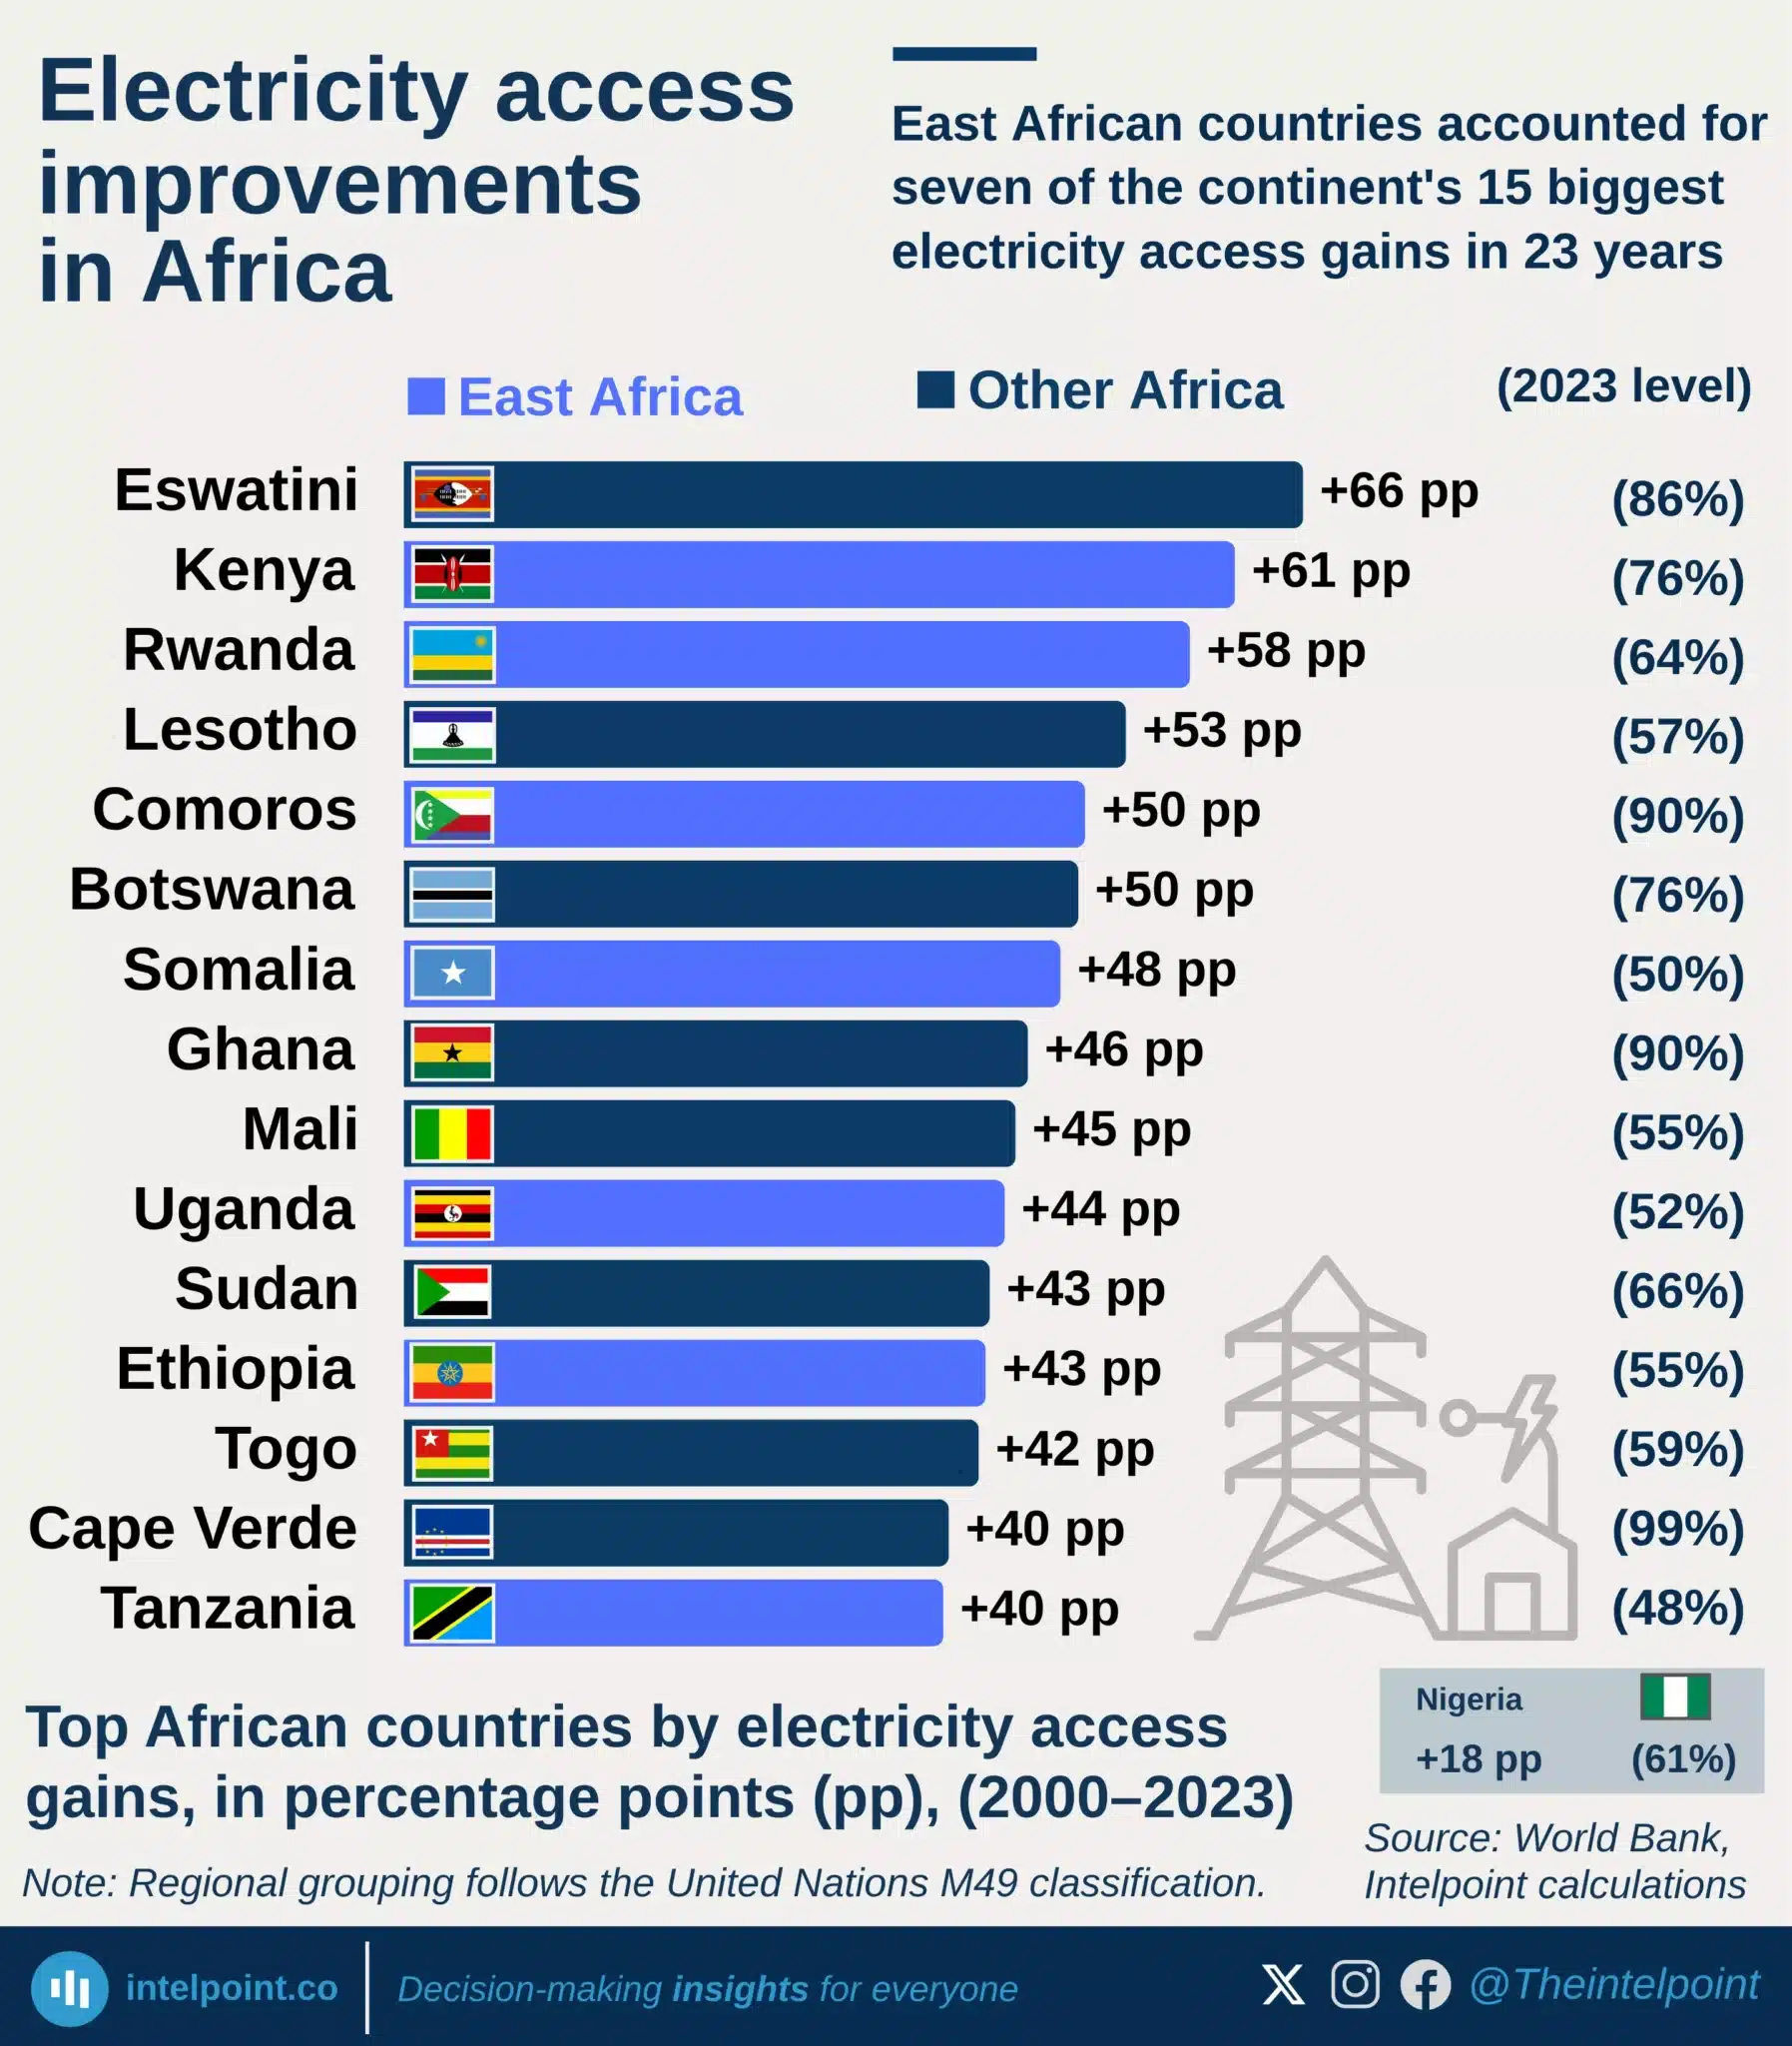
East African countries accounted for seven of the continent's 15 biggest electricity access gains in 23 years
  • Eswatini recorded Africa’s largest electricity access gain, rising by 66 percentage points from 2000 to 2023.
  • Kenya and Rwanda followed with gains of 61 pp and 58 pp, respectively.
  • East African countries accounted for 7 of Africa’s top 15 electricity access improvements.
  • Comoros, Ghana and Cape Verde reached very high access levels by 2023, at 90%, 90% and 99% respectively.
  • Nigeria’s electricity access improved by 18 percentage points, from 43% in 2000 to 61% in 2023.
  • Despite that improvement, Nigeria remained outside Africa’s top 15 gainers over the period.
  • Some countries were absent from the ranking because they had already reached high access levels by 2000.

POPULAR TOPICS
SIGN UP TO OUR NEWSLETTER
Get periodic updates about the African startup space, access to our reports, among others.
Subscribe Here
Subscription Form

A product of Techpoint Africa. All rights reserved