2024 Search Engine Market Share

Key Takeaways

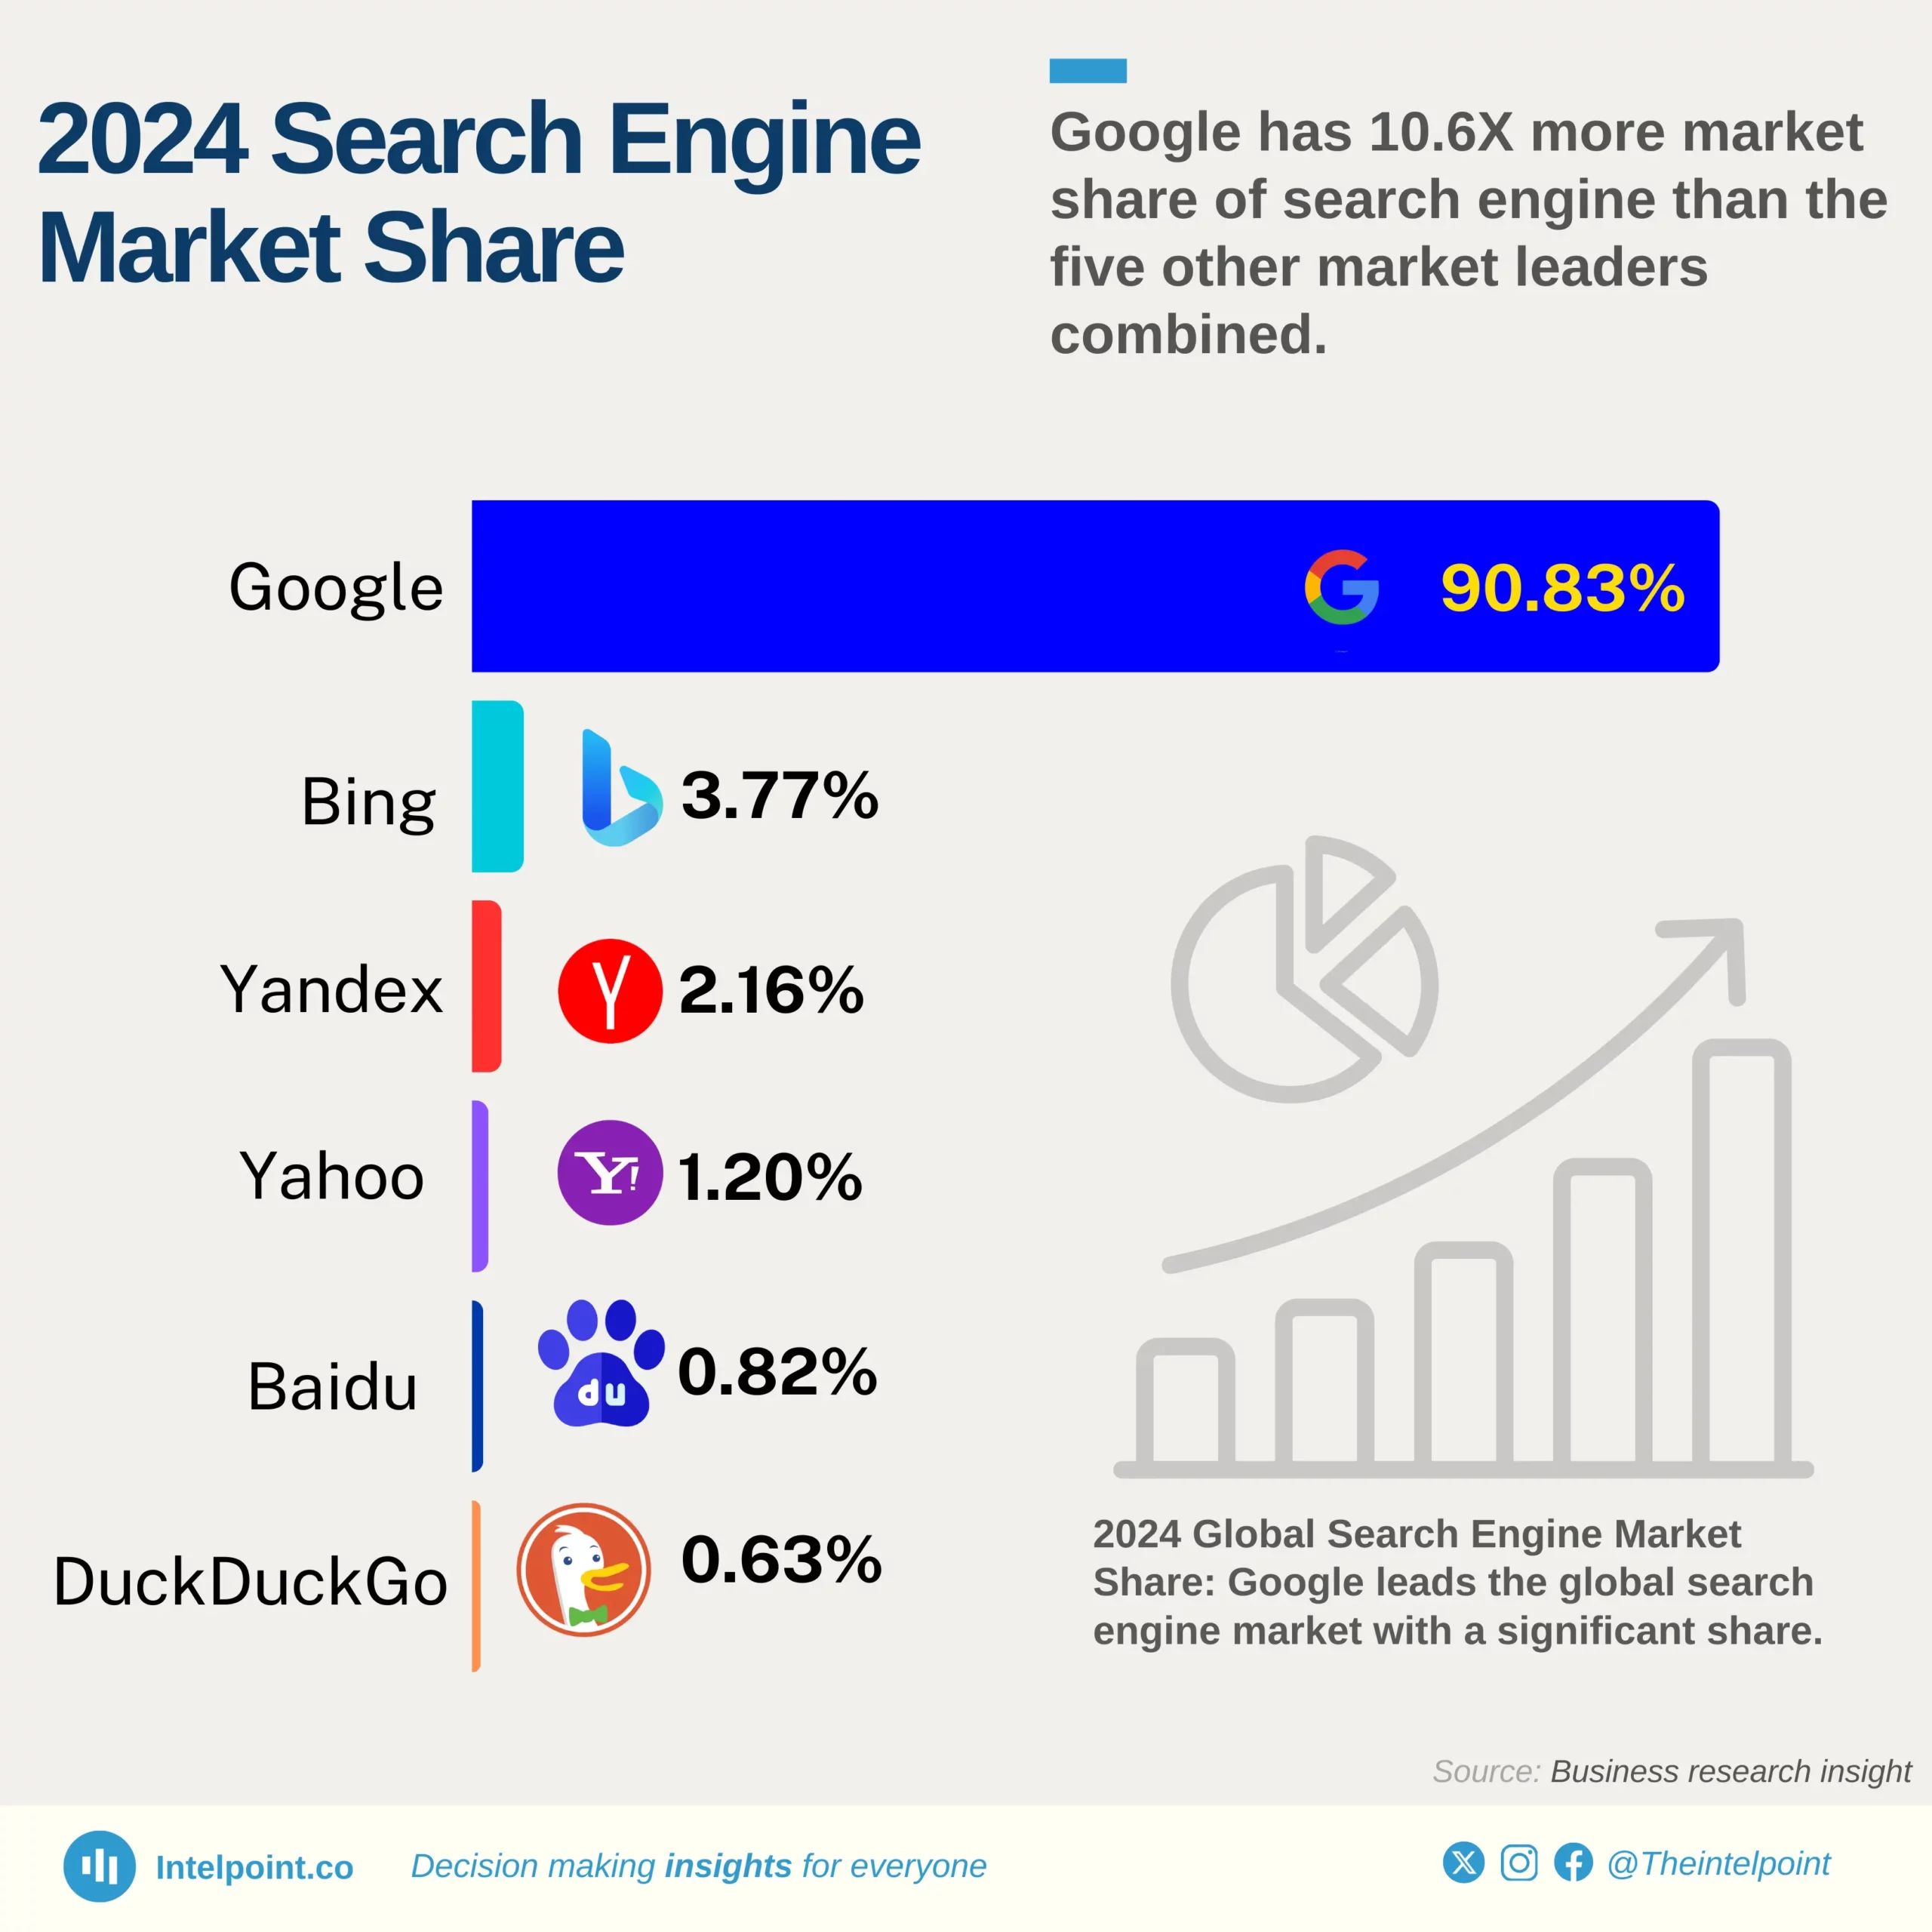
-Google has 10.6x more market share of search engine than the five other market leaders combined.
-Bing accounted for 3.77% of the global search market across all devices, while market leader Google held a search traffic share of around 90.83%.
-Yandex's market share was 2.16%, while Yahoo represented around 1.20%.
-Baidu and DuckDuckGo accounted for a combined market share of less than 2% with each Search engine holding under 1% individually.

Google's 90.83% market share is a stark reminder of its monopoly. The more we use it, the better it gets. Competitors like Bing and Yandex are struggling to catch up, with just 3.77% and 2.16% market share respectively revealing a widening gap between Google and its competitors.
Baidu and DuckDuckGo's combined market share of less than 2% highlights the immense challenge they face in competition. With each holding under 1% individually, they struggle to attract users creating a cycle of decline.

Source:

Business research insight

Period:

2024
HTML code to embed chart
Want a bespoke report?
Reach out
Tags
Related Insights

On average, each person spends a total of 3 hours and 46 minutes on the mobile internet every day
  • With nearly four hours daily, mobile internet is the primary way people interact with content.
  • At 3 hours and 13 minutes daily, TV remains relevant but is being outpaced by mobile consumption.
  • With 2 hours and 21 minutes daily, platforms like Instagram, TikTok, and X are where people spend much of their mobile time.
  • Digital press consumption (58 minutes daily) outpaces traditional print (42 minutes), signalling a continued decline in physical media.
  • Users spend 1 hour 25 minutes on music streaming, but gaming consoles only see 1 hour and 3 minutes, showing that on-the-go entertainment is preferred.
  • With podcasts at 52 minutes and radio at 51 minutes, audio content is still relevant but not as dominant as video and social media.

Southern Africa excels in mobile connectivity, boasting 183% connectivity, outpacing the rest of the world
  • Southern Africa is the global leader in mobile connectivity, with 183% mobile connections compared to its population, significantly ahead of all other regions.
  • The world’s most connected regions are outside North America and Western Europe, with Eastern Europe (144%), Eastern Asia (133%), and Southern Europe (131%) leading the charge after Southern Africa.
  • Africa is deeply divided in mobile adoption. While Southern Africa dominates, Eastern Africa (79%) and Middle Africa (66%) have a lower penetration.
  • Some regions have more mobile connections than people. The fact that multiple regions exceed 100% connectivity means that many individuals own multiple SIM cards, a trend driven by business needs, mobile money, and telecom competition.
  • Western Africa, at 85% connectivity, is doing better than Eastern Africa but still lags behind the global average, signaling potential for more growth in mobile adoption.

Only 2.2% of internet users worldwide do not own a smartphone device
  • Smartphones are nearly universal, with only 2.2% of internet users worldwide not owning one.
  • Laptop and desktop ownership (58.3%) lags behind smartphones, reinforcing the shift toward mobile-first usage for internet access.
  • Smart TVs (48.2%) are closing in on traditional computing devices, showing how entertainment consumption is increasingly digital and on-demand.
  • Wearables are rising, with smartwatches (25.8%) and smart wristbands (12.9%) becoming more mainstream, signalling a growing appetite for health and fitness tracking.
  • Gaming consoles (18.9%) and smart home devices (17.4%) have niched but steady adoption, appealing to entertainment and home automation enthusiasts.
  • Virtual Reality (VR) remains a specialty product, with just 4.7% ownership.
  • For businesses, the mobile-first reality is non-negotiable —any service, product, or content must prioritise accessibility via smartphones to reach the widest audience.

YouTube's revenue from adverts surged by more than 400% from 2017 to 2024.
- YouTube generated $7B in ad revenue in 2017, which jumped to $11B in 2018, an approximate 57% increase in just one year.
- By 2019, revenue reached $15B, reflecting steady growth as digital ad spending increased.
- Between 2020 and 2021, revenues leaped from $20B to $29B, marking a remarkable 45% year-over-year increase.
- Despite a plateau at $29B in 2022, revenue rebounded to $32B in 2023 and climbed to $36B by 2024.

LinkedIn's revenue surged from $2.3B to $16.4B in seven years, an almost sevenfold increase.
- LinkedIn's revenue doubled from $2.3 billion in 2017 to $5.3 billion in 2018, marking a powerful initial surge.
- By 2019, the revenue reached $6.8 billion, indicating a consistent and reliable growth pattern.
- Between 2020 and 2022, the revenue climbed from $8.1 billion to $13.6 billion, showcasing a period of rapid expansion.
- By 2024, revenue soared to $16.4 billion, nearly seven times the 2017 figure, reflecting a highly effective monetisation strategy.

In four years, Duolingo's daily active users nearly quadrupled, monthly active users doubled and paid subscribers increased tenfold.
- Monthly active users tripled: The user base grew from 38 million to 117 million, reflecting a significant expansion in overall reach.
- Daily engagement quadrupled, increasing from 8.5 million users to 40.5 million users, indicating a deeper and more consistent user engagement.
- Paid subscribers skyrocketed: A dramatic rise from 900,000 paid subscribers to 9.5 million paid subscribers highlights an exceptional monetisation success.
- The most pronounced growth occurred from Q1 2023 onward, emphasizing a period of rapid adoption and conversion.

POPULAR TOPICS
SIGN UP TO OUR NEWSLETTER
Get periodic updates about the African startup space, access to our reports, among others.
Subscribe Here
Subscription Form

A product of Techpoint Africa. All rights reserved