Total Inmate Population by Convicted and Awaiting Trial Persons as of march 2025

Key Takeaways

  • 66.6% of inmates (53,408) are awaiting trial, meaning 2 out of every 3 prisoners have not been convicted. This highlights major delays in the justice system, leading to prolonged detention without sentencing.
  • Male inmates dominate the prison population at 97.7%, with similar trends in both convicted (98.3%) and awaiting trial (97.4%) categories, highlighting a significant gender disparity in detention rates.
  • Only 33.4% of inmates (26,775) have been convicted, while the majority remain in legal limbo. This suggests that slow judicial processes are contributing to prison overcrowding and potential human rights concerns.
  • 75.4% of female inmates (1,399 out of 1,855) are awaiting trial, meaning only 1 in 4 female prisoners has been convicted

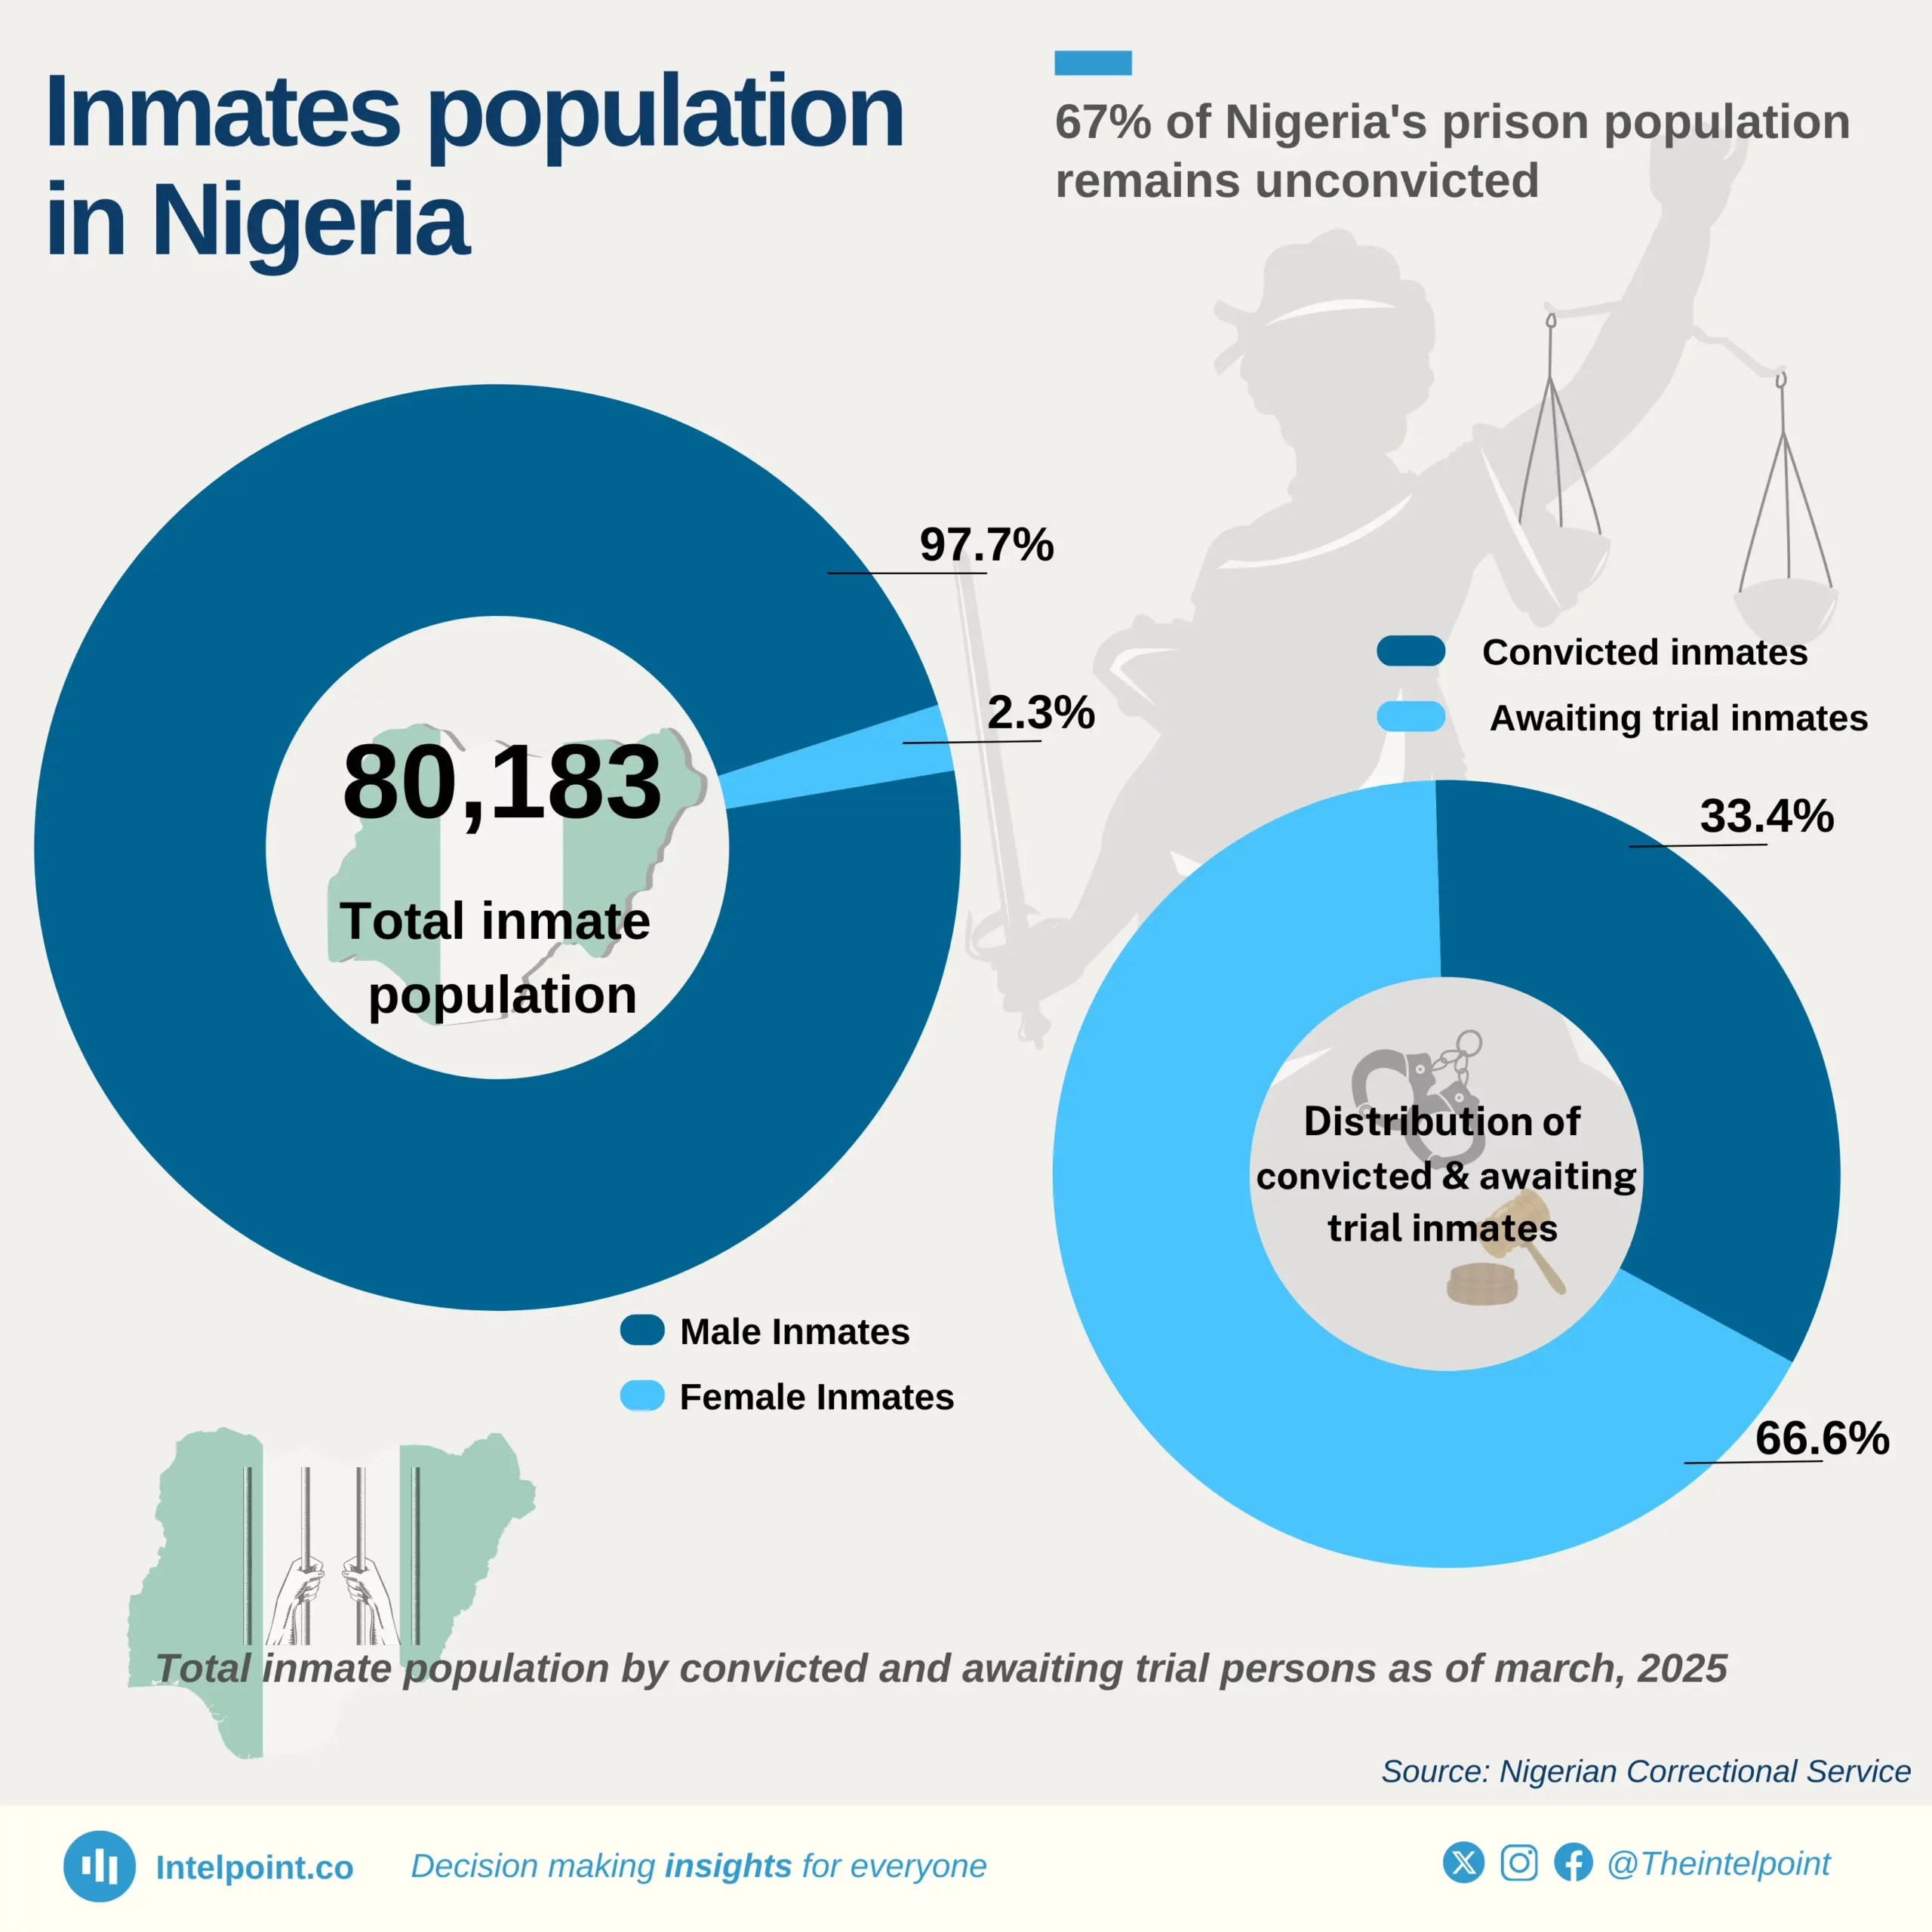
The Nigerian prison system presents a stark reality: for every convicted inmate, two remain in legal limbo, awaiting trial. This means that nearly 7 out of 10 prisoners have not been found guilty, yet they remain behind bars, some for years, awaiting justice. The overwhelming presence of male inmates (97.7%) suggests a significant gender skew in crime-related arrests and incarceration.

However, the true crisis lies in the conviction rate. With only 33% of inmates formally convicted, the system appears burdened with inefficiencies, raising concerns about delayed legal proceedings, prolonged detentions, and potential wrongful detention. Female inmates face an even harsher reality, with over three-quarters (75.4%) awaiting trial, reflecting a similar pattern of judicial sluggishness.

Source:

Nigerian correctional service

Period:

2025
HTML code to embed chart
Want a bespoke report?
Reach out
Tags
Related Insights

Road accidents in Nigeria (Q3 2020-Q3 2024)
  • Road accidents declined by 53% between Q3 2020 and Q3 2024.
  • Q4 2022 recorded the highest number of accidents, with 4,835 reported cases.
  • Q3 2024 had the lowest number, with just 1,945 accidents.
  • Speed violation remains the leading cause of road accidents in Nigeria.
  • Ogun, FCT, Kaduna, and Nasarawa consistently rank among the top four states with the highest accident occurrences.
  • Bayelsa, Borno, Imo, Rivers, and Akwa Ibom regularly report the lowest number of accidents each quarter.
  • Commercial vehicles are the most frequently involved vehicle category in accidents.
  • Cars account for the highest number of individual vehicle accidents.

Top 10 Nigerian states with the highest number of road accidents (Cumulative, Q3 2020-Q3 2024)
  • The Federal Capital territory (FCT) recorded the highest number of road accidents between Q3 2020 and Q3 2024, with a total of 8,133 accidents, accounting for 12.42% of total accidents.
  • FCT, Ogun, Nasarawa, and Kaduna consistently ranked among the top four states with the highest accident occurrences.
  • Bayelsa, Borno, Akwa Ibom, Rivers, and Imo were among the states with the lowest number of recorded accidents each quarter.

After its peak ($8.9b) in 2011, Nigeria's FDI declined almost every year to its lowest ($780m) in 2018, a 91% decline
  • FDI inflows peaked in 2011 at $8.91 billion, the highest in the 35-year period.
  • Between 2005 and 2012, Nigeria saw a sustained boom in FDI, with seven consecutive years above $4 billion.
  • In 2018, Nigeria recorded its lowest FDI inflow in decades at just $0.78 billion.
  • By 2024, FDI stood at $1.08 billion, down 88% from its 2011 peak, reflecting declining investor interest or changing investment climates.

The South West got ₦1 back for every ₦3.60 in VAT, while the North West received ₦2.60 for every ₦1 contributed
  • The South West generated ₦929.86B, over half of Nigeria’s total VAT, but received only ₦258.19B, amounting to ₦1 back for every ₦3.60 contributed.
  • The North West contributed just ₦68.05B but received ₦176.73B, meaning it got back ₦2.60 for every ₦1 generated.
  • The South South, the second-highest contributor at ₦364.99B, got back ₦171.18B, just ₦1 for every ₦2.13 generated.
  • The three southern zones together contributed ₦1.32 trillion in VAT, nearly 90% of the national total, but received less than half of it back.
  • Zones with the lowest generation (North East and South East) received 3 to 4 times their contributions.

Lagos generated ₦819.6 billion in VAT in Q1 2025, nearly triple Rivers and more than 10 times any other state
  • Lagos led the nation with ₦819.62B VAT, over 45% of the total generated by all 36 states combined.
  • Rivers followed distantly with ₦278.23B, around 34% of Lagos’s VAT haul.
  • Only five states (Lagos, Rivers, Oyo, Bayelsa, Kano) generated over ₦21B in Q1 2025.
  • 22 states generated below ₦10B, with 13 of them earning less than ₦6B in VAT.
  • Northern states like Katsina (₦5.96B), Yobe (₦5.81B), and Kebbi (₦5.13B) trail significantly in VAT contributions.
  • Abia, Cross River, Imo, and Taraba sit at the bottom, each with under ₦3B in VAT returns.

2025 sees unprecedented surge as 17,000 candidates score above 300 in JAMB; highest in 13 years
  • No candidate scored above 300 until 2015, with just 40 high scorers that year out of over 1.46 million candidates.
  • 2025 marked the highest ever with 17,025 candidates scoring above 300, nearly double the count in 2024 and more than triple 2023.
  • From 2022 to 2025, above-300 scorers consistently remained over 5,000 each year, showing a steady rise in top scores.
  • Despite the growth in numbers of JAMB candidates, high scorers still make up less than 1% annually.

POPULAR TOPICS
SIGN UP TO OUR NEWSLETTER
Get periodic updates about the African startup space, access to our reports, among others.
Subscribe Here
Subscription Form

A product of Techpoint Africa. All rights reserved