South Africa’s digital service imports still outweighed exports as of 2024, even after 300% growth since 2005

key takeaways:

  • South Africa’s digital service imports consistently overshadowed export earnings, despite exports growing by over 300% since 2005.
  • South Africa exported $76.418 billion in digital services between 2005 and 2024.
  • Imports during the same period reached $113.67 billion.
  • The result was a trade deficit of $37.252 billion in over 20 years.
  • Exports rose from just $1.71 billion in 2005 to $7.05 billion in 2024.

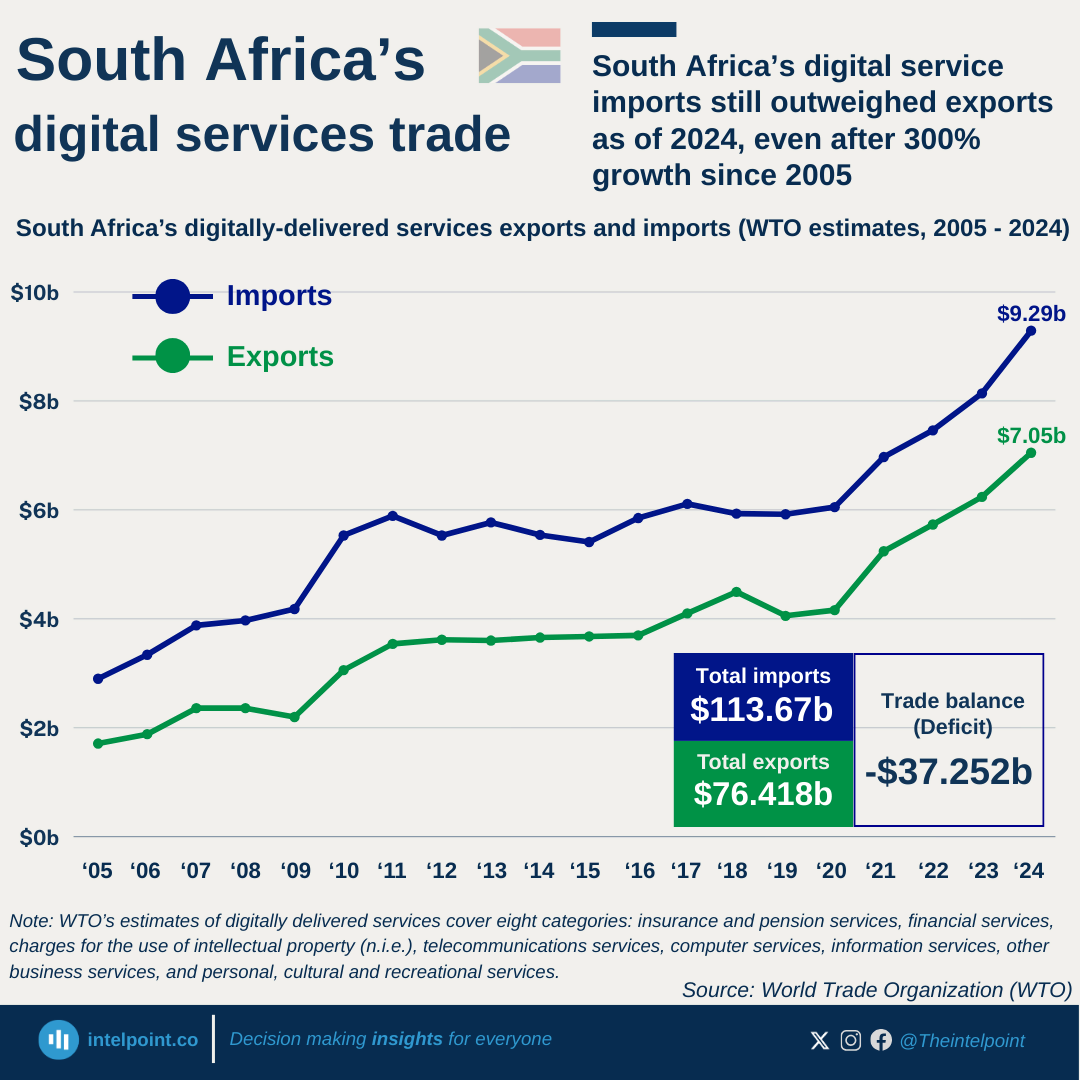
South Africa’s digital services trade between 2005 and 2024 reveals a consistent imbalance. Over this 20-year period, the country exported a total of $76.418 billion worth of digital services. However, imports were significantly higher, totaling $113.67 billion during the same time-frame. This gap created a trade deficit of $37.252 billion, highlighting the country’s dependence on foreign digital services.

In 2005, South Africa’s digital service exports were modest, at just $1.71 billion. By 2024, exports had grown substantially to $7.05 billion, reflecting a steady upward trajectory. Despite this growth, imports continued to outpace exports, limiting the benefits of export expansion.

On average, South Africa exported $3.8 billion annually in digital services across the two decades. By contrast, annual imports averaged around $5.68 billion, creating a persistent yearly gap. This imbalance points to structural challenges in the digital economy and service provision sector. The steady rise in exports shows that South Africa has developed competitive capabilities in certain digital niches. Yet the even faster growth in imports suggests strong domestic demand for foreign platforms and solutions. Encouraging investment in local platforms could reduce reliance on imports. At the same time, expanding export markets would help boost foreign exchange earnings.

Ultimately, South Africa’s digital services trade tells a story of growth overshadowed by imbalance.

Source:

World Trade Organization

Period:

2005-2024
HTML code to embed chart
Want a bespoke report?
Reach out
Tags
Related Insights

10 Nigerian states and the FCT cut their external debt by a combined $227.19 million in H1 2025
  • Ten states and the FCT collectively reduced their external debt by $227.19 million in H1 2025.
  • Lagos, Edo, and Rivers accounted for most of the reductions, making up more than three-quarters of the total.
  • Several smaller states also trimmed their balances, but by relatively modest amounts.
  • These reductions significantly offset the increases recorded by 26 other states, helping keep nationwide net external debt growth low.

Agricultural products led Kenya’s 2024 export economy, with coffee, tea, and spices generating $1.7 bn
  • Agriculture dominated Kenya’s exports, with coffee, tea, and spices alone contributing $1.7 billion, the largest single export category.
  • Mineral fuels were a surprisingly strong second, delivering $1.1 billion, and showing Kenya’s growing role in regional fuel distribution.
  • Horticultural exports (flowers, live plants, and trees) contributed $790 million, reinforcing Kenya’s global strength in floriculture.
  • All other export categories fall below $300 million individually, reflecting a long list of small but diverse export segments such as textiles, vegetables, and pharmaceuticals.

Mining led South Africa’s 2024 exports with 18.7%, as gems and precious metals generated over $20 bn
  • Gems and precious metals were the largest single export category, contributing $20.6 billion.
  • Ores and industrial minerals followed closely with $17.2 billion, showing the country’s reliance on mining.
  • Vehicles and machinery were significant non-mineral exports, with a combined $18.3 billion.
  • Agricultural and light industry products like fruits, nuts, and beverages contributed modestly, strengthening mining and manufacturing’s position as the core export drivers.

Cocoa accounted for 4.6% of Nigeria’s 2024 exports, making it the country’s second-largest export after oil
  • Mineral fuels (including crude oil) accounted for $49.3 billion, or 86.8% of total exports in 2024.
  • Non-oil exports remained marginal, with the second-largest item, cocoa, contributing only 4.6%.
  • Fertilisers, ores, slag, ash, and oilseeds collectively made up less than 5%, indicating limited diversification.
  • All other export categories each contributed 1% or less, underscoring Nigeria’s narrow export base.

26 Nigerian states added a combined $239m to their external debt in H1 2025
  • 26 states increased their external debt by a combined $239 million in H1 2025.
  • Imo, Oyo, Kaduna, Enugu, and Ogun recorded the biggest increases.
  • 11 states, including the FCT, reduced their debt through higher repayments.
  • Lagos, Edo, Rivers, and Bauchi accounted for most of the $227 million in reductions.
  • Total state external debt rose only slightly, from $4.8 billion to $4.812 billion.

Debt Management Office (DMO) Nigeria received a whopping 92.23% of the $15.5tn allocation for the Federal Ministry of Finance’s MDAs
  • The Debt Management Office (DMO) Nigeria took the lion’s share, with ₦14.3 trillion (92.23%) of the Ministry of Finance's total allocation.
  • The Nigerian Bulk Electricity Trading Plc. received ₦858.7 billion (5.53%), making it the second-highest allocation.
  • The Federal Ministry of Finance (Headquarters) got ₦289.4 billion (1.86%).
  • The Office of the Accountant General of the Federation was allocated ₦50.7 billion (0.33%).
  • The figures reveal how debt servicing priorities overshadow operational and policy-related financial allocations.

POPULAR TOPICS
SIGN UP TO OUR NEWSLETTER
Get periodic updates about the African startup space, access to our reports, among others.
Subscribe Here
Subscription Form

A product of Techpoint Africa. All rights reserved