South Africa electricity distribution (TWh), 2015-2024

Key Takeaways

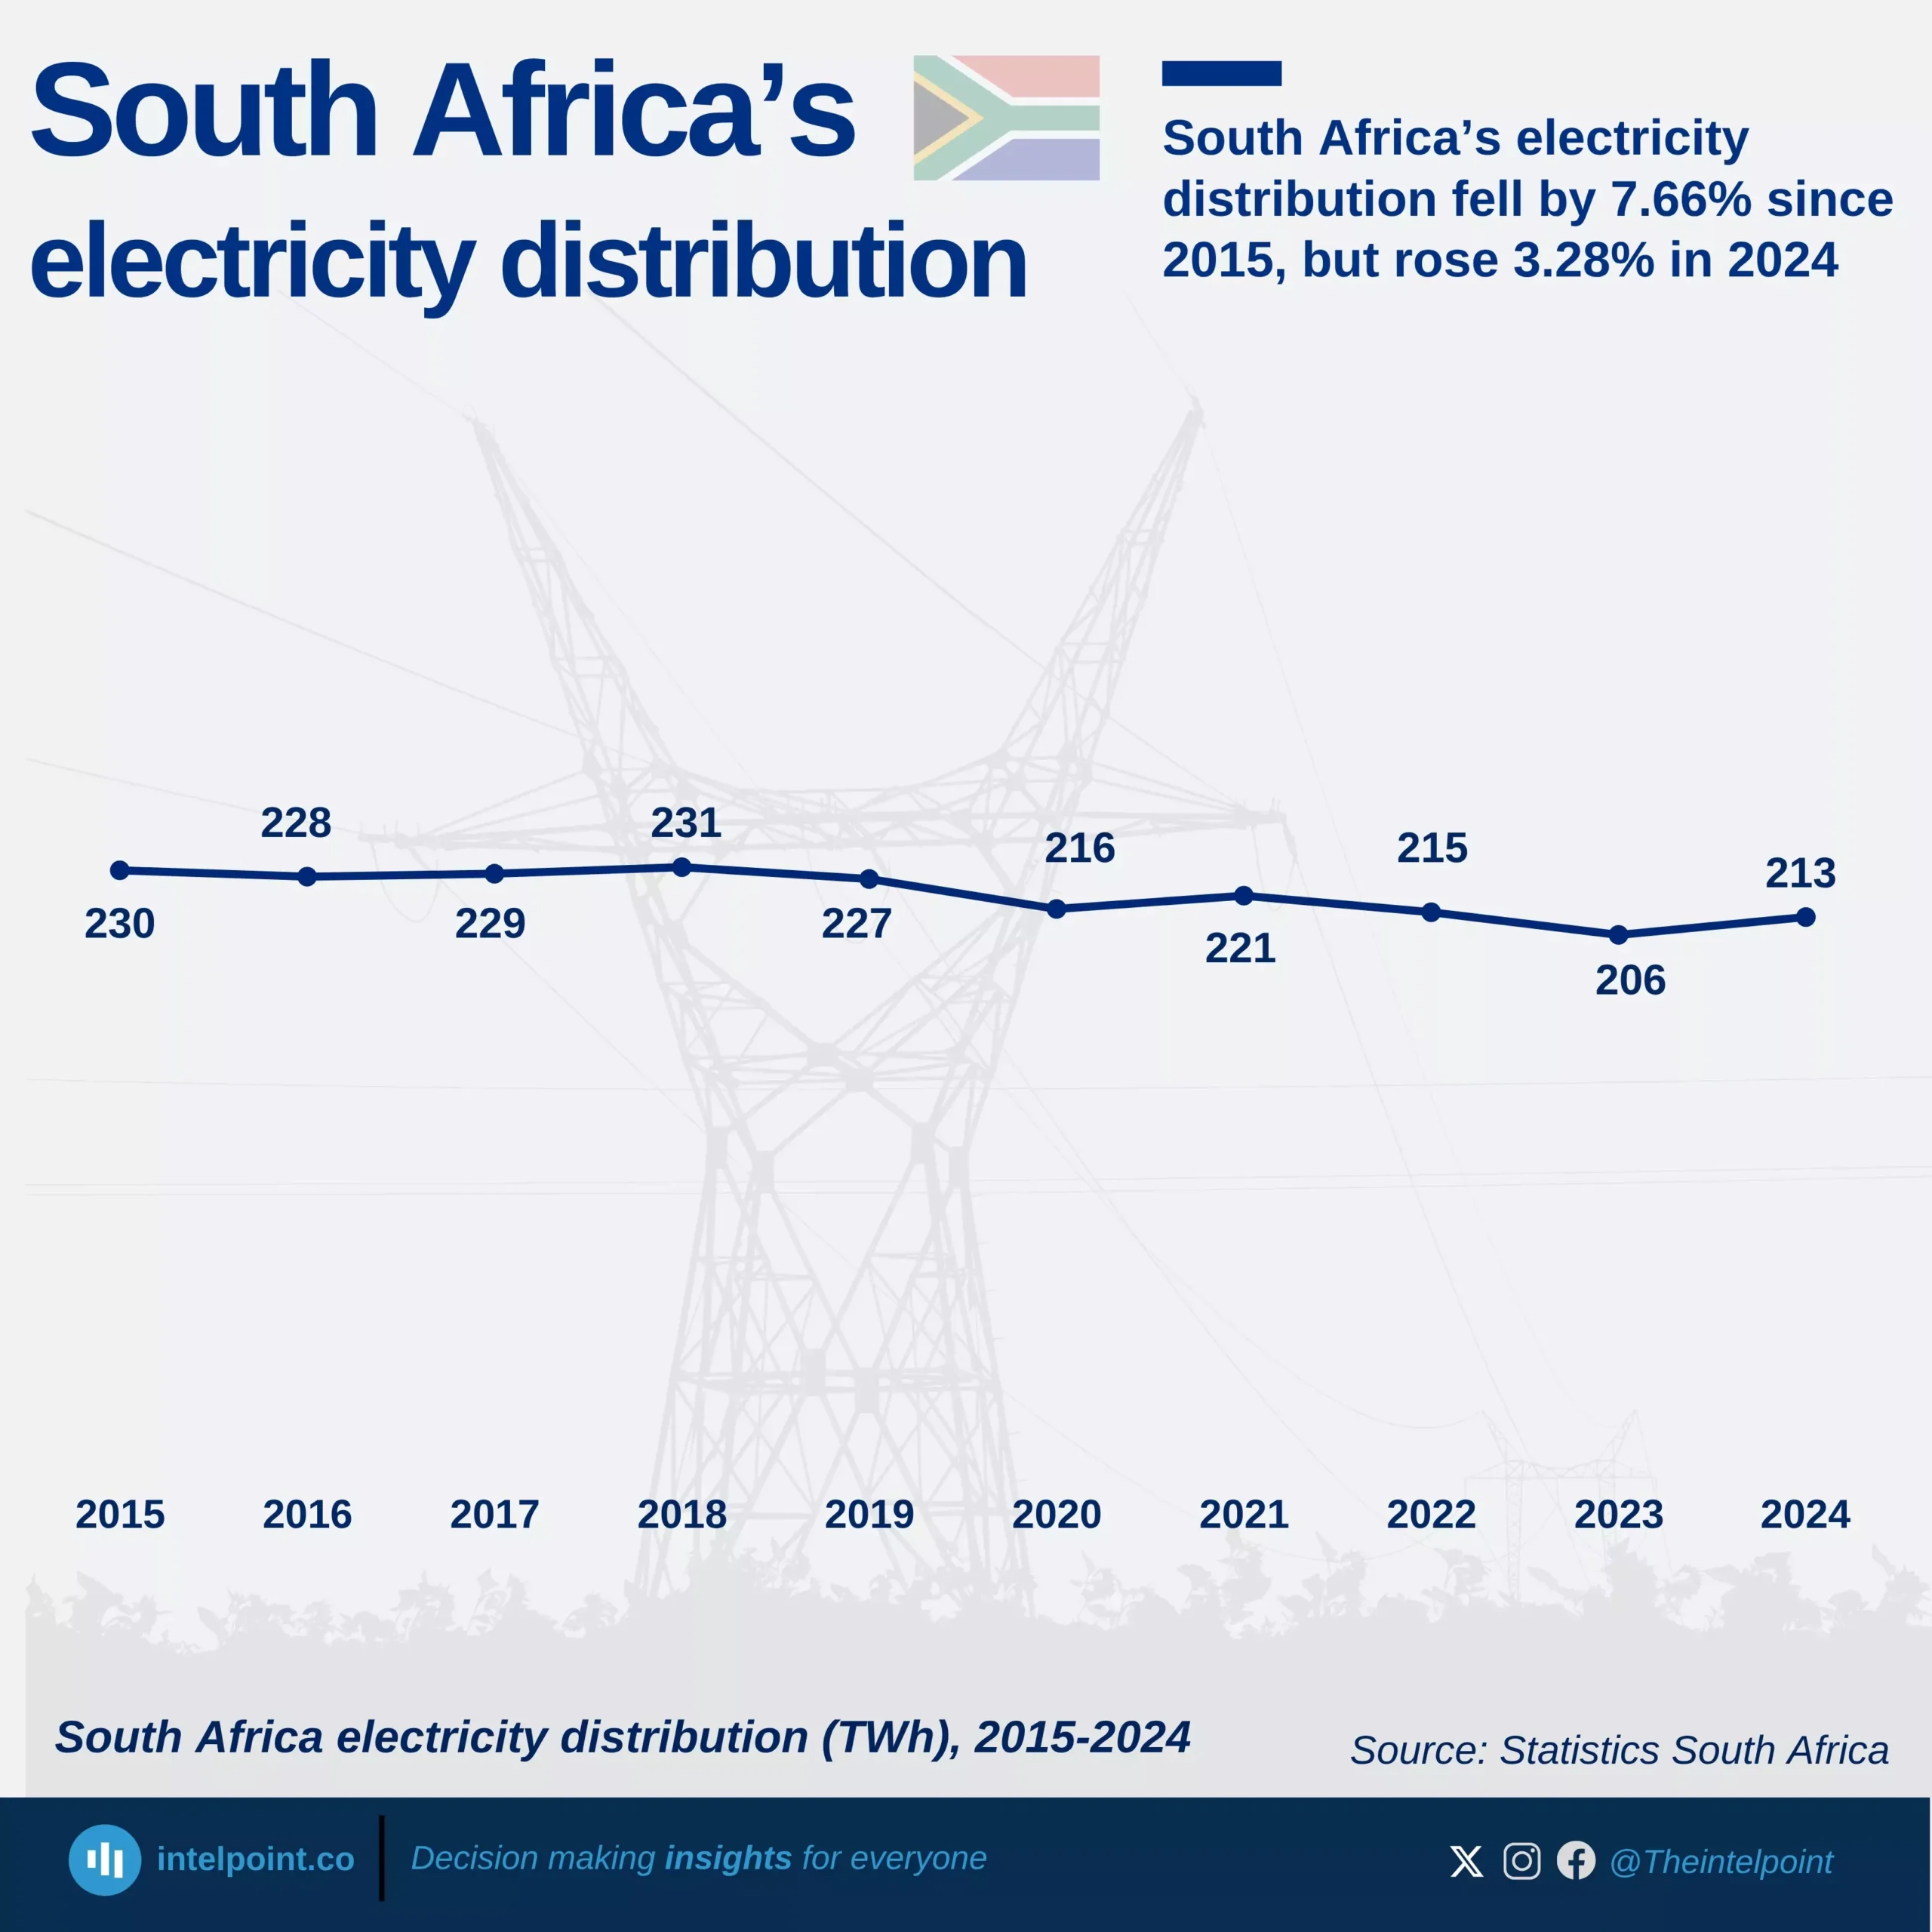
  • Electricity distribution in South Africa reached its peak in 2018, a record high of 231 TWh.

  • The lowest electricity distribution was recorded in 2023, dropping to 206 TWh.

  • Load shedding has become a persistent challenge, with 2023 experiencing the highest number of load shedding days — 332 days in total.

  • Eskom accounts for about 80% of electricity distributed in South Africa.

South Africa has faced growing challenges with its electricity distribution and overall energy performance, largely due to issues facing Eskom, the country’s dominant electricity distributor. Rotational load shedding—a measure introduced in response to strained generation capacity, aging infrastructure, and years of deferred maintenance—has become a defining feature of the energy landscape.

From 2015 to 2019, electricity distribution remained relatively stable, fluctuating between 227 and 231 TWh. However, in 2020, amid the disruptions of the COVID-19 pandemic, distribution declined by 4.85%, signalling a notable downturn. Since then, Eskom has struggled to regain its footing, with electricity distribution falling to just 206 TWh in 2023, the lowest level recorded in nearly a decade.

Source:

Statistics South Africa

Period:

2015-2024
HTML code to embed chart
Want a bespoke report?
Reach out
Tags
Related Insights

Eskom electricity tariff—categories and rates (2023/24, c/kWh)
  • Landlight tariffs (20A and 60A), offered primarily in rural areas, are Eskom’s highest tariff rates and are exclusive to direct (non-local authority) customers.
  • The Homelight 20A Block 1 tariff, which applies to consumption between 0–350 kWh, is the lowest among Eskom’s tariffs.
  • Landlight tariffs carry higher rates because they exclude other fixed charges such as: Ancillary service charge (c/kWh), Network demand charge (c/kWh), Network capacity charge (R/POD/day), and Service charge (R/POD/day). This structure makes Landlight more suitable for rural or low-income areas, where simplifying cost recovery is necessary.
  • Eskom classifies its tariffs into the following categories:
    • Residential Tariffs (for household electricity supply): Homelight 20A, Homelight 60A, Homepower, and Homeflex
    • Urban Tariffs (for large industrial and commercial users): Megaflex, Miniflex, Nightsave Urban (Large and Small), Business Rate, Public Lighting, Transflex (rail), and Gen-Wheeling/Offset tariffs
    • Rural Tariffs (for agricultural, business, and residential customers in rural areas): Ruraflex, Nightsave Rural, Landrate, and Landlight
    • Municipal Tariffs (for municipalities purchasing in bulk and for municipal services like water pumps or offices): Municrate, Municflex, and Public Lighting.
  • Customers with rooftop solar PV systems are required to be on the Homeflex tariff plan, which is based on Time-of-Use (ToU) pricing.
  • Several Eskom tariffs are Time-of-Use-based, where charges vary depending on peak, standard, and off-peak periods. These include: Nightsave Urban Large, Nightsave Urban Small, Megaflex, Miniflex, Homeflex, Nightsave Rural, Ruraflex, and Ruraflex Gen

Eskom’s average electricity tariff in cents per kilowatt hour (c/kWh), 2013/14—2023/24
  • Eskom’s average electricity tariff increased by approximately 162% between 2013/14 and 2023/24.
  • Tariffs are categorized into two groups based on distribution: Local Authority Tariffs and Non-Local Authority Tariffs.
  • Landlight Tariff (Non-Local Authority category) is the highest rate and in 2023/24 it stood at 608.61 c/kWh.
  • Homelight 20A (Block 1) is the lowest tariff also in the non-local authority category, at 168.78 c/kWh in 2023/24.
  • Eskom applies Time-of-Use (ToU) pricing, where tariffs vary by Time of day (peak, standard, off-peak periods) and Demand season (high-demand season: June to August and Low-demand season: September to May)


Nigeria has achieved a metering rate of 47%, with Ikeja DisCo leading the way at an impressive 78% progress
  • Ikeja DisCo leads with a 78.45% metering rate, having metered over 1.03 million customers.
  • Abuja DisCo follows closely with a 71.60% metering rate and over 924,000 metered customers.
  • Ibadan has the highest number of registered customers, but only a 44.23% metering rate.
  • Kaduna and Kano have alarmingly low metering rates of 24.92% and 24.77%, respectively.
  • Yola DisCo has the lowest metering rate at just 14.45% of its 824,700 customers.
  • Eko DisCo has a relatively high metering rate of 63.92% despite having fewer registered customers.
  • Only 4 out of 13 DisCos have metered at least half of their customer base as of March 2025.

While Kano soared with 331% growth in Q1 2025, Ibadan's deployments hit 42,685, marking a superior numerical increase of 5,596
  • Kano DisCo recorded the highest increase in metered customers with a 330.75% rise in just one quarter.
  • Aba DisCo more than doubled its metered customers, increasing by 116.87%.
  • Ikeja DisCo, despite being a top performer overall, saw a 23.62% drop in meter installations.
  • Enugu and Eko also recorded declines in quarterly deployments by 12.31% and 4.02% respectively.
  • Ibadan DisCo deployed the highest number of meters in Q1 2025 but grew at a moderate rate of 15.09%.
  • Yola DisCo experienced the steepest decline in the country, dropping by 56.70% in metered customers.

Cape Verde has the highest electricity fluctuations, averaging 6056.4 kWh
  • The Gambia, Guinea-Bissau, Niger, Sierra Leone, and Guinea had the most stable electricity supply from 2000 to 2021.
  • Cape Verde experienced the highest electricity fluctuations, with values ranging from 2981.5 kWh/person to 7692.9 kWh/person.
  • Nigeria, Ghana, Benin, Mali, and Cape Verde had the most unstable electricity supply, with significant year-to-year variations.
  • Nigeria’s electricity supply averaged 2161.7 kWh/person but remained highly inconsistent, fluctuating between 1250.4 and 2707.9 kWh/person.
  • Mali had the lowest electricity availability among unstable nations, averaging 757.4 kWh/person, with a drop as low as 350.7 kWh/person.
  • Countries with stable electricity had lower fluctuations, with The Gambia leading at 957.8 kWh/person and Guinea reaching 1110.8 kWh/person.

Nigeria's national grid has collapsed 12 times in 2024
Nigeria's national grid has experienced 12 collapses so far in 2024, a troubling trend that reveals the fragility of the country's energy infrastructure. The timeline highlights intervals ranging from as short as one day to as long as 82 days between incidents. Notably, two consecutive collapses occurred on October 14 and October 15, while a total of 9 collapses occurred in the second half of the year. Yesterday's collapse came 35 days after November 7, when the grid went down for the 11th time.

POPULAR TOPICS
SIGN UP TO OUR NEWSLETTER
Get periodic updates about the African startup space, access to our reports, among others.
Subscribe Here
Subscription Form

A product of Techpoint Africa. All rights reserved