Over the last twenty years, the ratio of tax to GDP in South Africa has varied, reaching a high of 24.9%—a 19% increase since 2004/05

Key takeaways:

  • The tax-to-GDP ratio reached its peak in 2022/23 at 24.9%, signifying enhanced efficiency in tax collection.
  • Throughout the past two decades, the percentage of tax revenue relative to GDP has exhibited significant stability.
  • The tax revenue as a proportion of GDP has fluctuated between 21% and 25% over the last twenty years.
  • Notable declines occurred during global economic downturns, such as the financial crisis of 2008-2009 and the COVID-19 pandemic.
  • The recent years (2021-2024) reflect a robust recovery, with tax revenue percentages approaching peak levels.

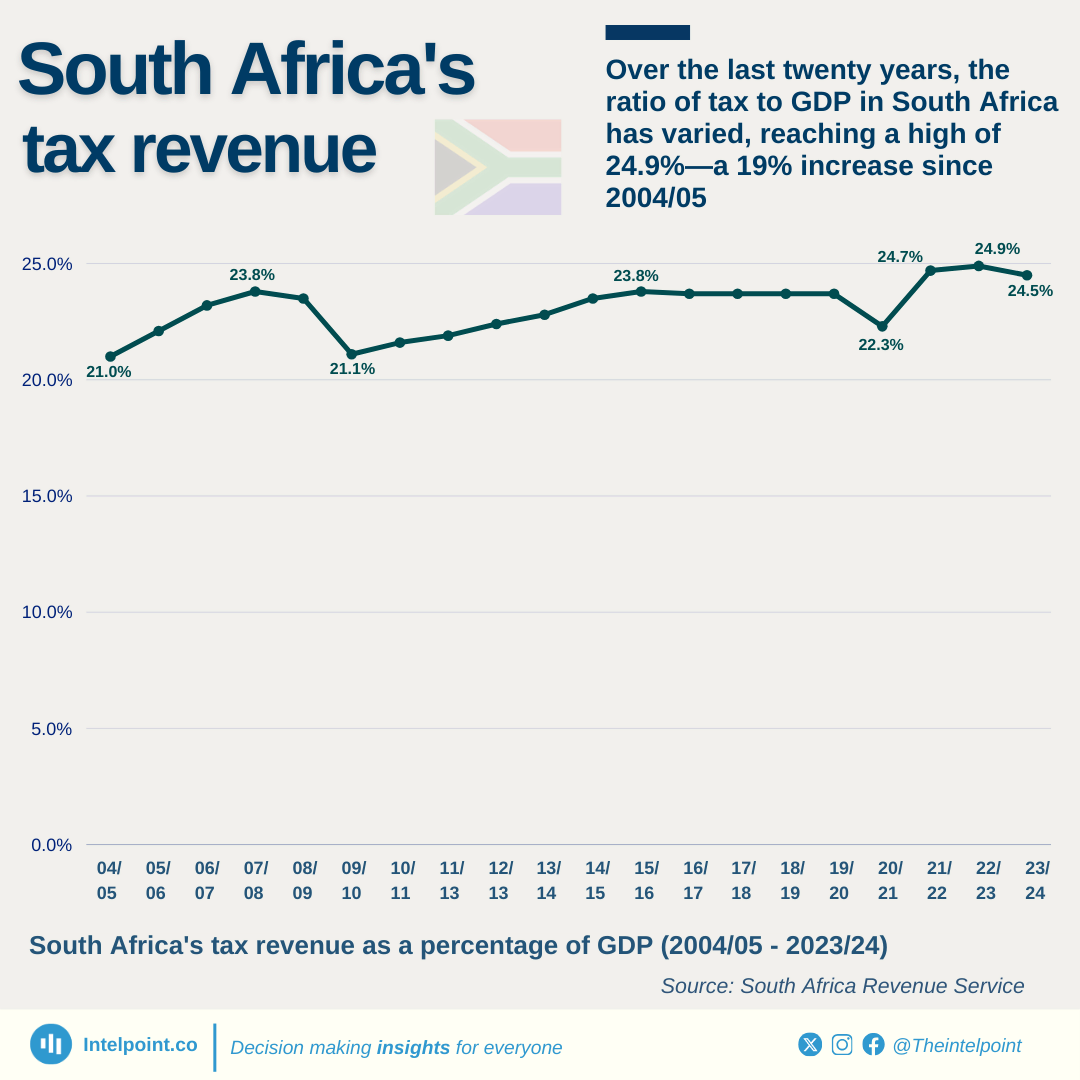
In the last twenty years, South Africa has experienced a gradual increase in tax revenue as a share of its Gross Domestic Product (GDP). During this timeframe, tax revenue rose steadily from 21% in 2004/05 to a robust 23.8% by 2007/08. However, the global financial crisis caused a sharp decline, leading to a drop to 21.1% in 2009/10.

From 2010 to 2020, tax revenue consistently remained in the range of 22-24% of the GDP, showcasing the country's remarkable capacity to sustain fiscal momentum amid economic uncertainties. The timeframe from 2016/17 to 2019/20 was particularly stable, with tax revenue consistently recorded at 23.7%.

The COVID-19 pandemic presented another obstacle, temporarily reducing tax revenue to 22.3% in 2020/21. However, South Africa's economy rebounded quickly. By 2021/22, tax revenue not only recovered but also increased to 24.7%, peaking at 24.9% in 2022/23.

The most recent figure of 24.5% for 2023/24 indicates continued strong performance, demonstrating the country’s capacity to adapt, efficiently collect revenue, and uphold fiscal stability despite global economic challenges.

Source:

South Africa Revenue Service

Period:

2004/05 - 2023/24
HTML code to embed chart
Want a bespoke report?
Reach out
Tags
Related Insights

Finance & Insurance now makes up 30% of Nigeria’s domestic company income tax, up from 12% in 2022
  • Company income tax collections rose from ₦1.7tn in 2022 to ₦5.0tn in 2025.
  • Finance & Insurance more than doubled its share, from 12.4% to 30.0%.
  • Finance became the largest single sector in the tax mix by 2025.
  • Manufacturing remained important, but its share fell from 27.9% to 17.7%.
  • ICT saw one of the sharpest declines, from 21.6% to 6.5%.
  • Mining & quarrying gained weight, rising from 8.4% to 14.5%.
  • Wholesale & retail also increased, from 3.6% to 7.0%.
  • The tax base became less evenly distributed across sectors.

Nigeria's VAT collections have more than tripled in three years
  • Nigeria’s total VAT rose from ₦2.5tn in 2022 to ₦8.6tn in 2025.
  • VAT collections more than tripled in four years.
  • Local VAT remained the largest source of VAT throughout the period.
  • Local VAT increased from ₦1.5tn to ₦4.5tn.
  • Local VAT averaged 54.4% of total VAT between 2022 and 2025.
  • Import VAT also grew strongly, from ₦521.5bn to ₦2.0tn.
  • Other payment channels rose from ₦510.8bn to ₦2.1tn.
  • VAT growth is increasingly being driven by non-import activity.

Local companies have consistently contributed most of Nigeria’s Company Income Tax payments since 2016
  • Local companies dominated CIT contributions in most years, accounting for over 50% of payments in 9 of 11 periods between 2015 and 2025 (Q1–Q3).
  • Foreign companies briefly closed the gap in 2023, contributing 49%, the closest they have come to matching local firms.
  • Local companies recorded their strongest share in 2021 at 65%, marking the widest gap between local and foreign contributors.
  • “Other payments” peaked during the pandemic, rising to 17% in 2020 before dropping to 0% from 2022 onward.

Local companies have consistently contributed most of Nigeria’s Company Income Tax payments since 2016
  • Local companies dominated CIT contributions in most years, accounting for over 50% of payments in 9 of 11 periods between 2015 and 2025 (Q1–Q3).
  • Foreign companies briefly closed the gap in 2023, contributing 49%, the closest they have come to matching local firms.p
  • Local companies recorded their strongest share in 2021 at 65%, marking the widest gap between local and foreign contributors.
  • “Other payments” peaked during the pandemic, rising to 17% in 2020 before dropping to 0% from 2022 onward.

97% of businesses in Kogi are aware of Nigeria's 2025 tax reform, while 99% in Abia are not
  • Kogi entrepreneurs have the highest tax policy awareness in Nigeria (96.8%) in 2025.
  • Abia has the lowest awareness nationwide at just 1.4%.
  • Fewer than one-third of Nigerian states have awareness levels above 60%.
  • Major economic hubs like Lagos and Rivers have awareness below 50%.
  • Northern states dominate the top awareness rankings more than southern states.
  • Several states cluster around the 40–50% range, indicating partial reach.
  • States with low awareness risk lower compliance and higher friction during enforcement.
  • The gap between the highest and lowest states exceeds 95 percentage points, showing extreme disparity.

Nigeria's non-oil tax revenue solidified its dominance over oil in FIRS collections, reaching a record of ₦15.9t in 2024, more than 2.7x the ₦5.8t from oil
  • FIRS recorded ₦15.9 trillion of non-oil tax, almost three times the ₦5.8 trillion recorded for oil tax.
  • Non-oil tax revenue made up 73.3% of the total revenue collected in 2023.
  • From 2012 down to 2024, non-oil tax revenue surpassed oil tax revenue most of the time.
  • Oil taxes are petroleum profit tax and company income (oil & gas) tax while non-profit tax includes company income (non-oil) tax, gas tax, capital gains, stamp duty, NCS import VAT, and non-import VAT.

POPULAR TOPICS
SIGN UP TO OUR NEWSLETTER
Get periodic updates about the African startup space, access to our reports, among others.
Subscribe Here
Subscription Form

A product of Techpoint Africa. All rights reserved