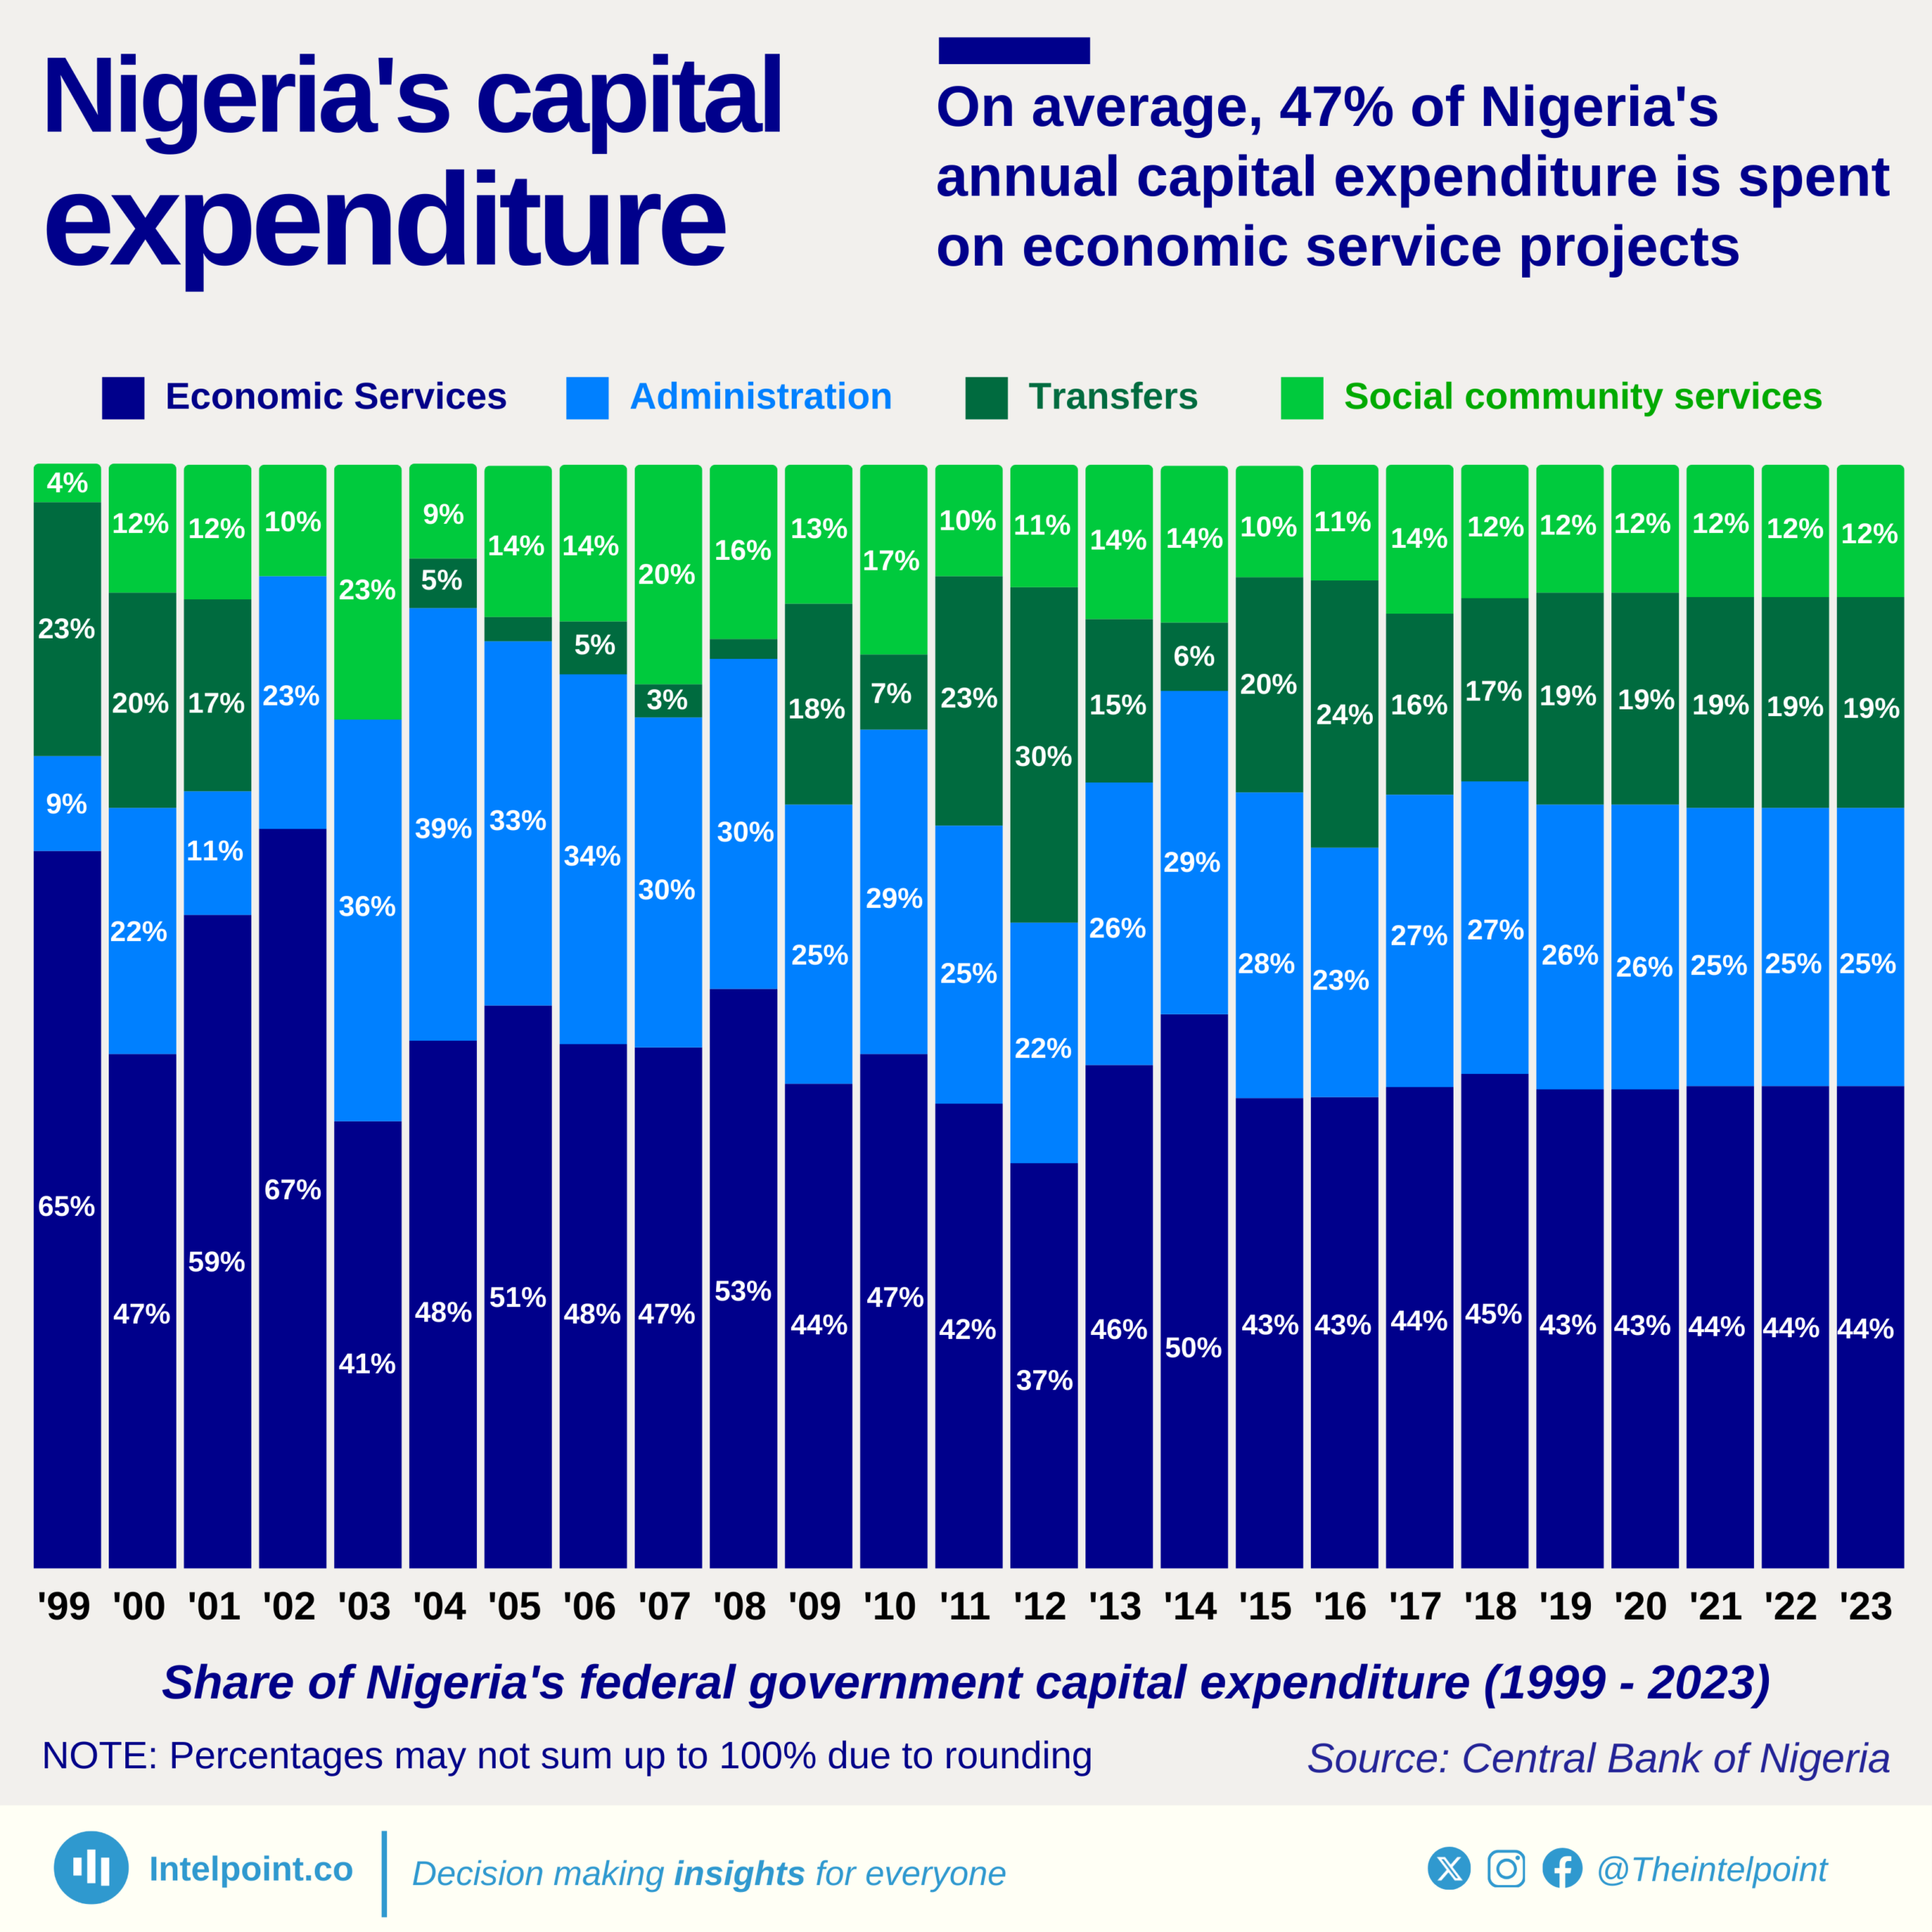
On average, 47% of Nigeria's annual capital expenditure is spent on economic service projects

Key takeaways:

  • Economic services still receive the largest share of capital expenditure (47% on average), which has declined over time, raising concerns about long-term infrastructure development.
  • Spending on administration has risen, now accounting for a quarter of total capital expenditure (25%), highlighting a stronger focus on governance and institutional processes.
  • Social community services (such as education and healthcare) have seen growth in allocation, reaching around 12-19% in recent years, signalling a shift toward social development.
  • Transfers, which are funds allocated to specific entities or programmes, have fluctuated but occasionally spiked.

Capital expenditure is the backbone of a nation’s long-term development, shaping infrastructure, economic growth, and social well-being. In Nigeria, nearly half (47%) of federal capital expenditure is allocated to economic services, reinforcing the government's focus on transportation, agriculture, and power. However, the distribution of funds has shifted significantly over the years, revealing intriguing patterns in national priorities.
A closer look at the data from 1999 to 2023 shows a gradual decline in capital spending on economic services, even though they remain the largest category. While economic services accounted for over 65% in 1999, this share has decreased to around 44% in recent years. Meanwhile, administration spending has increased, suggesting a growing focus on governance, bureaucracy, and institutional frameworks.
Source:

Central Bank of Nigeria (CBN)

Period:

1999 - 2023
HTML code to embed chart
Want a bespoke report?
Reach out
Tags
Related Insights

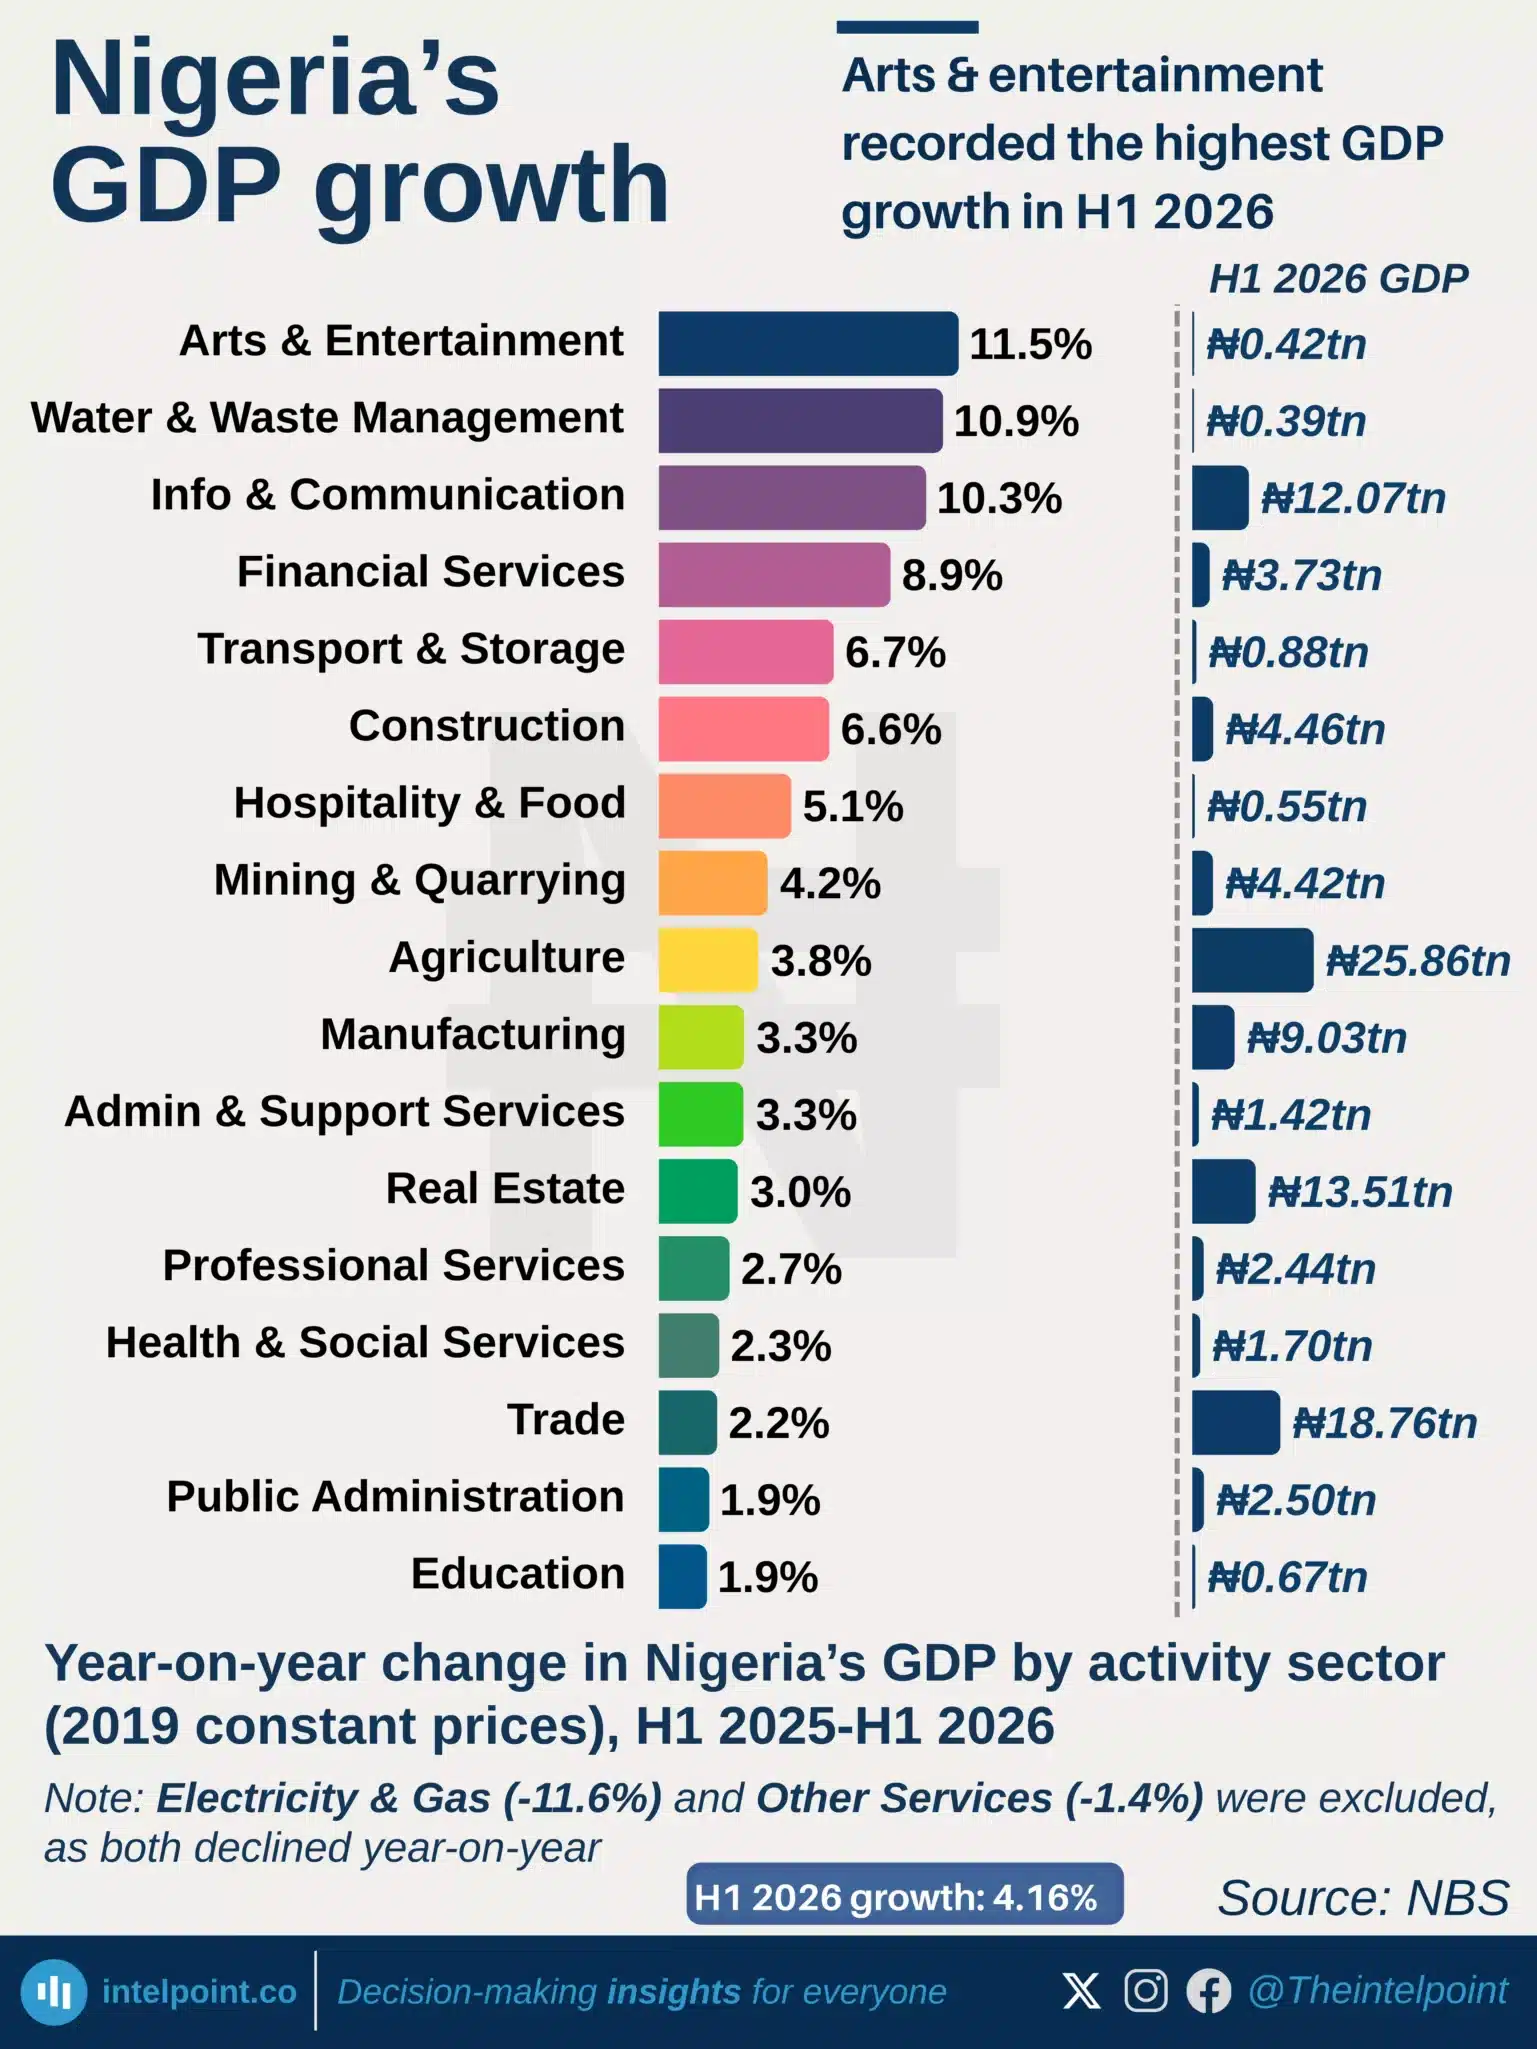
Arts & entertainment recorded the highest GDP growth in H1 2026
  • Nigeria’s economy grew 4.16% in H1 2026, but growth was uneven across sectors.
  • Arts and entertainment grew fastest at 11.5%, followed by water and waste management (10.9%) and information and communication (10.3%).
  • Agriculture, which accounts for about a quarter of GDP, grew 3.8%, below the headline rate.
  • Trade and real estate also lagged, growing 2.2% and 3.0%, respectively.
  • Electricity and gas was the biggest drag, contracting 11.6%, while Other Services fell 1.4%.

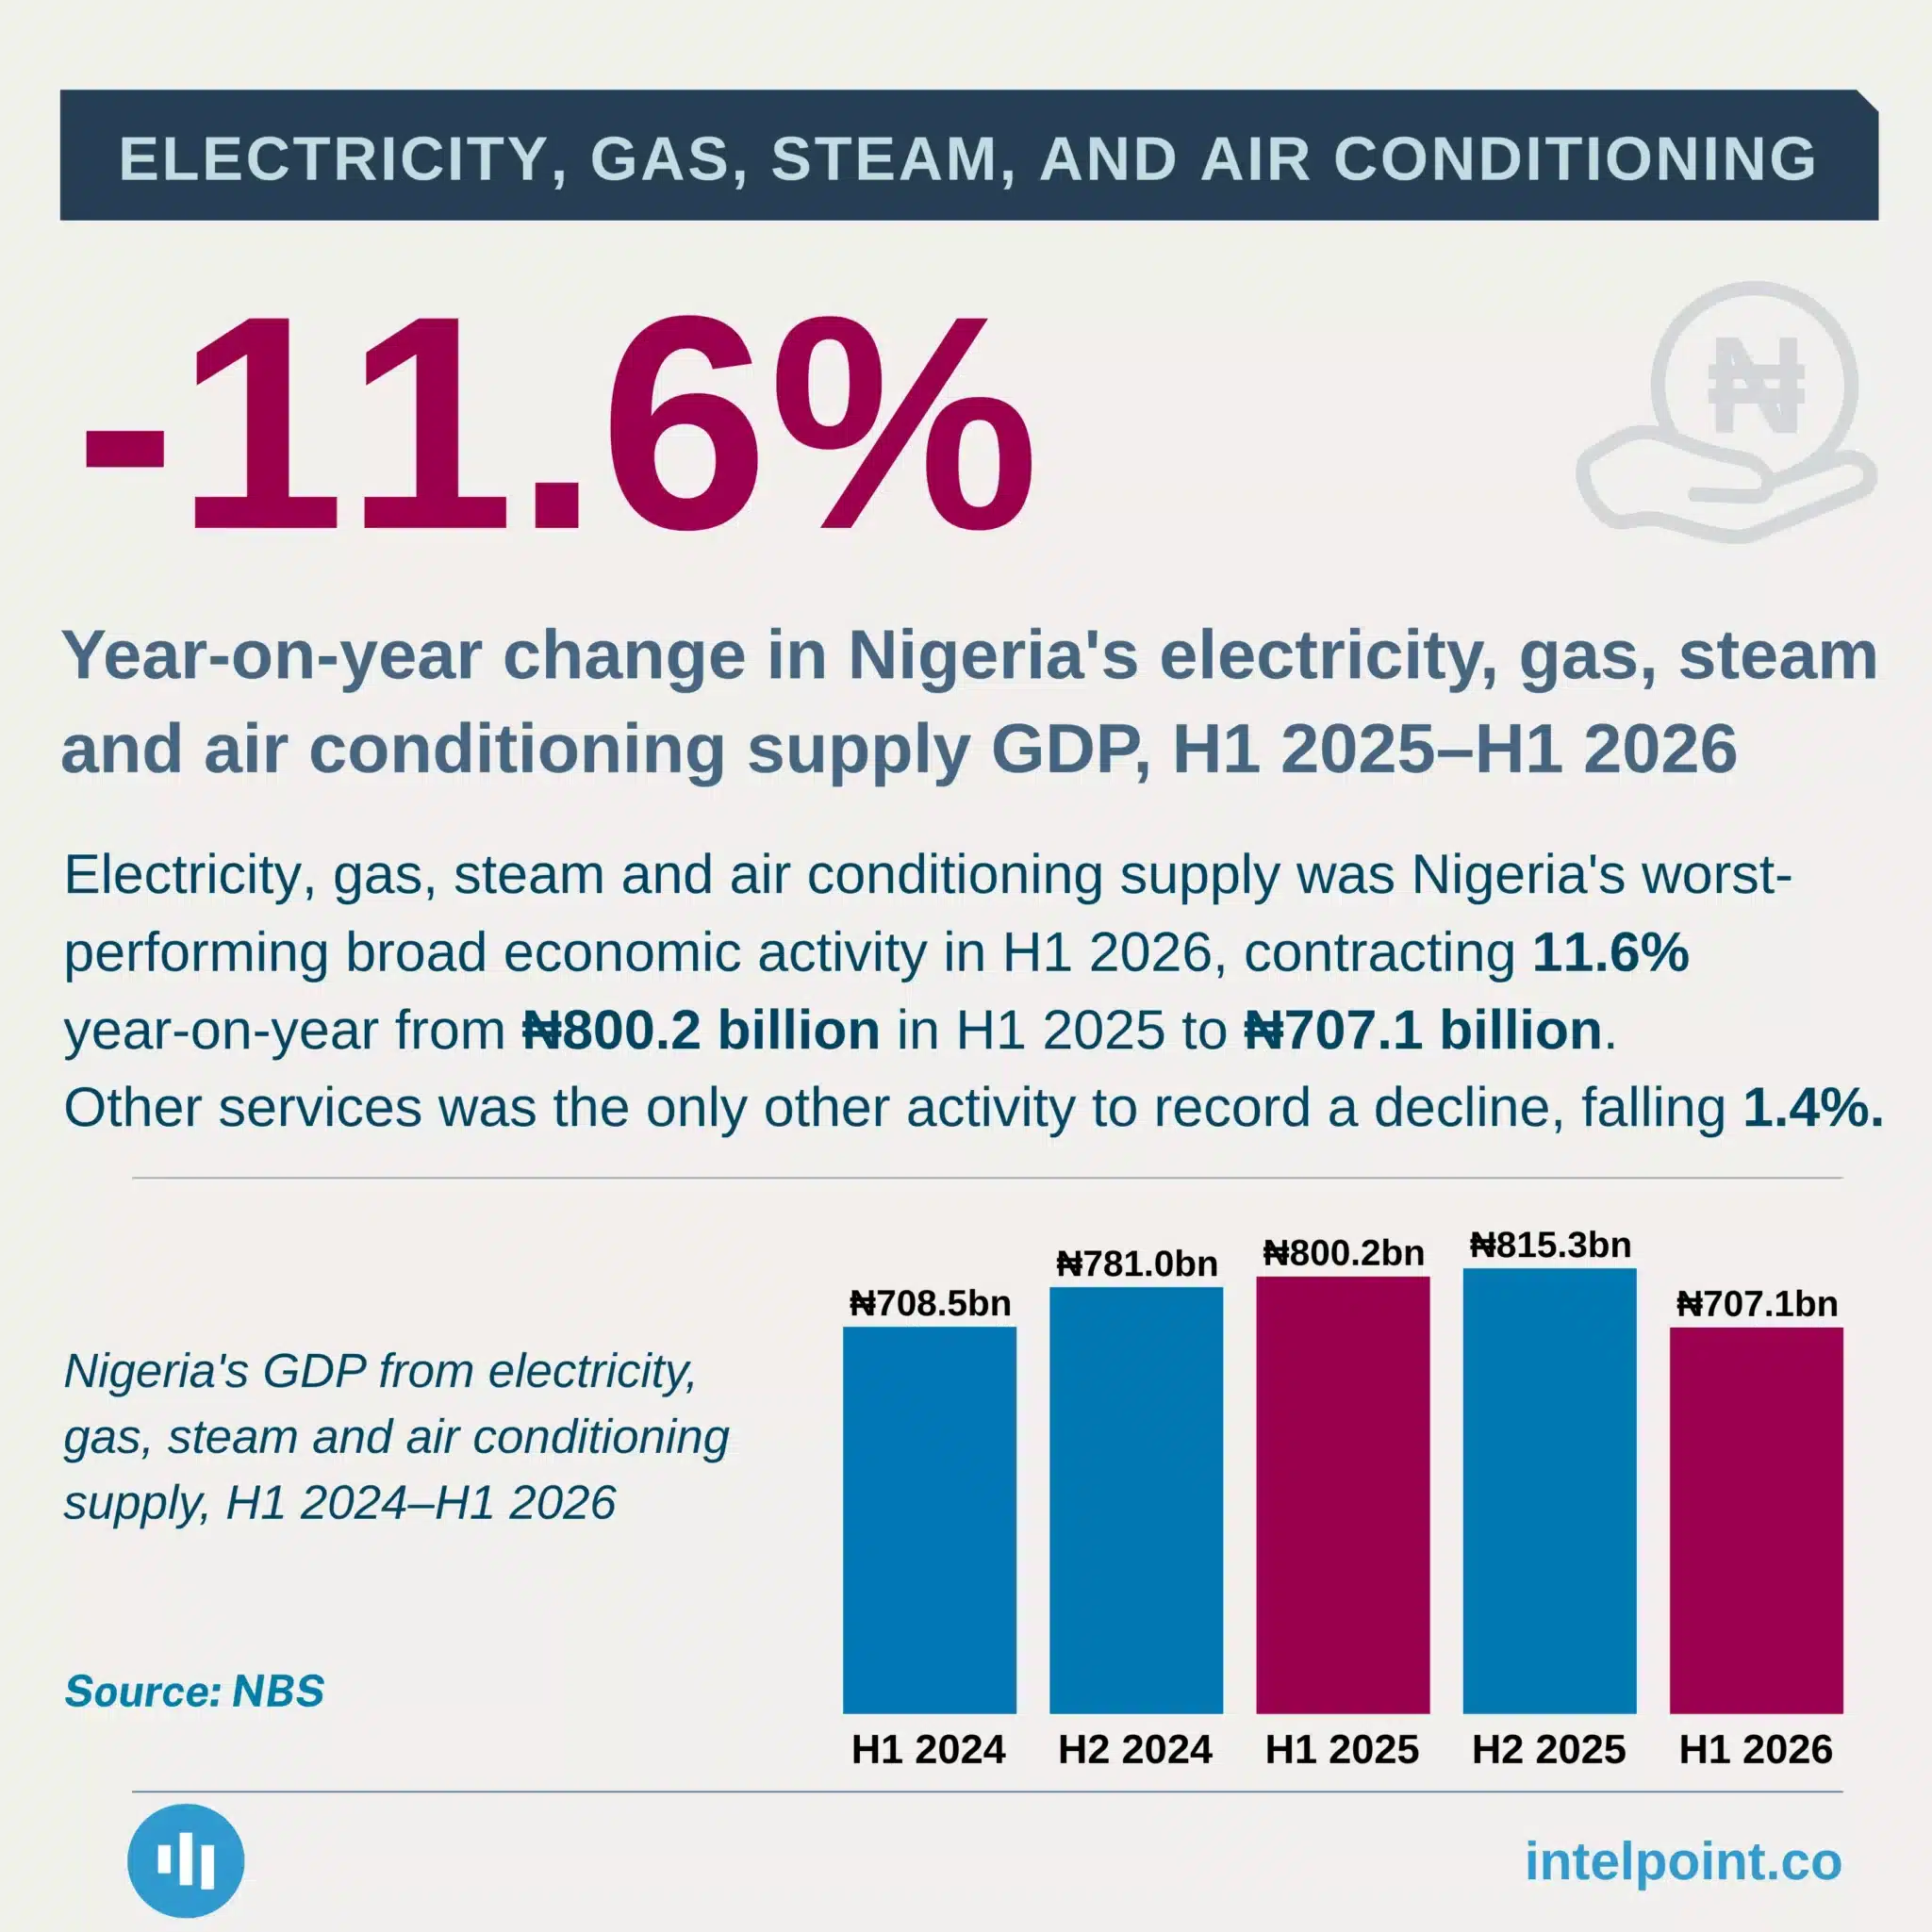
Year-on-year change in Nigeria's electricity, gas, steam and air conditioning supply GDP
  • Electricity, gas and related supply was Nigeria’s worst-performing broad economic activity in H1 2026.
  • Sector GDP fell 11.6% year-on-year, from ₦800.2bn to ₦707.1bn.
  • Output fell below H1 2024 levels, when the sector recorded ₦708.5bn.
  • Only one other broad activity contracted: Other Services, which fell 1.4%.
  • The sector contributed just 0.7% of Nigeria’s real GDP on average over the period shown.

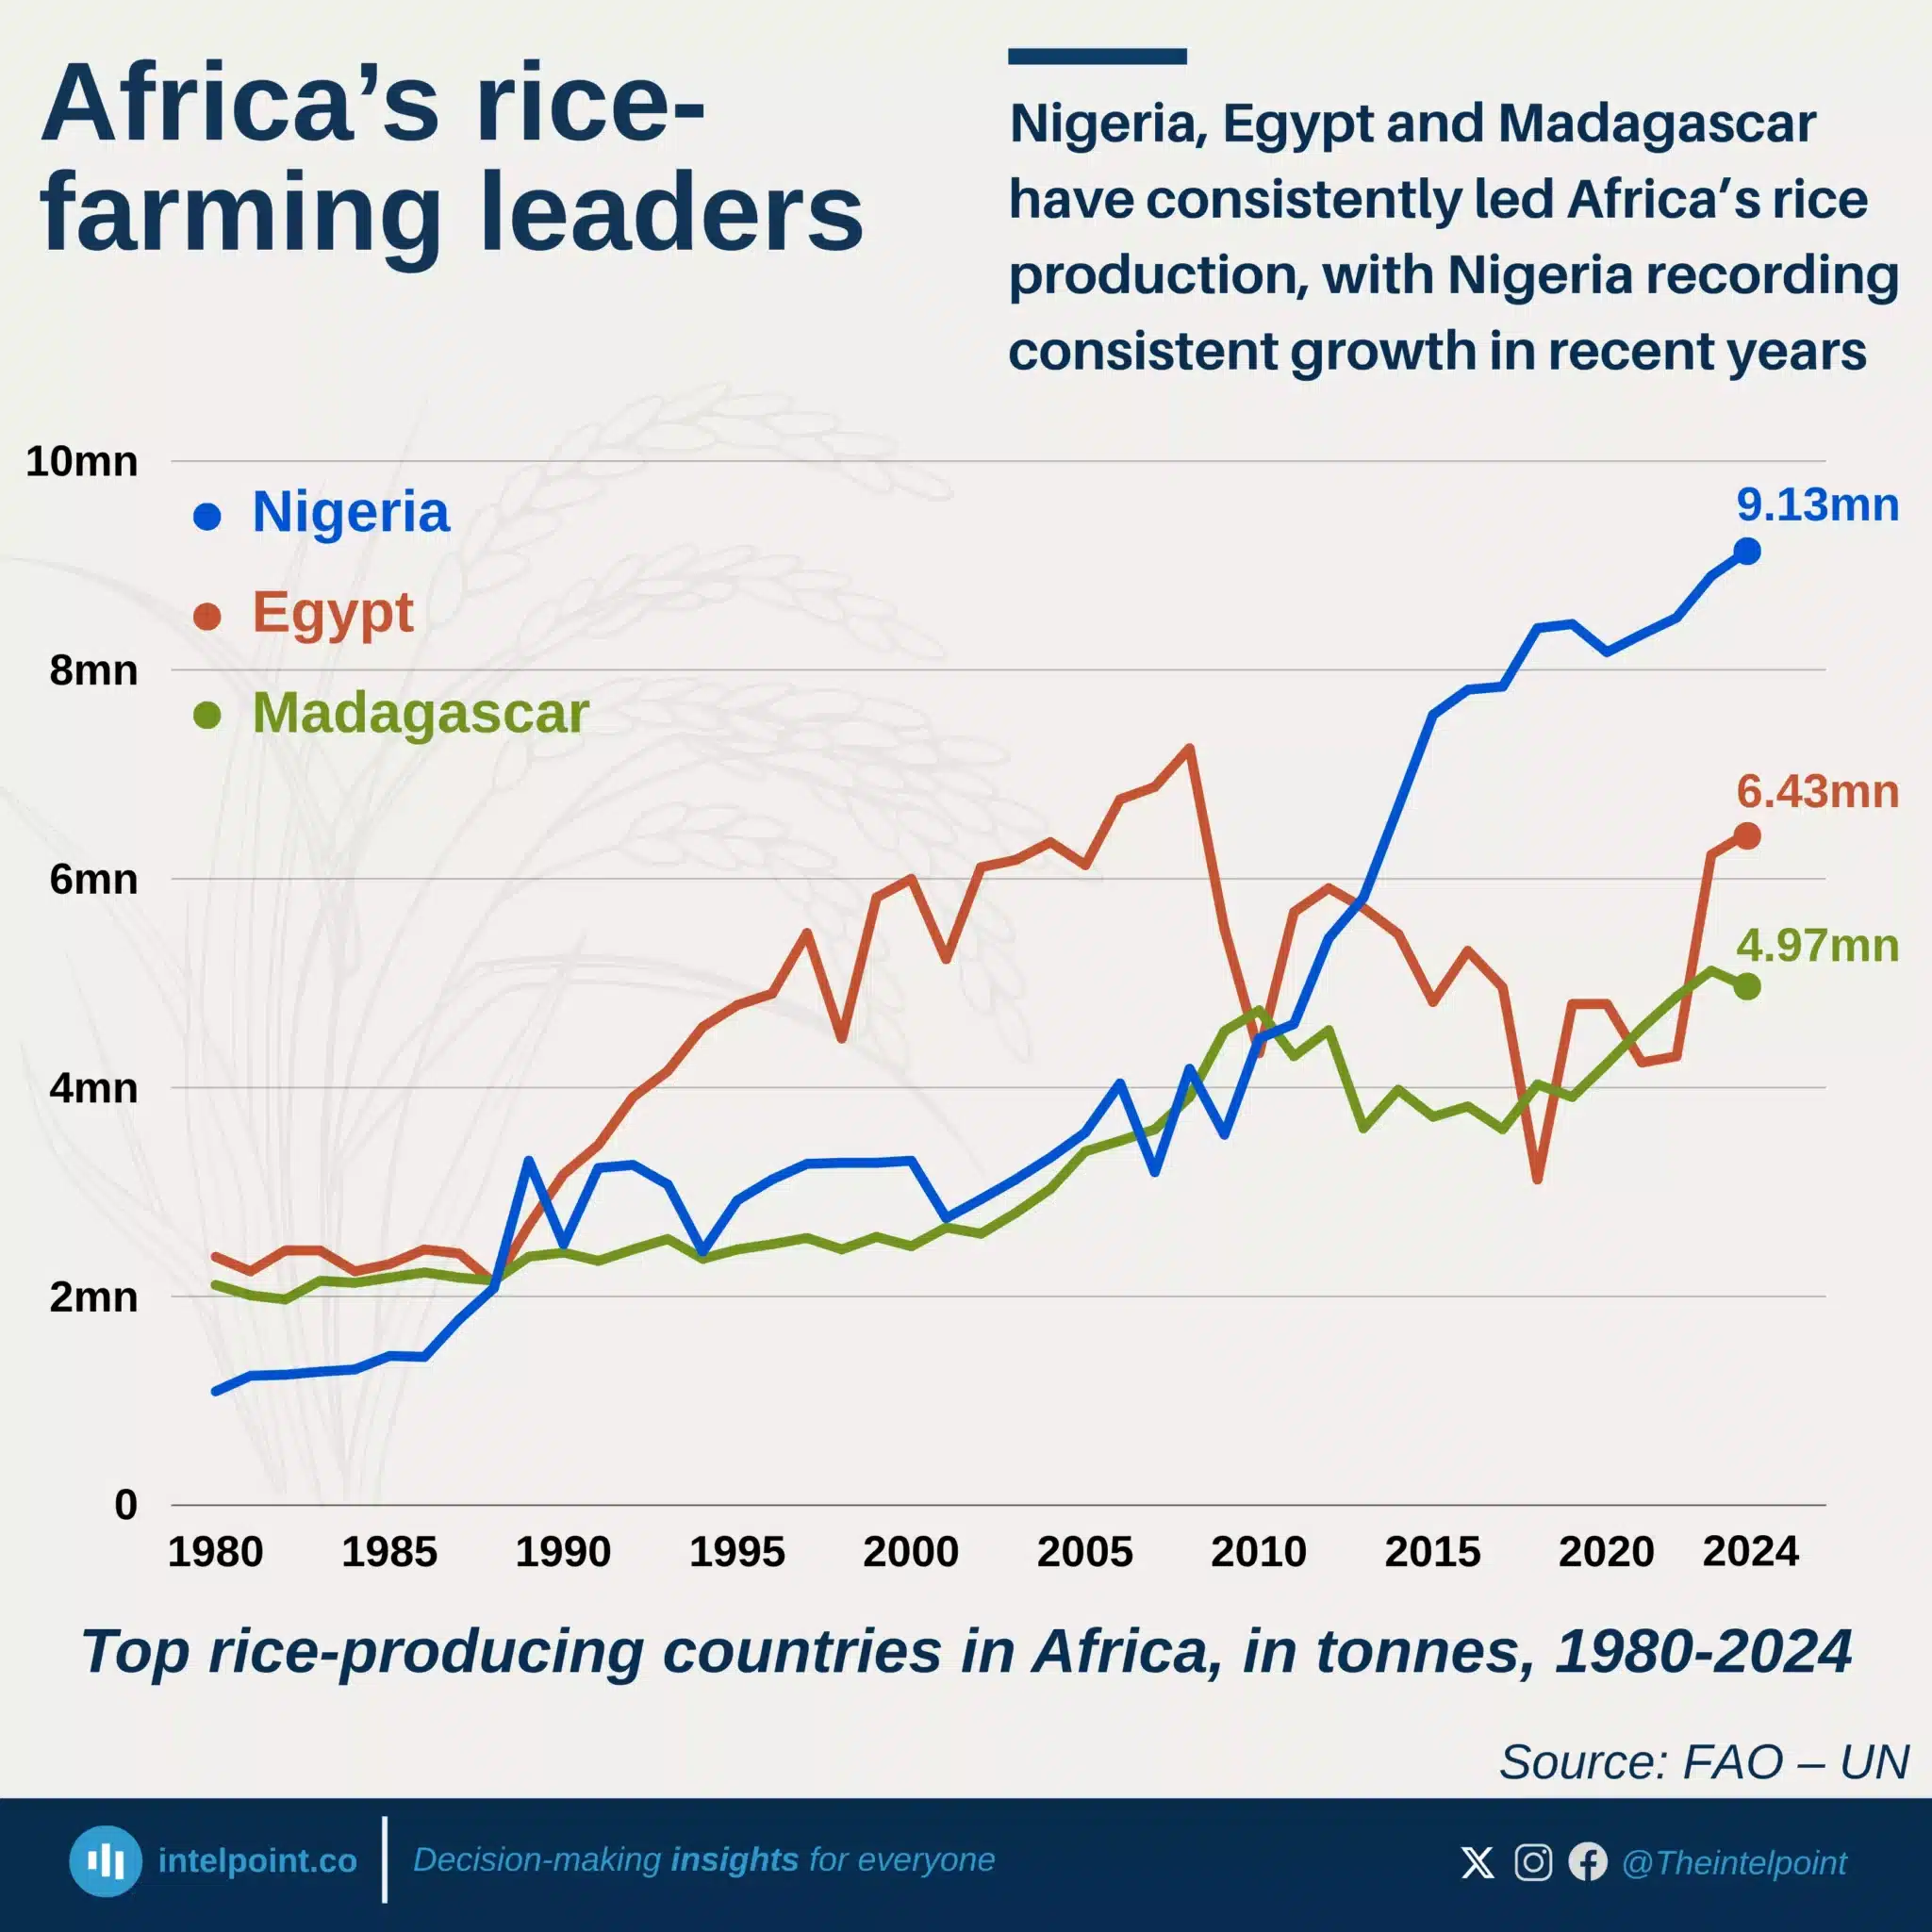
Nigeria, Egypt and Madagascar have consistently led Africa’s rice production, with Nigeria recording consistent growth in recent years
  • Nigeria's rice production hit 9.13 million tonnes in 2024, its highest level since 2021.
  • Egypt and Madagascar produced 6.43 and 4.97 million tonnes, respectively, in 2024.
  • Egypt and Madagascar combined produced 11.4 million tonnes, exceeding Nigeria's output.
  • Africa's rice production reached a record 44.8 million tonnes in 2024, up 421% since 1980.

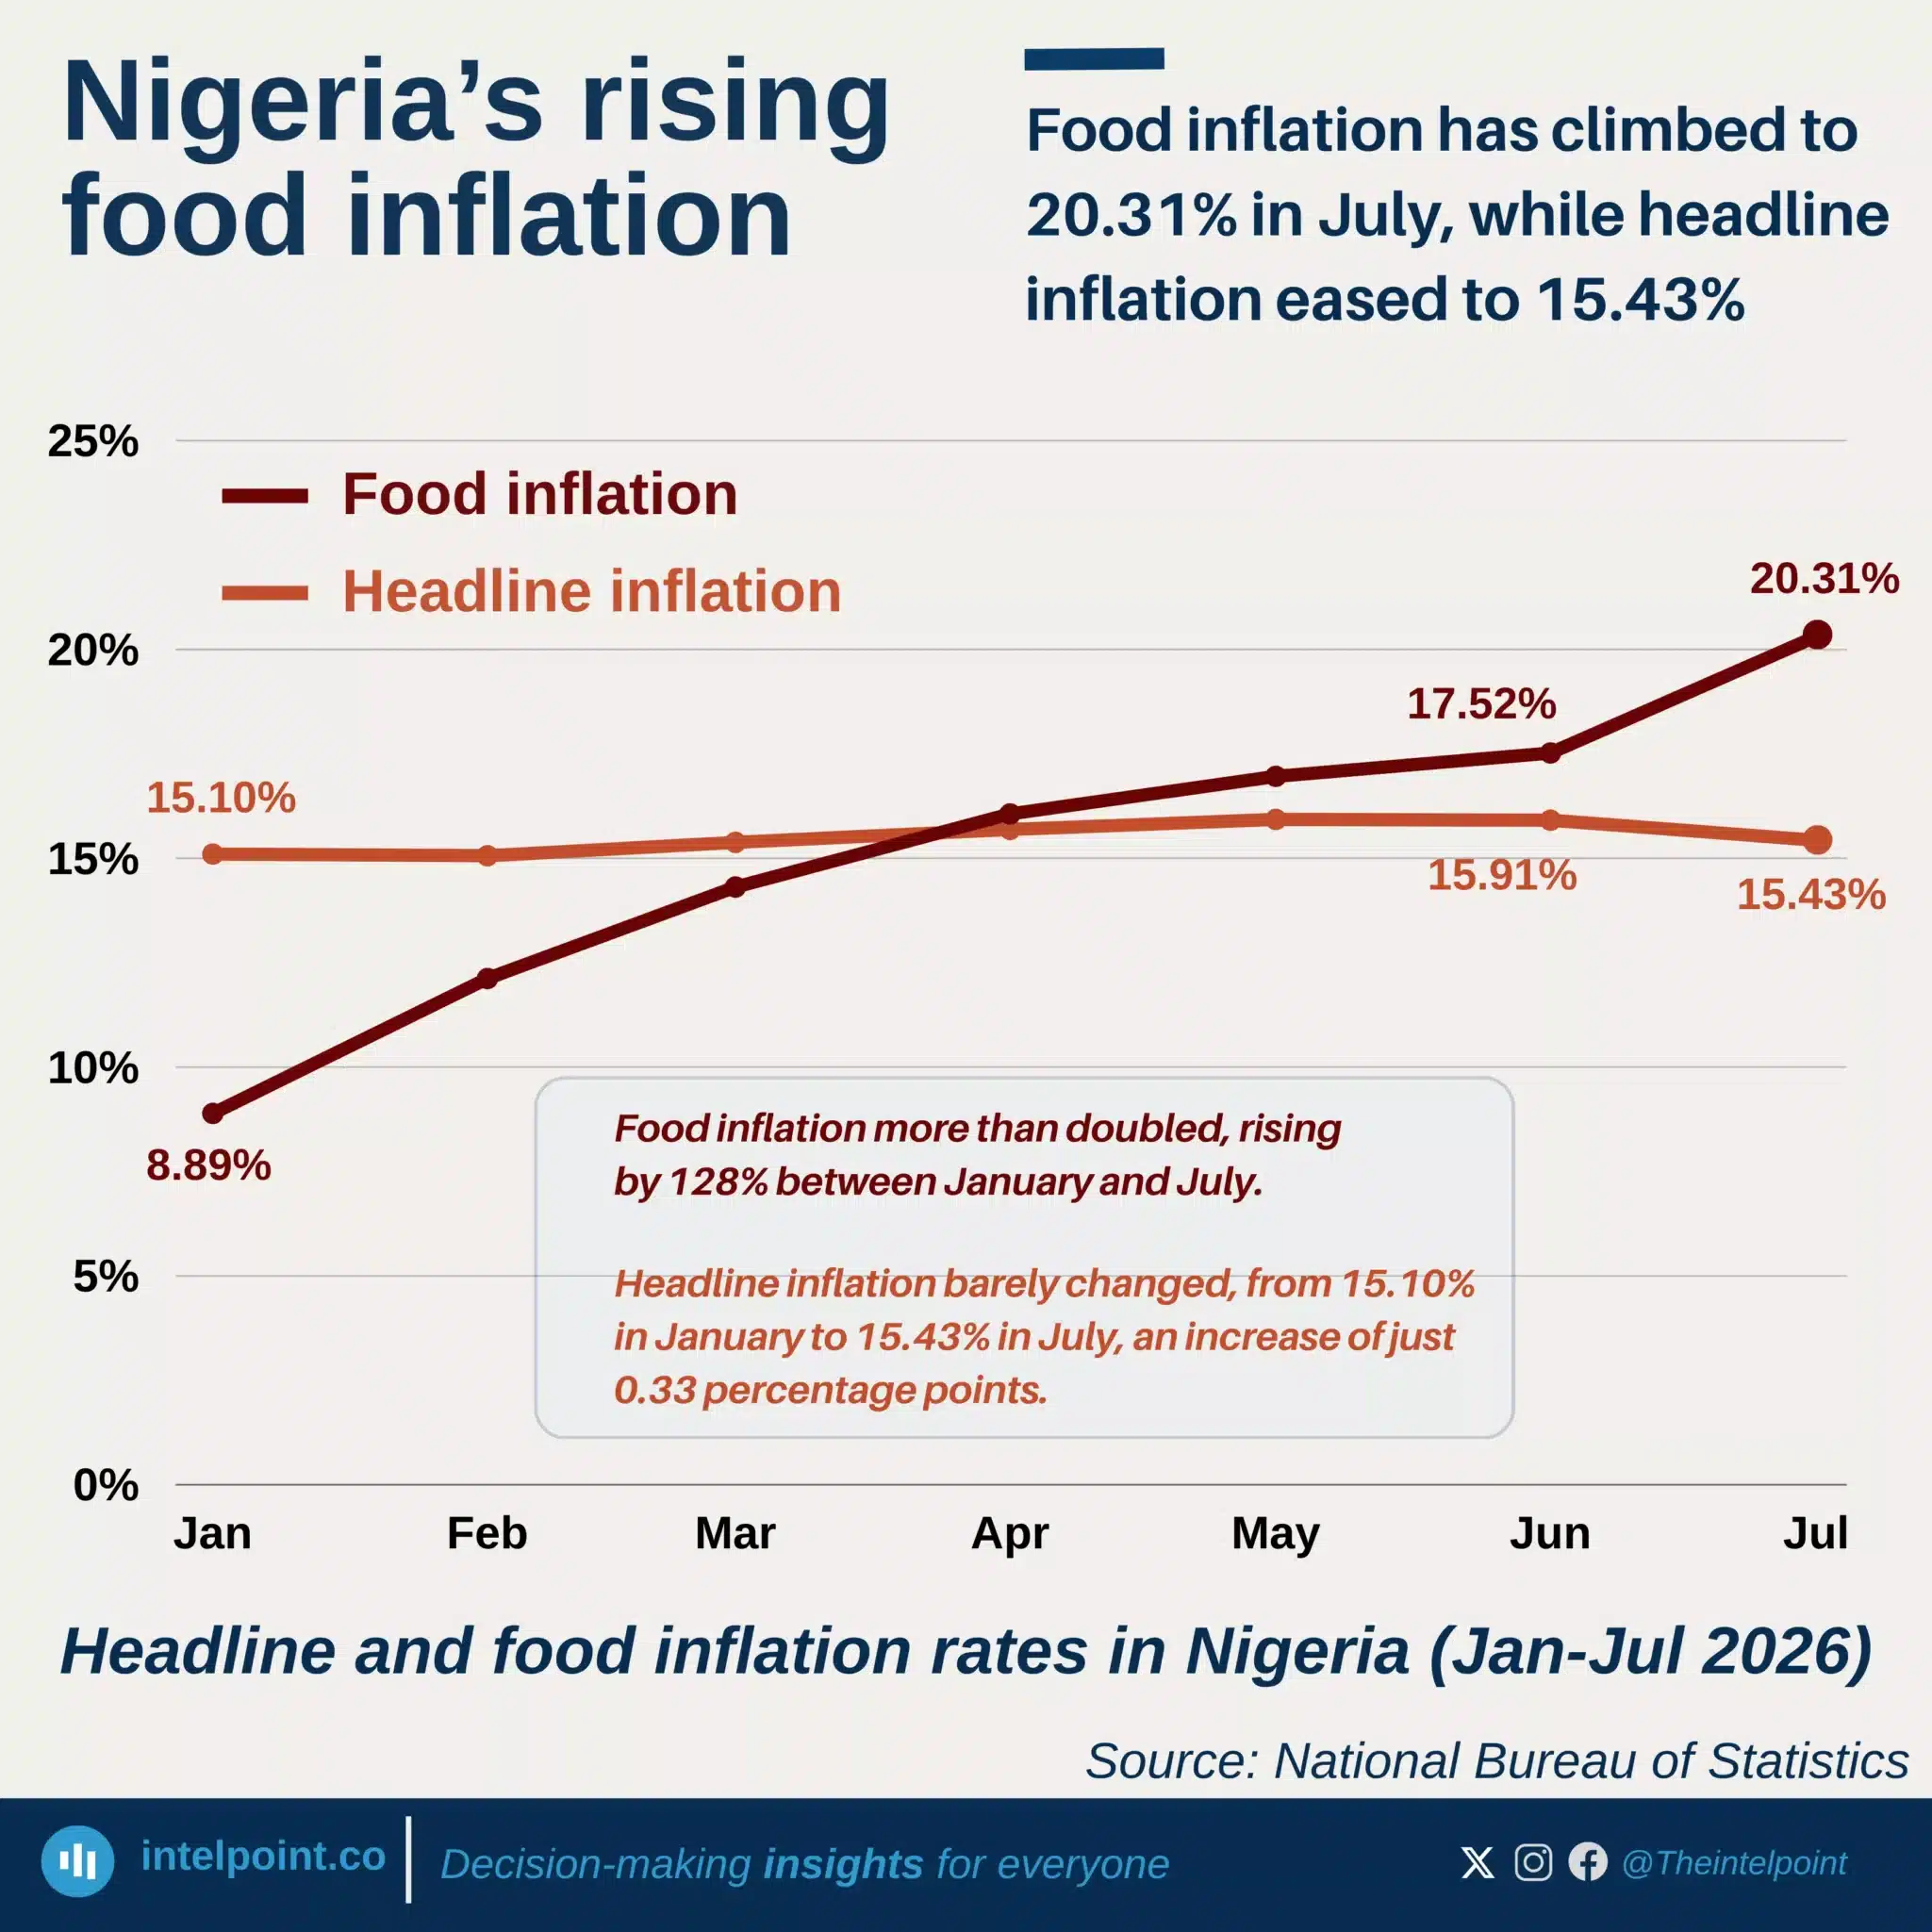
Food inflation has climbed to 20.31% in July, while headline inflation eased to 15.43%
  • Food inflation more than doubled, from 8.89% in January to 20.31% in July.
  • Food inflation overtook headline inflation, moving from 6.21 points below to 4.88 points above it.
  • Headline inflation barely changed, from 15.10% to 15.43%.
  • Food price pressures accelerated, with monthly inflation rising to 5.56% in July.

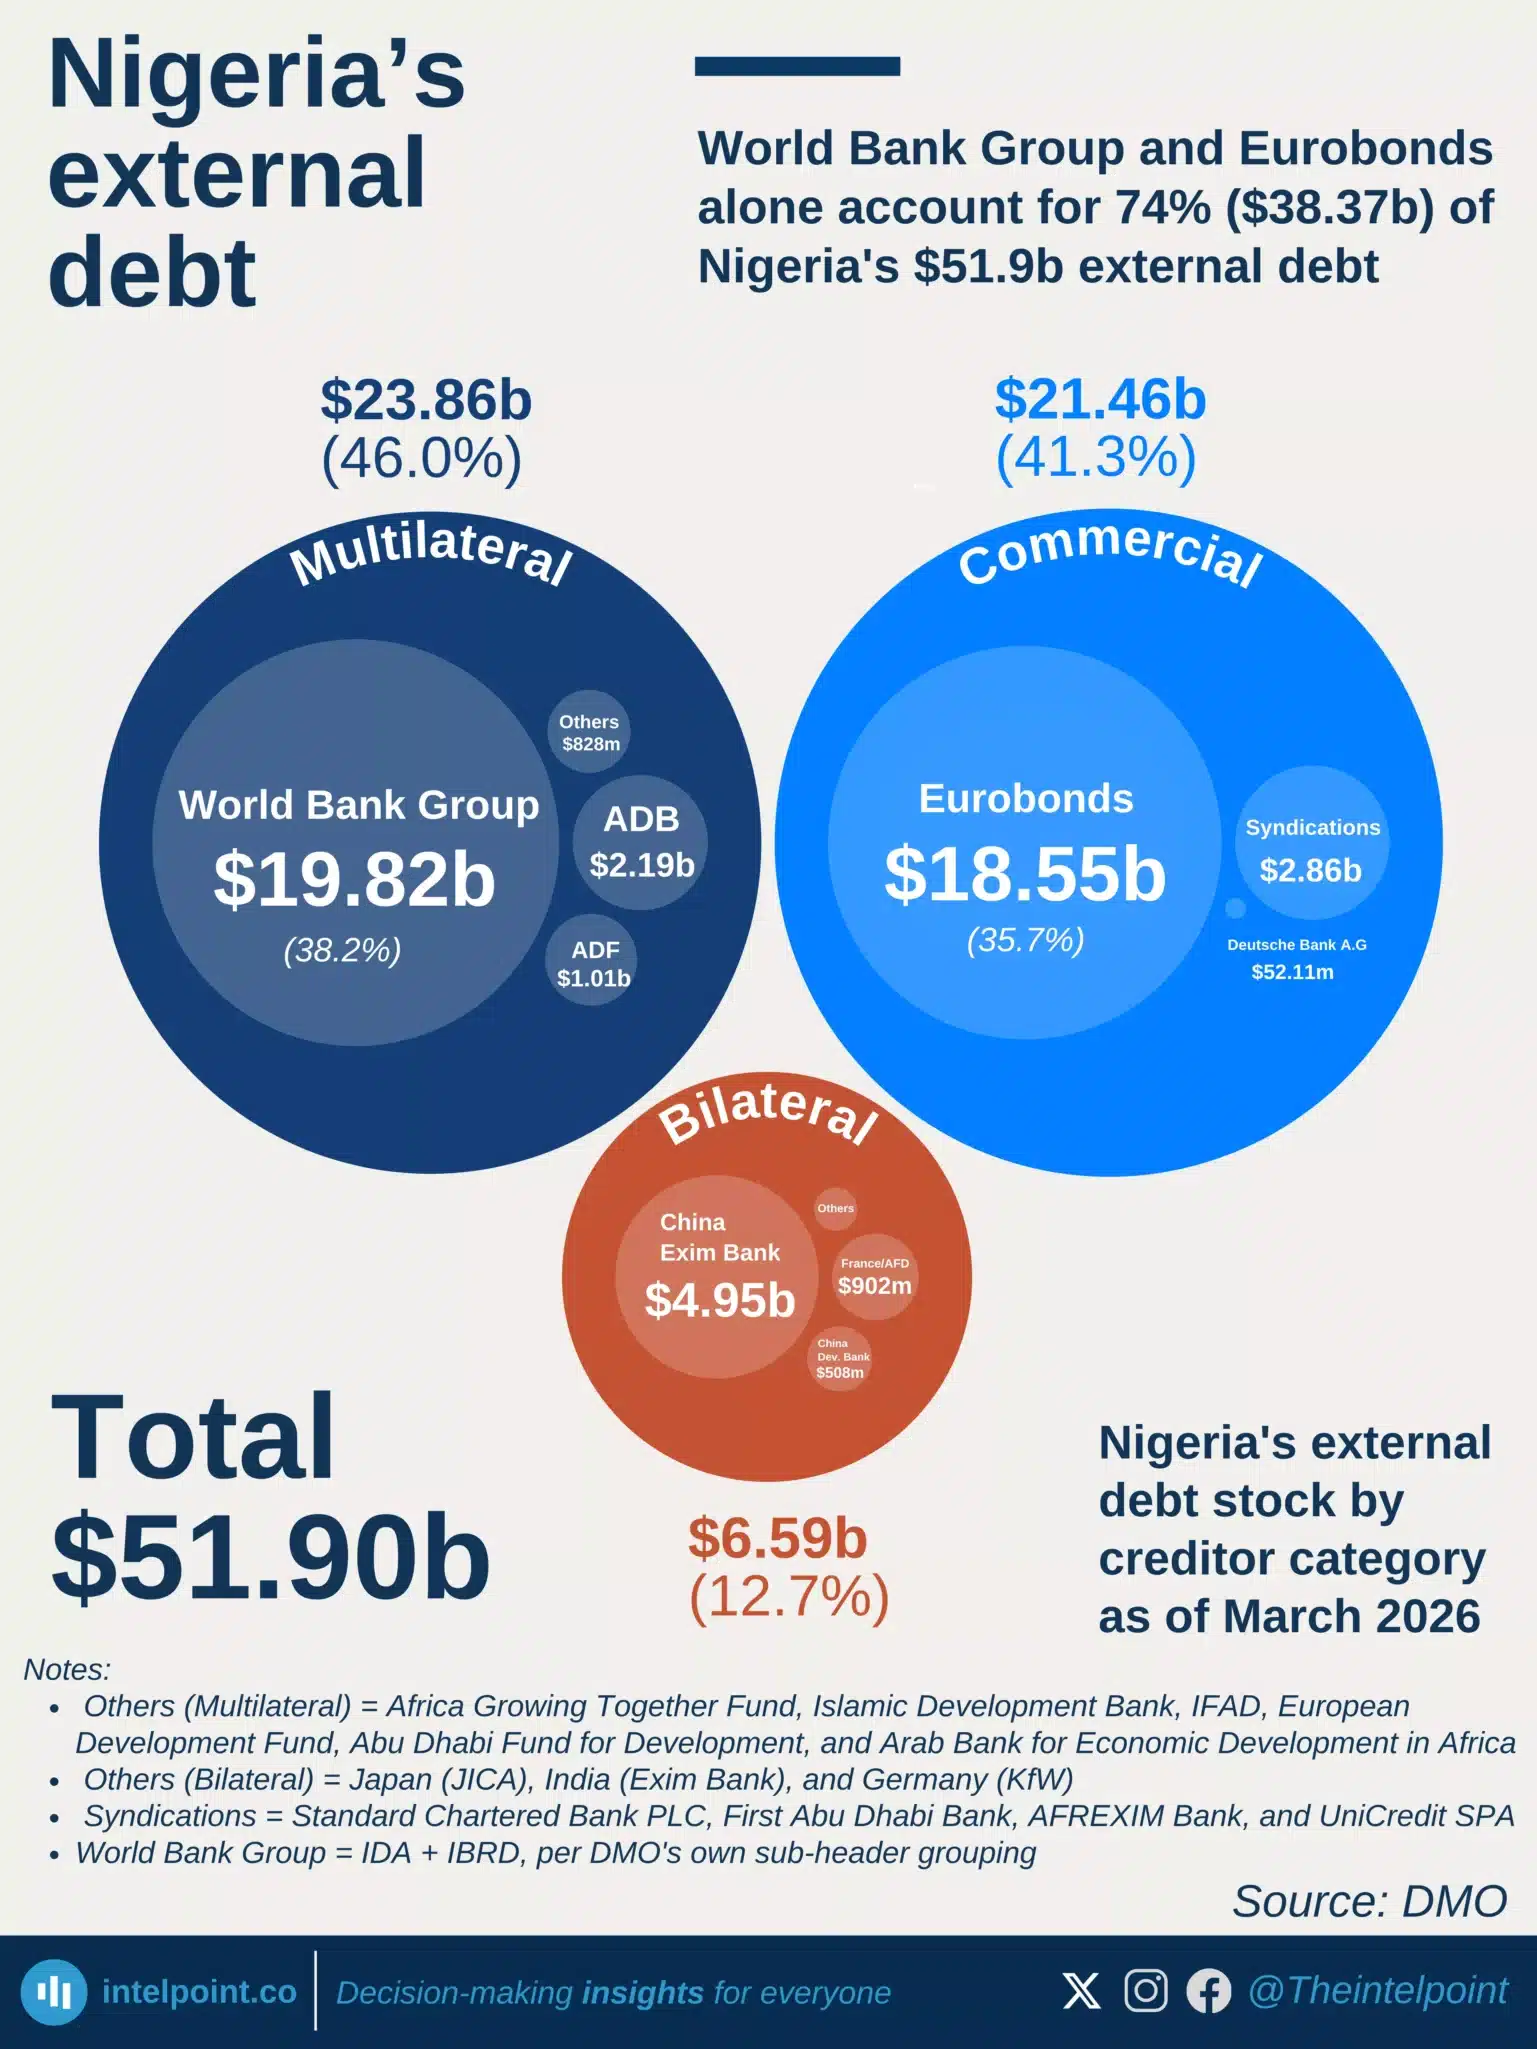
World Bank Group and Eurobonds alone account for 74% ($38.37b) of Nigeria's $51.9b external debt
  • Nigeria’s external debt stood at $51.90 billion as of March 2026.
  • External debt increased by just 0.09% from December 2025.
  • Multilateral creditors held the largest share at 46.0%.
  • Commercial creditors accounted for 41.3% of external debt.
  • Bilateral creditors accounted for 12.7% of external debt.
  • The World Bank Group accounted for 38.2% of total external debt.
  • Eurobond holders accounted for 35.7% of total external debt.
  • The World Bank Group and Eurobond holders together accounted for 73.9% of Nigeria’s external debt.
  • Bilateral debt fell by $130 million from December 2025 to March 2026.
  • Commercial external debt increased by about $1.1 billion over the same period.

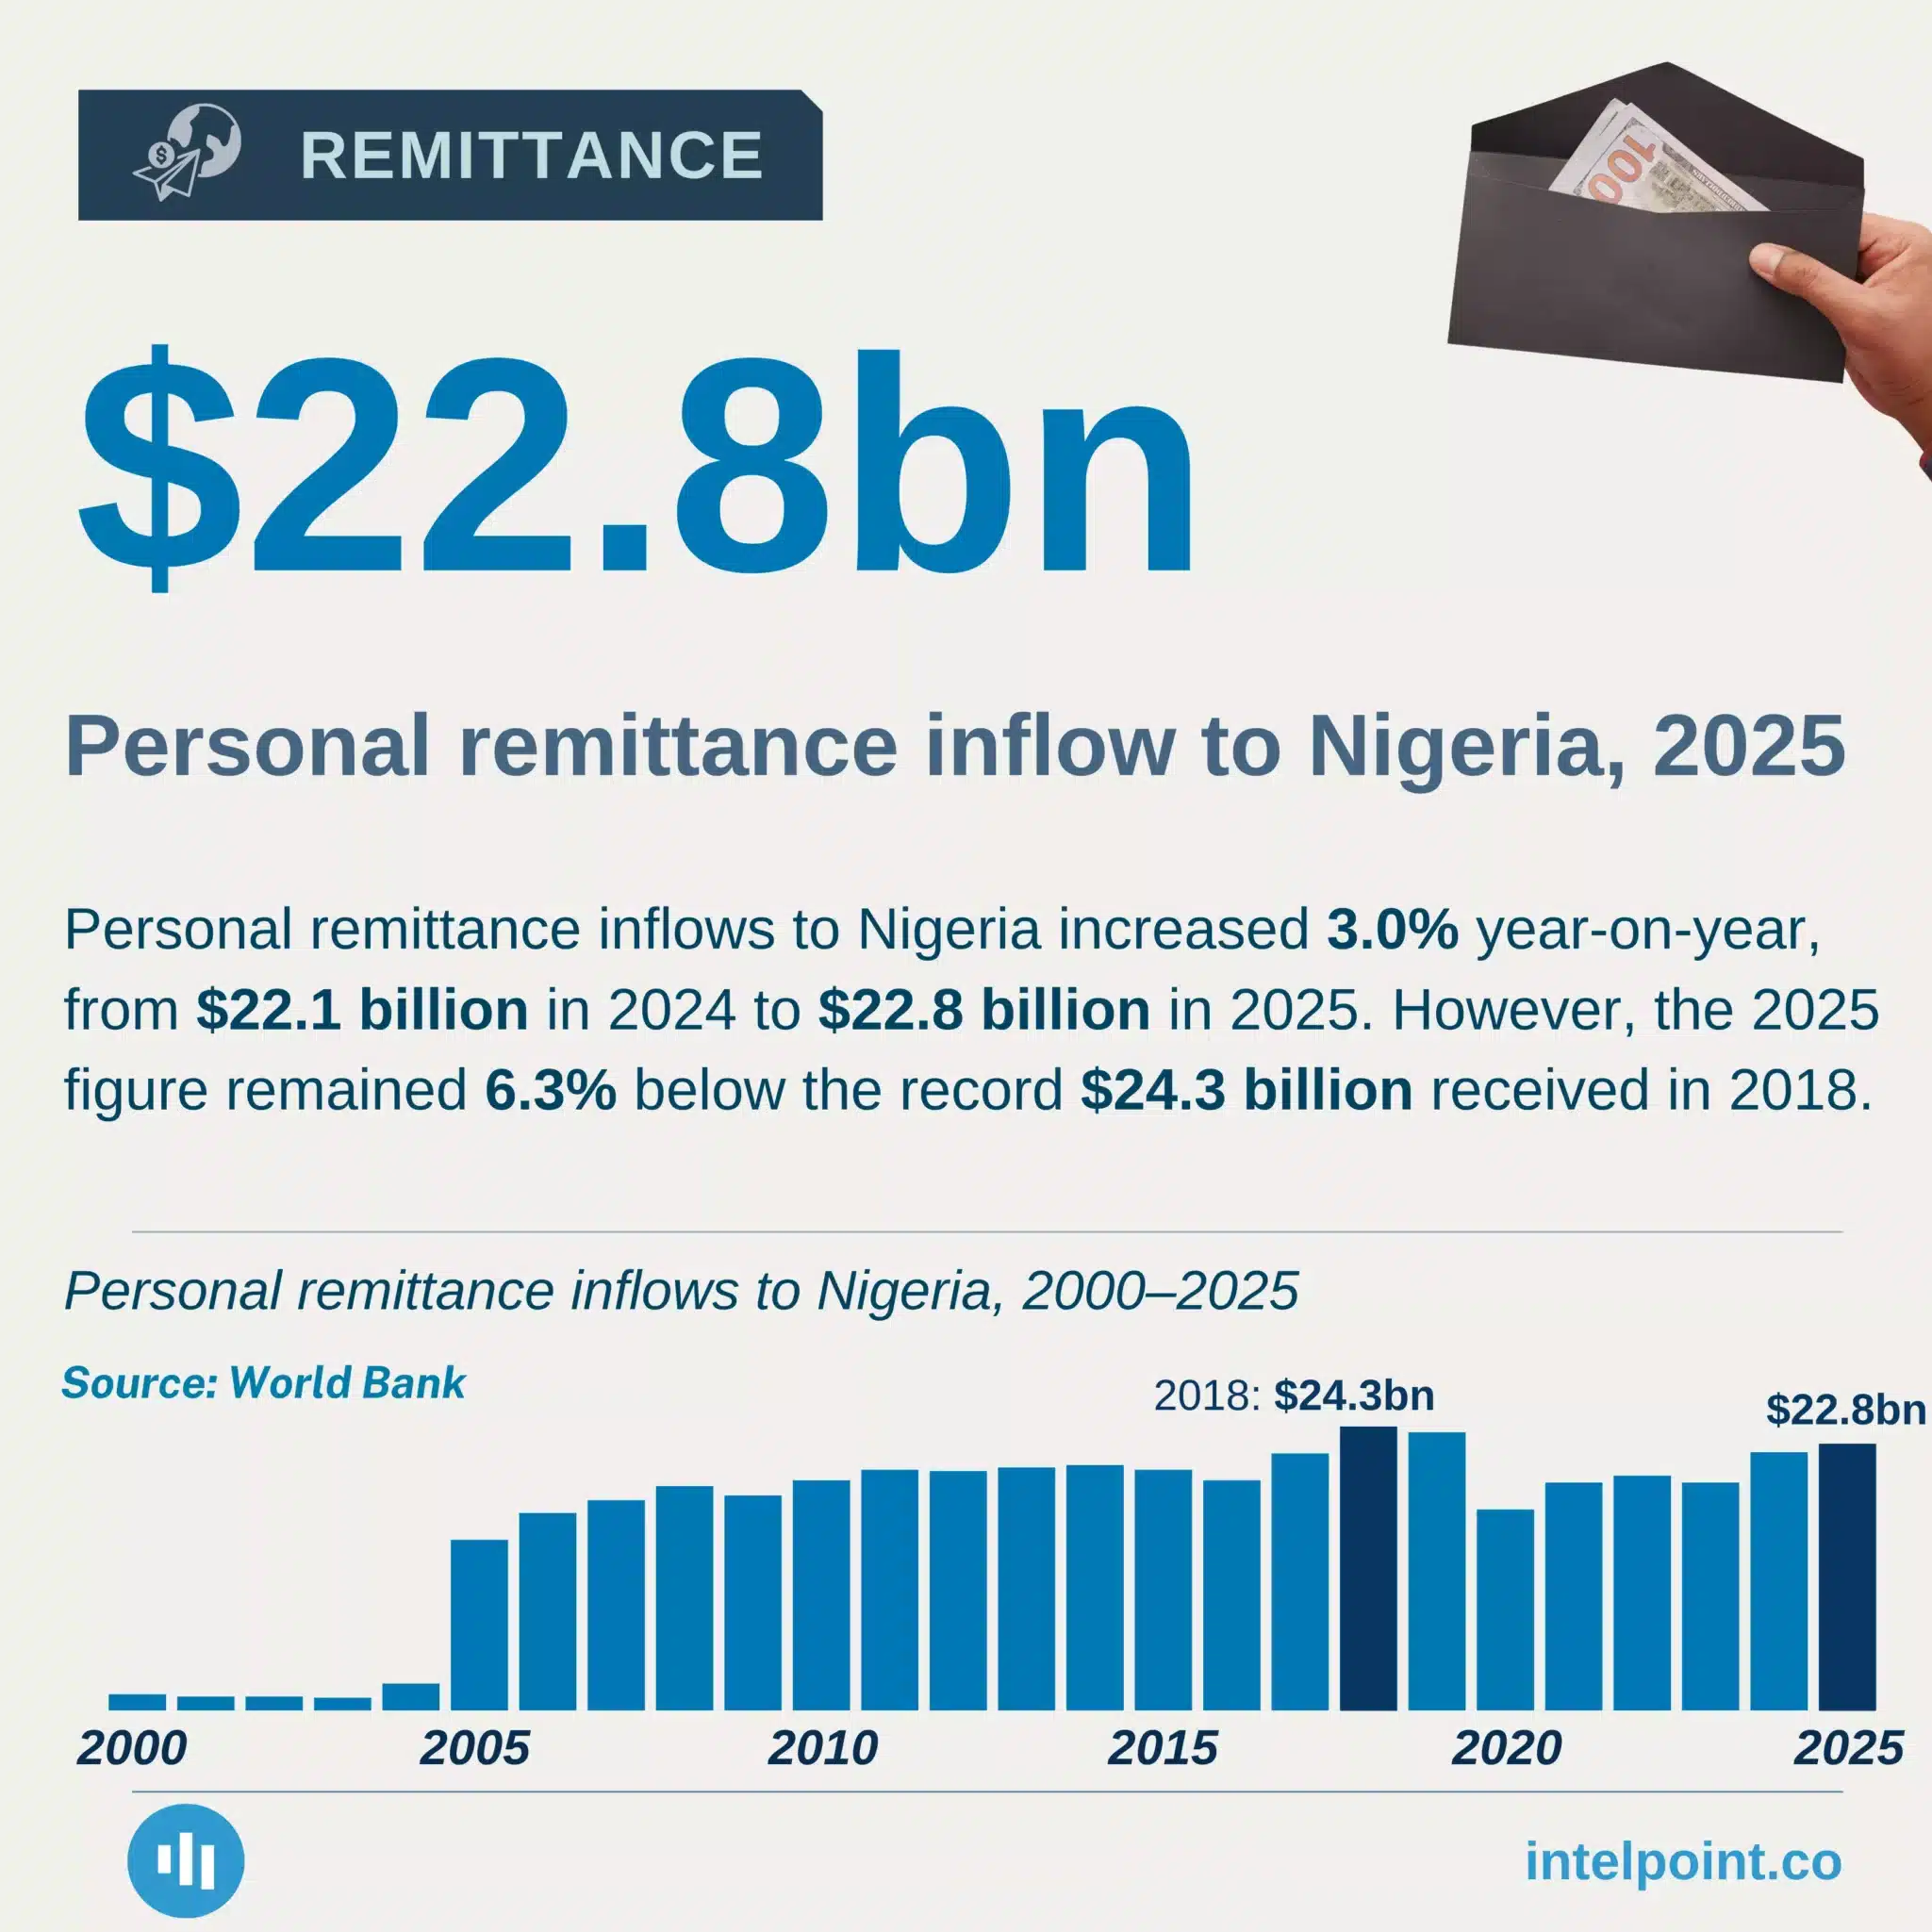
Personal remittance inflows to Nigeria increased 3.0% year-on-year, from $22.1 billion in 2024 to $22.8 billion in 2025
  • Nigeria received $22.8 billion in personal remittances in 2025; a 3% year-on-year increase
  • Inflows remained 6.3% below the 2018 record of $24.3 billion.
  • Remittances have recovered from the $17.2 billion recorded in 2020.
  • Nigeria’s 2025 remittance inflows were 32.6% higher than in 2020.
  • Remittances accounted for 7.8% of GDP in 2025.
  • Remittances’ share of GDP fell from 8.8% in 2024.
  • Remittances’ share of GDP remained above the 4.0% recorded in 2023.

POPULAR TOPICS
SIGN UP TO OUR NEWSLETTER
Get periodic updates about the African startup space, access to our reports, among others.
Subscribe Here
Subscription Form

A product of Techpoint Africa. All rights reserved