Nigeria’s foreign trade

Crude oil led Nigeria’s export trade, while manufactured goods dominated imports trade in Q1 2025

  • Total Trade Volume in Q1 2025 stood at ₦36.02 trillion, with exports totalling ₦20.6 trillion and imports at ₦15.4 trillion, resulting in a surplus of ₦5.17 trillion.
  • Crude oil dominates Nigeria’s export trade, accounting for the largest share of export revenue. -
  • Other petroleum oil products are also a major export item, reflecting the significance of both raw and refined oil-based commodities in Nigeria’s trade portfolio. -
  • On the import side, manufactured goods dominate, showing Nigeria’s continued reliance on foreign machinery, technology, and consumer goods.
  • While Nigeria exports mostly raw and oil-based products, it imports refined, processed, or industrial goods, indicating a structural trade gap and limited local industrial capacity. -
  • Agricultural and raw material goods feature on both sides of trade, but their value is significantly less than petroleum-related trade.

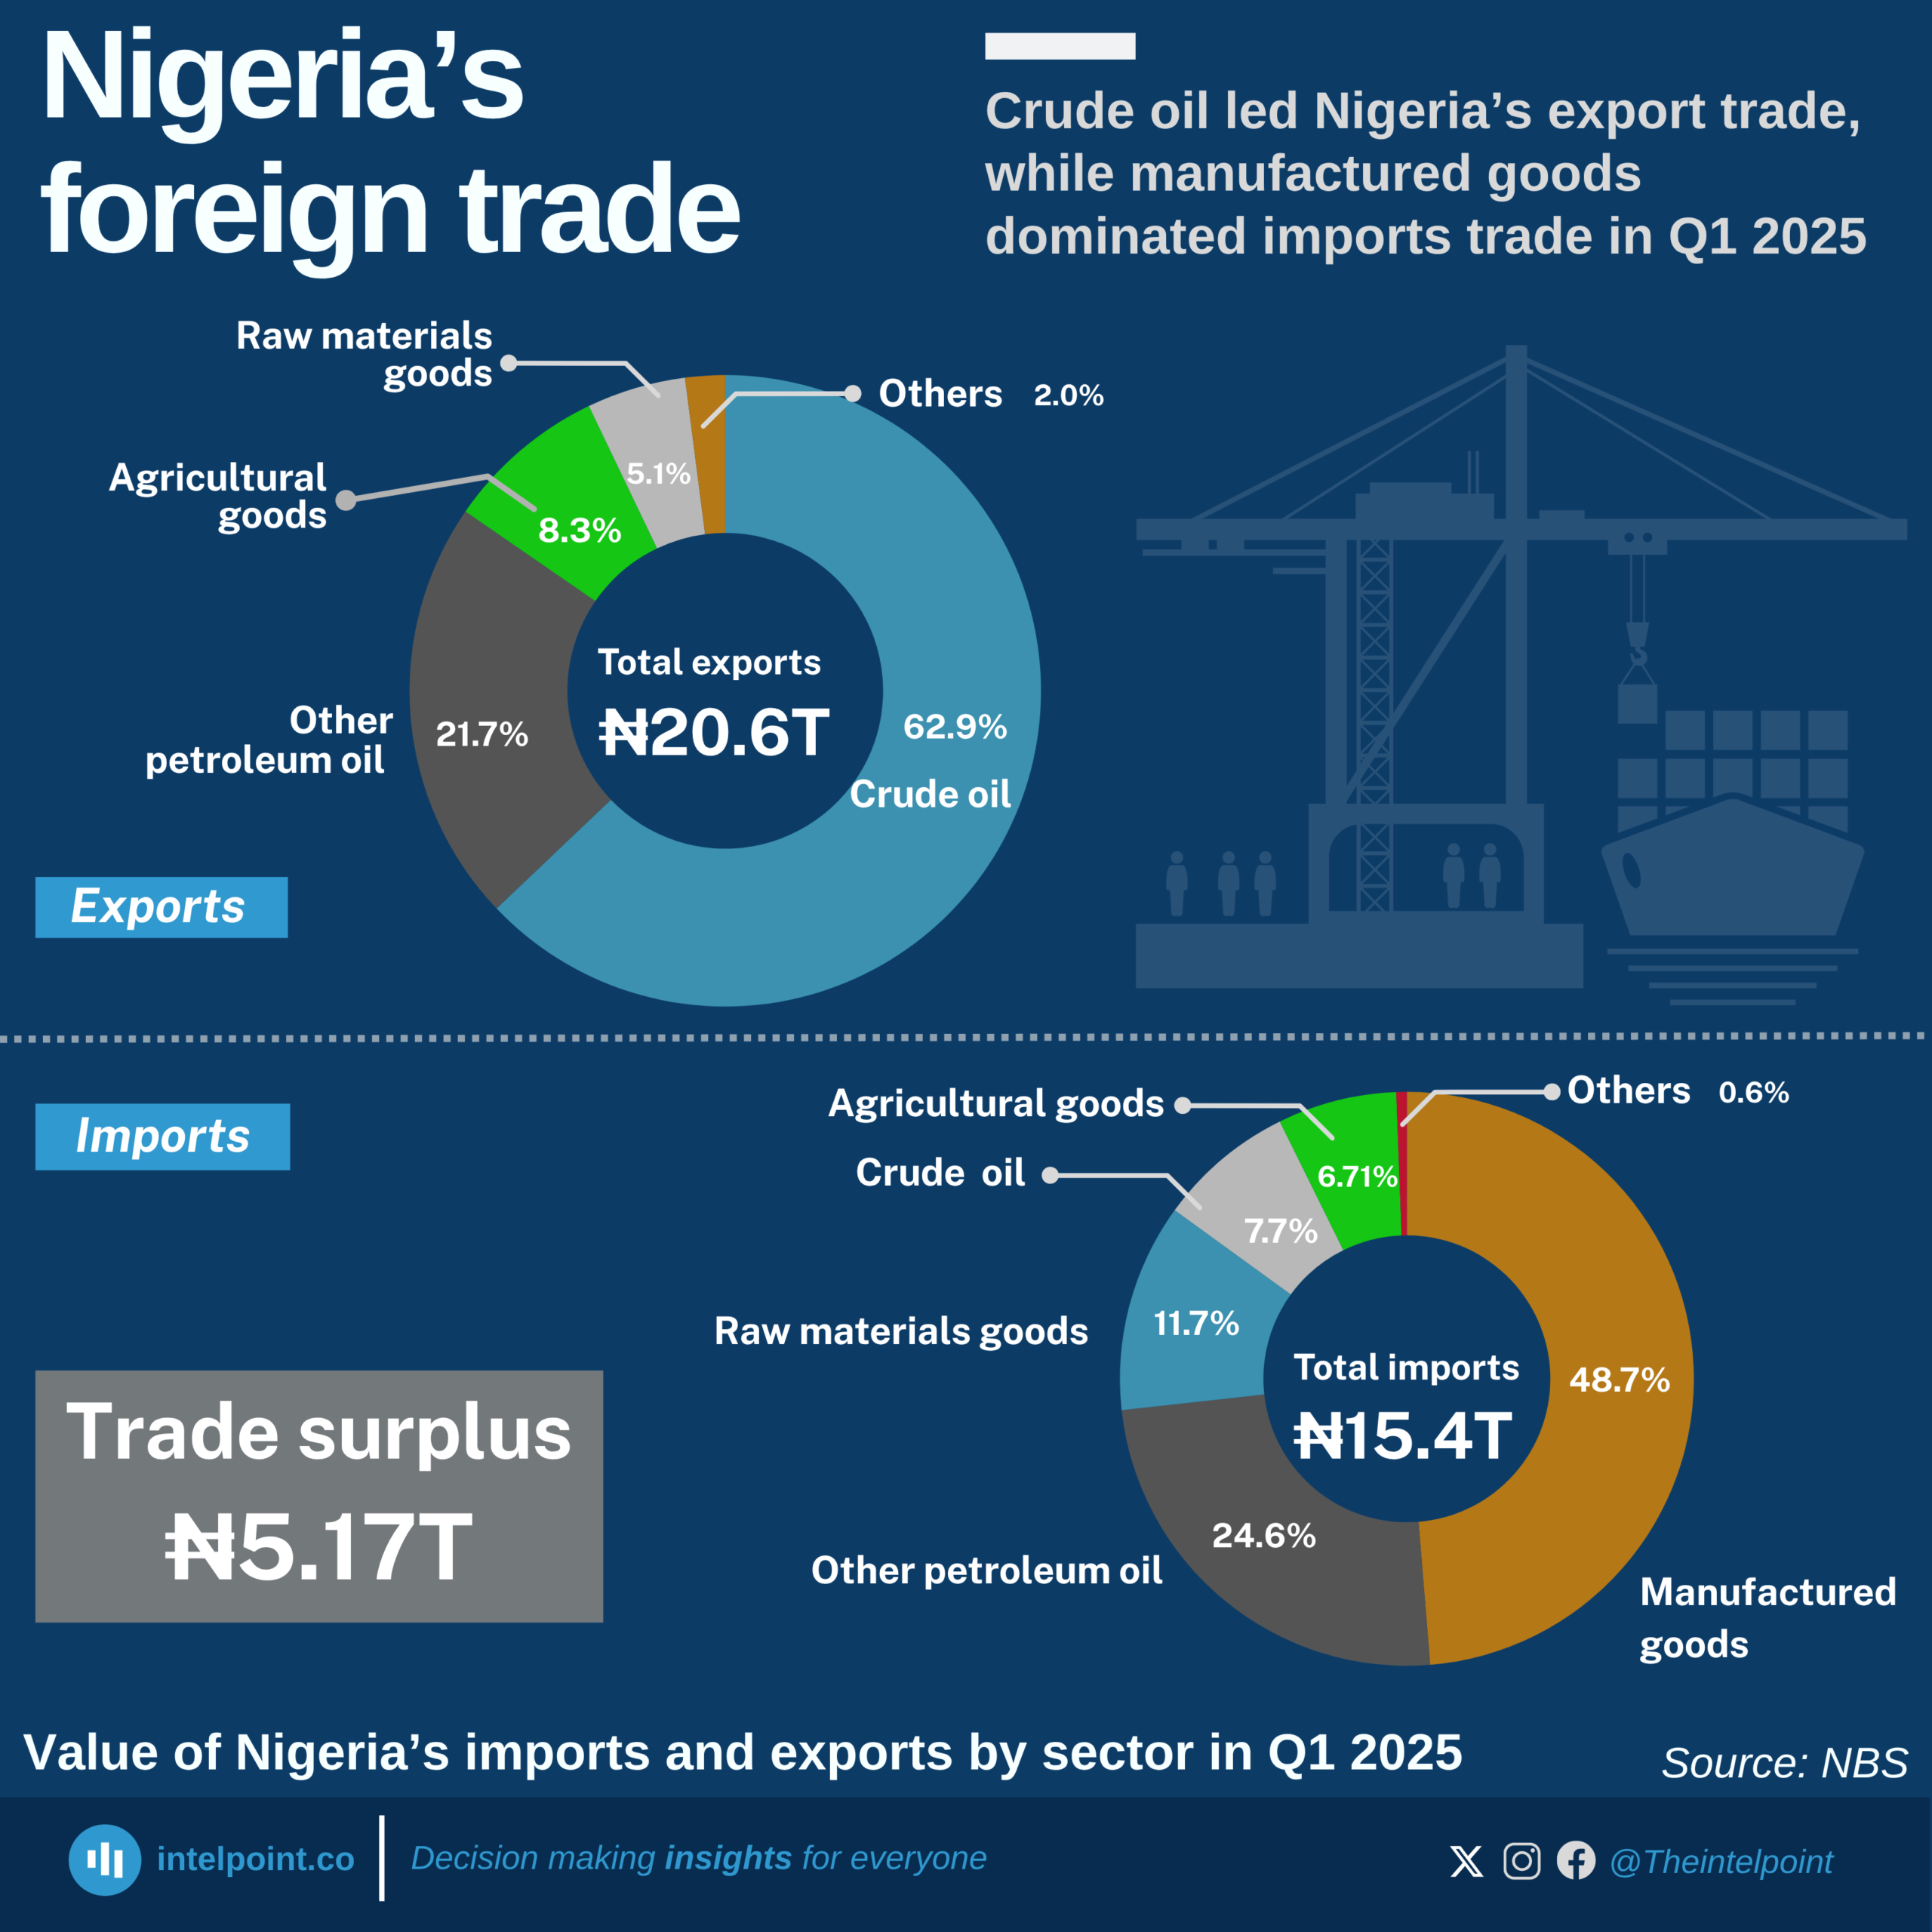
Nigeria’s foreign trade reached a total of ₦36.02 trillion in Q1 2025, with exports surpassing imports and delivering a trade surplus of ₦5.17 trillion. The economy remains heavily oil-dependent, as crude oil alone accounted for the lion’s share of export earnings. Alongside crude oil, other petroleum oil products, such as lubricants, kerosene, and diesel, contributed significantly to the export value, reinforcing Nigeria's role in global energy supply chains.

Interestingly, these petroleum derivatives also featured prominently in the country’s import profile, possibly pointing to inadequate domestic refining capabilities. The import side was heavily skewed toward manufactured goods, a recurring pattern that highlights Nigeria’s limited local production capacity and high dependence on foreign industrial goods.

This mismatch, exporting raw materials and importing refined products, signals a longstanding economic imbalance. Until the country boosts its industrial and refining capabilities, this structure is likely to persist.

Source:

NBS

Period:

Q1 2025
HTML code to embed chart
Want a bespoke report?
Reach out
Tags
Related Insights

Agricultural products led Kenya’s 2024 export economy, with coffee, tea, and spices generating $1.7 bn
  • Agriculture dominated Kenya’s exports, with coffee, tea, and spices alone contributing $1.7 billion, the largest single export category.
  • Mineral fuels were a surprisingly strong second, delivering $1.1 billion, and showing Kenya’s growing role in regional fuel distribution.
  • Horticultural exports (flowers, live plants, and trees) contributed $790 million, reinforcing Kenya’s global strength in floriculture.
  • All other export categories fall below $300 million individually, reflecting a long list of small but diverse export segments such as textiles, vegetables, and pharmaceuticals.

Mining led South Africa’s 2024 exports with 18.7%, as gems and precious metals generated over $20 bn
  • Gems and precious metals were the largest single export category, contributing $20.6 billion.
  • Ores and industrial minerals followed closely with $17.2 billion, showing the country’s reliance on mining.
  • Vehicles and machinery were significant non-mineral exports, with a combined $18.3 billion.
  • Agricultural and light industry products like fruits, nuts, and beverages contributed modestly, strengthening mining and manufacturing’s position as the core export drivers.

Cocoa accounted for 4.6% of Nigeria’s 2024 exports, making it the country’s second-largest export after oil
  • Mineral fuels (including crude oil) accounted for $49.3 billion, or 86.8% of total exports in 2024.
  • Non-oil exports remained marginal, with the second-largest item, cocoa, contributing only 4.6%.
  • Fertilisers, ores, slag, ash, and oilseeds collectively made up less than 5%, indicating limited diversification.
  • All other export categories each contributed 1% or less, underscoring Nigeria’s narrow export base.

Nigeria’s power grid is 69.9% powered by thermal plants
  • Thermal energy dominates Nigeria’s grid, supplying 69.9% of total power.
  • Hydro plants contribute 30.1%, making them the country’s second major source.
  • The heavy reliance on thermal generation shows Nigeria’s grid is still largely fossil-fuel driven.
  • Hydro remains a crucial but secondary source, supporting overall supply stability.

Nigeria's DisCos recorded ₦360bn revenue gap after collecting ₦1.12tn from ₦1.49tn billed in H1 2025
  • DisCos billed approximately ₦1.49 trillion but collected only ₦1.12 trillion in H1 2025.
  • Ikeja and Eko DisCos generated the highest revenues, collecting ₦206.22 billion and ₦210.59 billion, respectively.
  • Revenue collection gaps remain significant, with Jos, Kaduna, and Yola posting the weakest collection performances.
  • The wide gap between billings and actual collections suggests persistent challenges in customer payment compliance, metering, and distribution efficiency.

Nigeria has installed 3.65 million electricity metres since 2019; Ikeja DisCo leads with 823,000, and Aba Power at the bottom with 56,000
  • Approximately 3.65 million metres have been installed nationwide across all frameworks since 2019.
  • Ikeja DisCo leads by a wide margin with 823,000 installations, over twice the volume of most other DisCos.
  • Kaduna, Yola, and Aba Power recorded the lowest metre installations, each below 100,000.
  • The disparities in installation totals reveal uneven progress in achieving nationwide metering coverage.

POPULAR TOPICS
SIGN UP TO OUR NEWSLETTER
Get periodic updates about the African startup space, access to our reports, among others.
Subscribe Here
Subscription Form

A product of Techpoint Africa. All rights reserved