Nigeria's debt service per GDP increased from 0.7% in 2015 to 10.2% in 2024, with 2025 forecasted to reach 15.1%

  • Nigeria's debt service per GDP rose from 0.9% in 2009 to a projected 15.1% in 2025.
  • Overall CAGR from 2009 to 2025 is 17.8%.
  • President Muhammadu Buhari’s tenure saw the fastest growth (29.1% CAGR).
  • Under President Goodluck Jonathan, growth was slower (6.5% CAGR).
  • President Bola Ahmed Tinubu’s term so far shows a 27.6% CAGR.

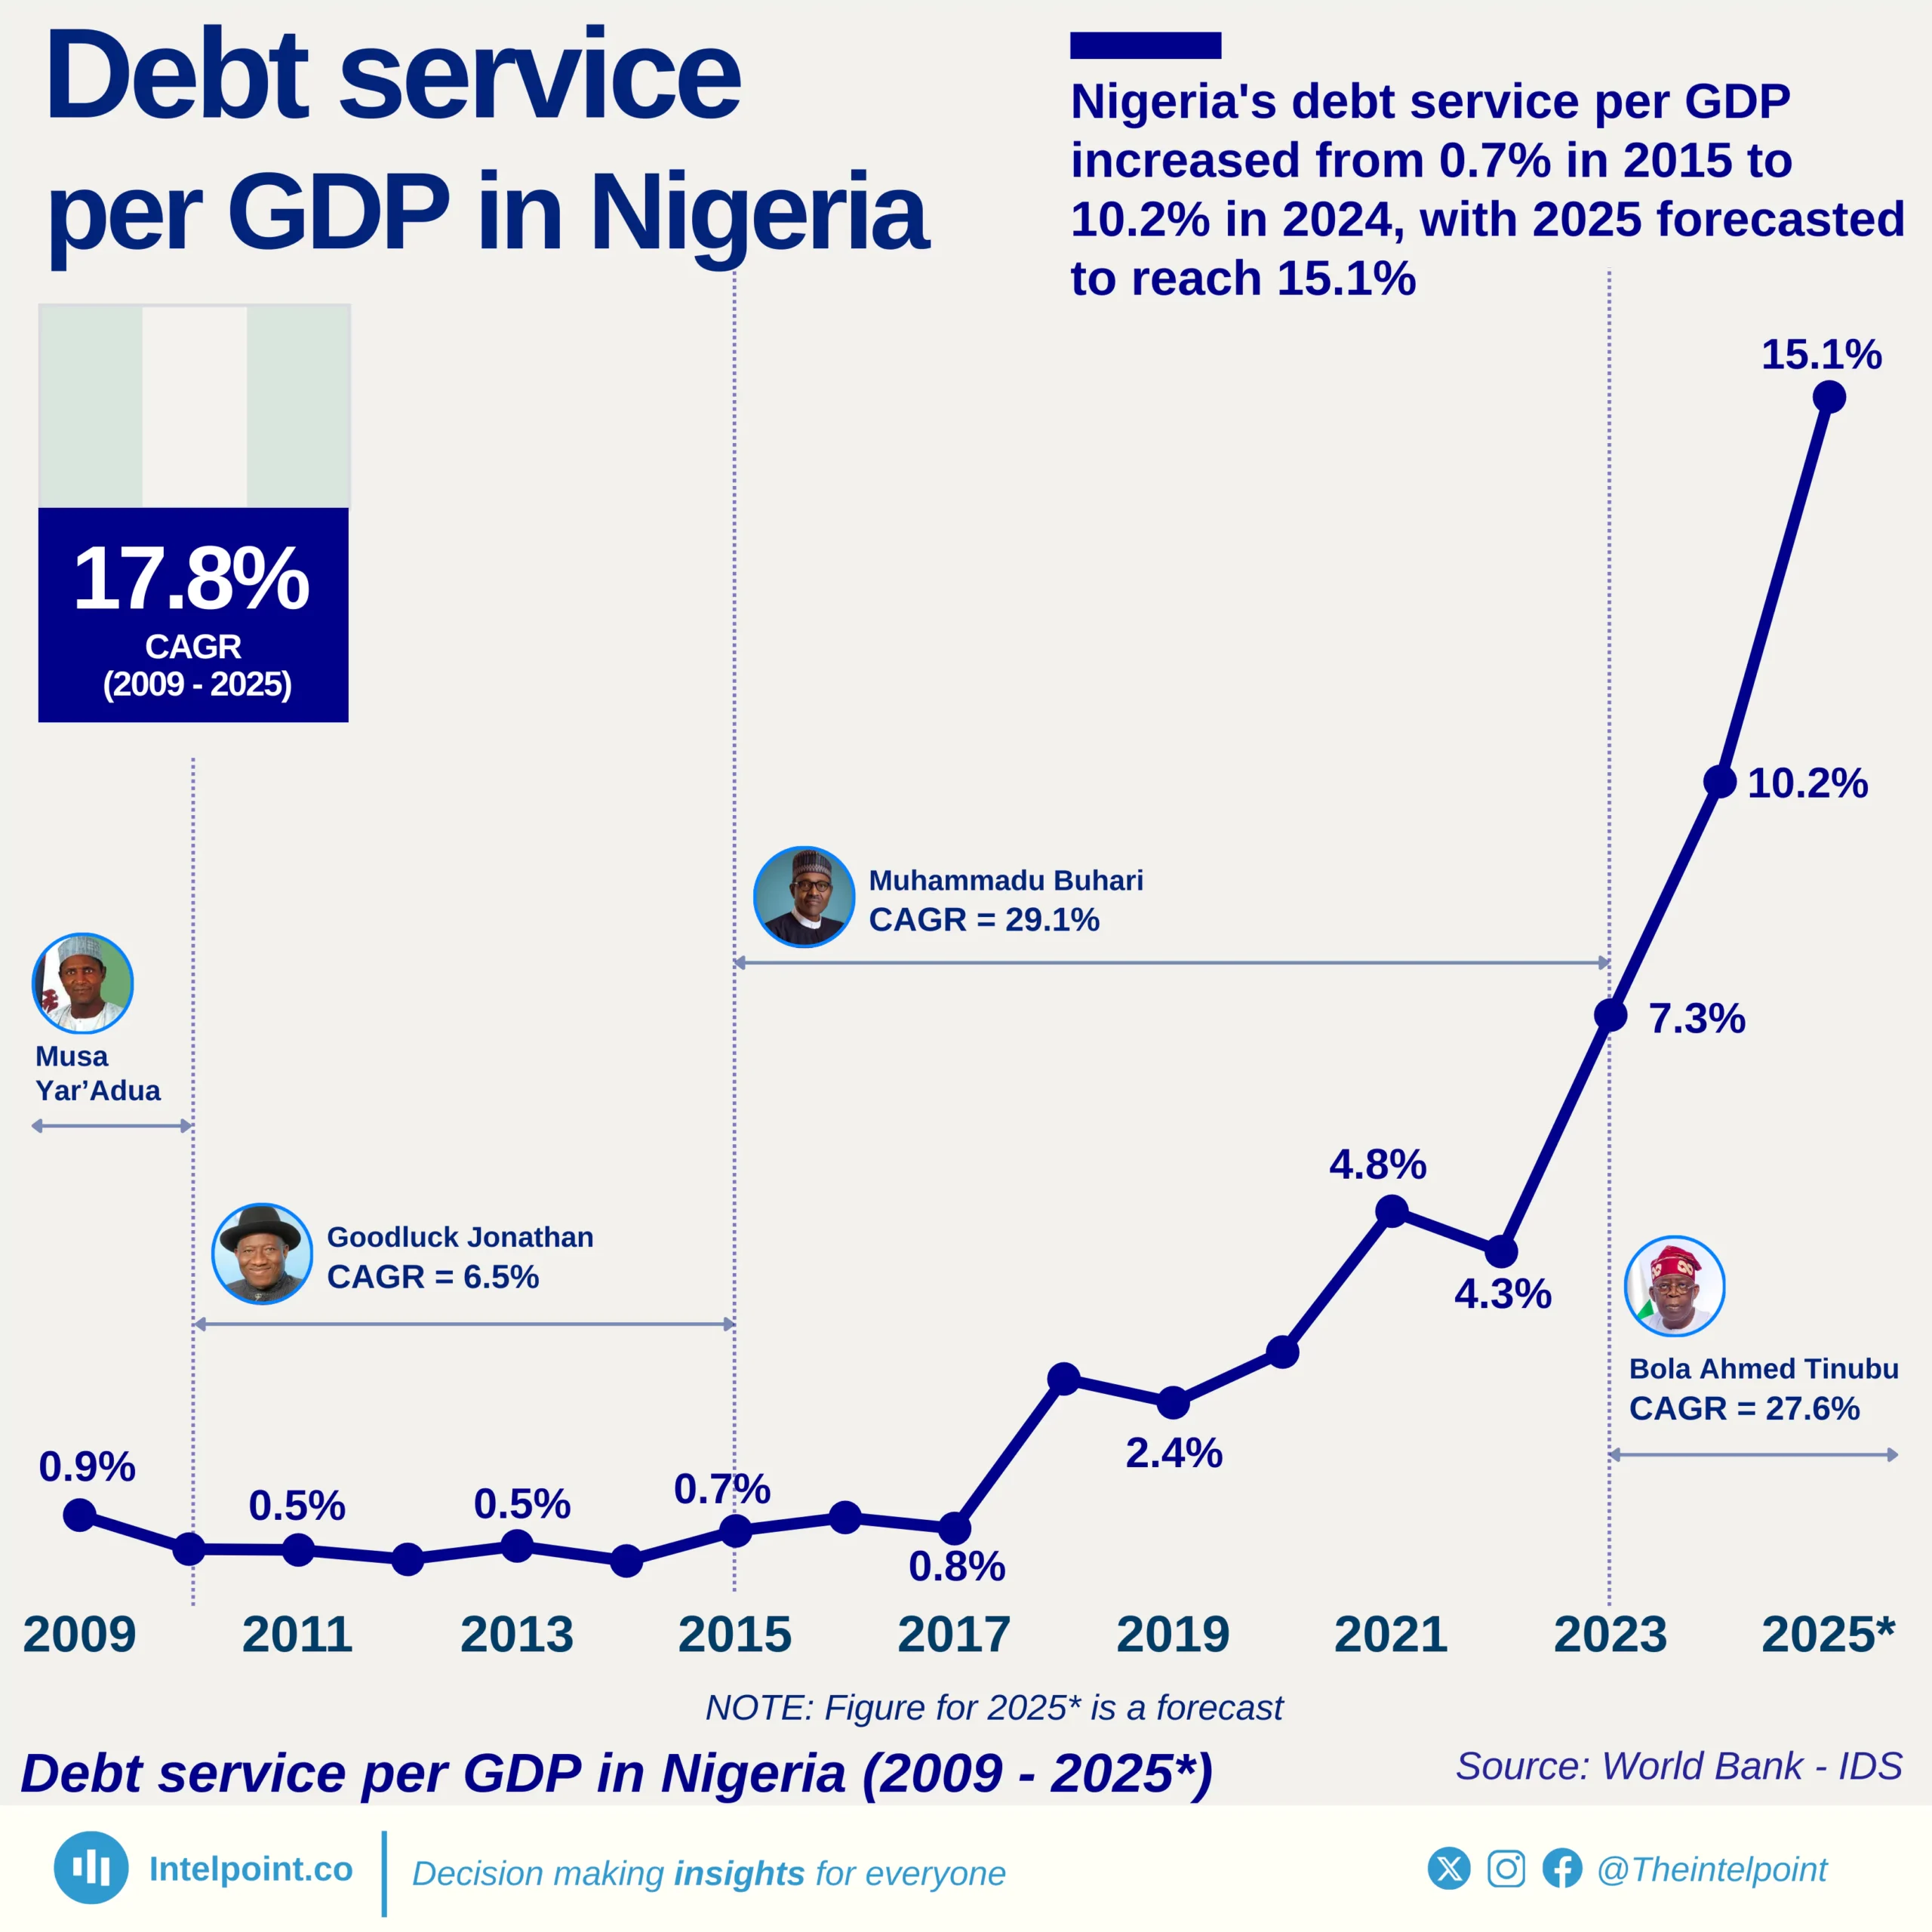
Nigeria’s debt service per GDP has risen sharply over the past decade and a half, climbing from 0.9% in 2009 to a projected 15.1% in 2025, after hitting a peak of 10.2% in 2024. The data reveals an average growth rate (CAGR) of 17.8% between 2009 and 2025, underscoring a significant increase in the country’s debt burden.

A closer look shows that the fastest growth occurred during President Muhammadu Buhari’s tenure (2015–2023), when debt service per GDP grew at an extraordinary 29.1% CAGR. Debt service per GDP growth was slower under President Goodluck Jonathan [(6.5% CAGR), and] there has been a noticeable uptrend in the first two years of President Bola Ahmed Tinubu (27.6% CAGR so far).

The overall trend points to mounting fiscal pressure. The sharp jumps in recent years, especially from 7.3% in 2023 to 15.1% in 2025, highlight how quickly debt service obligations are consuming a larger share of Nigeria’s economy.

Source:

World Bank - IDS

Period:

2009-2025
HTML code to embed chart
Want a bespoke report?
Reach out
Tags
Related Insights

Nigeria’s slice of Africa’s economy since independence: From a peak of 31% to 7% in 2024
  • At independence in 1960, Nigeria contributed about 10% of Africa’s GDP, establishing itself early as one of the continent’s largest economies.
  • Nigeria’s share peaked at 31% in 1981 during the oil boom, highlighting the dramatic impact of natural resources on the economy.
  • Between the mid-1980s and 2000s, Nigeria’s share fluctuated significantly, dropping to 9.2% in 1999 due to political instability, economic mismanagement, and external shocks.
  • By 2024, Nigeria’s share fell to 7.1%, despite a GDP of $187.8 billion, showing slower relative growth compared to other African economies and the ongoing need for economic diversification.
  • This share reflects Nigeria’s relative position in Africa’s economy over time, showing how it moved in relation to the growth of the rest of the continent.

Trade and agriculture led Nigeria’s ₦51.20 trillion economy in Q2 2025, as oil’s share remained modest
  • Trade contributed 18.28%, making it the largest sector in Q2 2025's GDP.
  • Crop production followed with 17.8%, underscoring agriculture’s central role.
  • Oil and gas added just 4.05%, highlighting its shrinking share compared to non-oil sectors.
  • Real estate and telecoms reinforced the growing strength of services in the Nigerian economy.

Nigeria has paid $57.67 billion in external debt interest in 54 years, with payments rising 1,140% since 2009
  • Nigeria spent $57.67B on external debt interest from 1970 to 2023.
  • Payments were low initially but rose steadily as borrowing increased.
  • In the 1990s, interest payments fluctuated due to debt rescheduling and restructuring agreements.
  • In 2005, payments jumped to $5.31B following a strategic debt buyback that accelerated obligations.
  • Annual payments climbed 1,139.6%, from $0.31B to $3.79B, showing rising debt service costs.

Morocco’s GDP per capita has more than doubled since 2000, reaching a new high ($3,993) in 2024
  • Morocco’s GDP per capita has shown a fluctuating pattern in the last 25 years, with periods of steady growth and also fall.
  • The years 2003–2008 stand out as a high-growth phase, with GDP per capita rising rapidly from $1,941.9 to $3,183.2.
  • In 2021, a dramatic 15.9% rebound took GDP per capita up to $3,785.9.
  • In 2024, nominal GDP per capita stood at $3,993.4.
  • The last 25 years depict a more than twofold increase in Morocco’s GDP per capita, moving from $1,499.1 to $3,993.4.

South Africa’s GDP per capita has grown in 21 of the past 24 years, climbing to a record high in 2024
  • South Africa’s GDP per capita rose from $440 in 2000 to an all-time high of $2,692 in 2024.
  • Growth was relatively steady in the 2000s, with notable jumps after 2006 and again in the post-pandemic years.
  • Despite dips in 2008 (global financial crisis) and 2020 (COVID-19 shock), the economy showed resilience with quick rebounds.
  • By 2024, South Africa achieved its strongest per capita GDP on record, cementing its role as one of Africa’s leading middle-income economies.
  • The country recorded growth in 21 of the past 24 years.

Algeria’s GDP per capita has risen four straight years since 2020, edging closer to its 2014 oil-driven peak
  • Algeria’s GDP per capita more than tripled in 25 years, rising from $1,772.9 in 2000 to $5,631.2 in 2024.
  • The 2000s boom saw rapid growth, peaking at $5,180.9 in 2008, fuelled by high oil and gas prices.
  • Between 2014 and 2016, GDP per capita fell from $6,094.7 to $4,425.0, reflecting oil price collapses and domestic fiscal strain.
  • After pandemic-era lows in 2020 ($3,743.5), Algeria rebounded to its second-highest level on record in 2024 ($5,631.2), regaining its regional standing.

POPULAR TOPICS
SIGN UP TO OUR NEWSLETTER
Get periodic updates about the African startup space, access to our reports, among others.
Subscribe Here
Subscription Form

A product of Techpoint Africa. All rights reserved