Nigeria's capital expenditure as a percentage of GDP dropped from an average of 4.33% (1981–2001) to just 1.58% (2002–2024)

Key takeaways:

  • From an average of 4.33% in 1981–2001 to just 1.58% in 2002–2024, Nigeria’s capital expenditure as a percentage of GDP has more than halved.
  • The early 2000s marked a major turning point. After peaking at 9.1% in 1999, capital spending nosedived, rarely surpassing 2% in the last two decades.
  • Recent figures show Nigeria’s capital expenditure hovering around 1–2% of GDP.
  • The data suggests a move away from infrastructure investments, potentially prioritising recurrent expenditure such as salaries and overheads.
  • Low capital spending can slow infrastructure development, limiting productivity, economic expansion, and foreign investment attractiveness.
  • If Nigeria is to achieve sustainable growth, there needs to be a renewed focus on capital investments to drive industrialisation, improve public services, and create jobs.

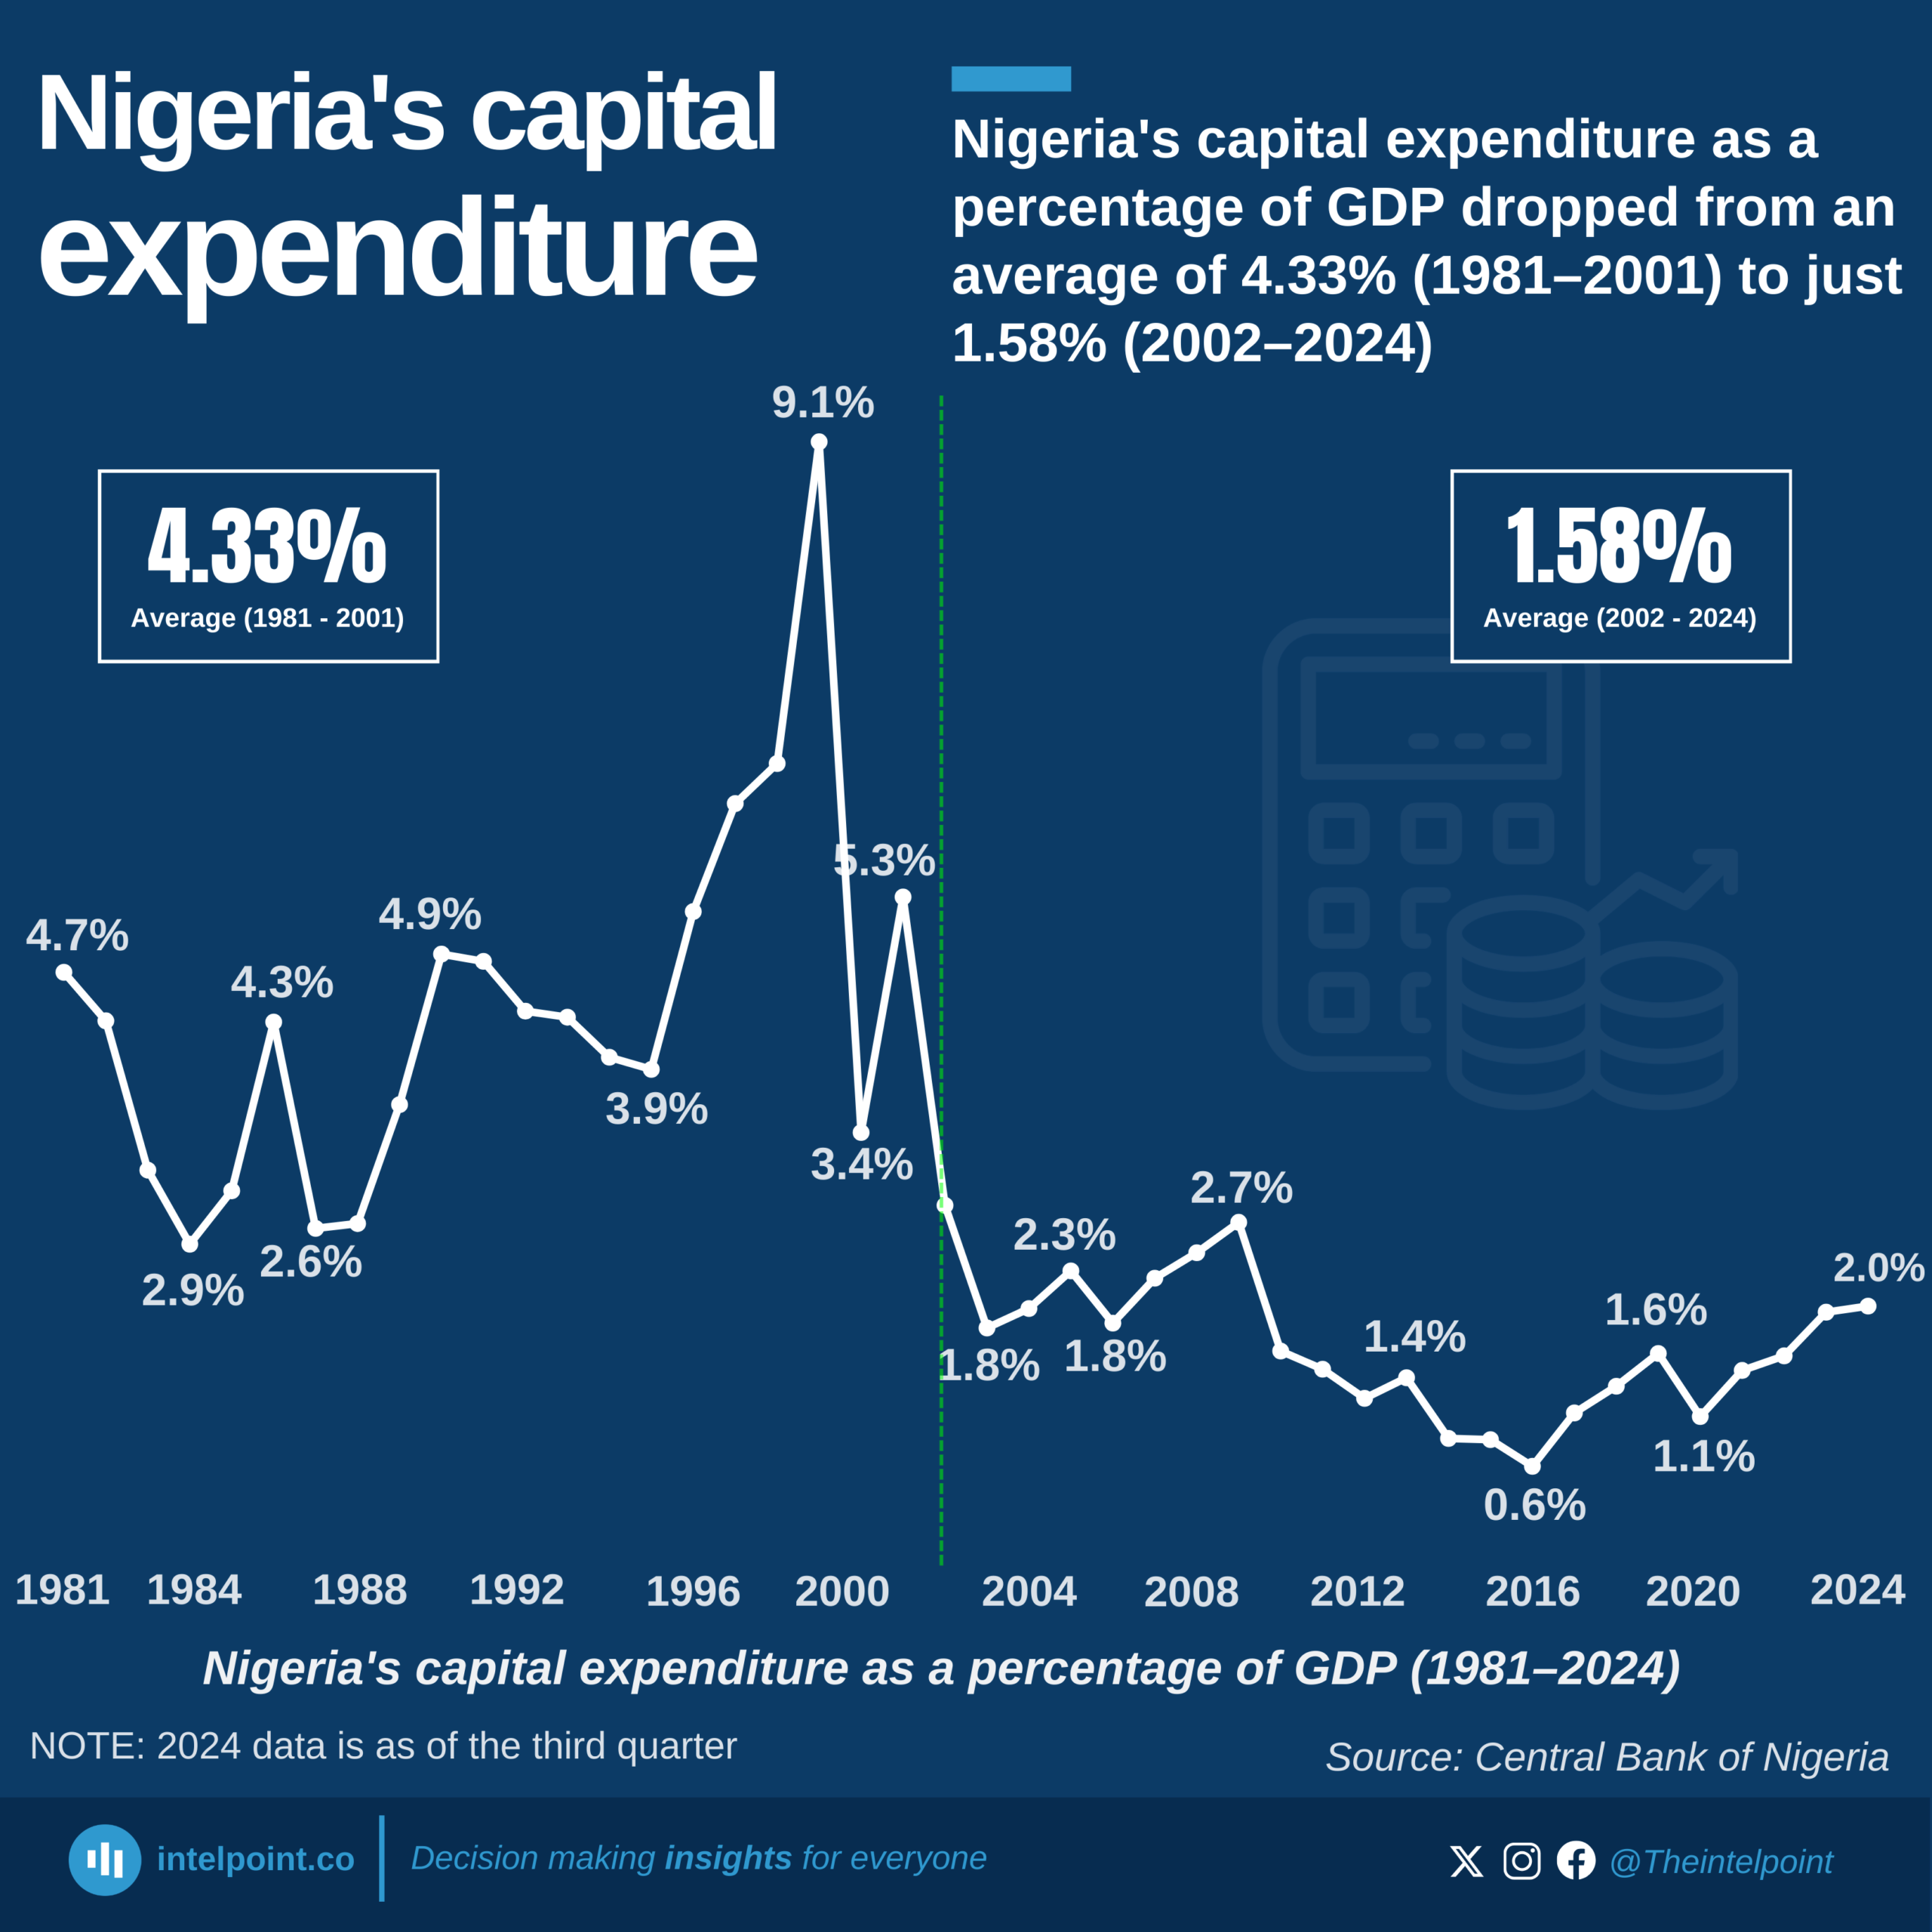
Nigeria’s capital expenditure as a percentage of GDP has seen a significant decline over the past two decades, dropping from an average of 4.33% (1981–2001) to just 1.58% (2002–2024). The data reveals a clear shift in government spending priorities, with capital investments taking a backseat despite the country’s growing infrastructure and development needs.
This drop is even more concerning when compared to historical peaks. Capital spending once hit 9.1% of GDP in 1999, but in recent years, it has struggled to cross 2%. The decline suggests that while Nigeria’s economy has expanded, public investments in critical infrastructure like roads, power, and healthcare have not kept pace. This raises crucial questions about the sustainability of economic growth in the absence of strong public sector investment.

Source:

Central Bank of Nigeria (CBN)

Period:

1981 - 2024
HTML code to embed chart
Want a bespoke report?
Reach out
Tags
Related Insights

Local companies have consistently contributed most of Nigeria’s Company Income Tax payments since 2016
  • Local companies dominated CIT contributions in most years, accounting for over 50% of payments in 9 of 11 periods between 2015 and 2025 (Q1–Q3).
  • Foreign companies briefly closed the gap in 2023, contributing 49%, the closest they have come to matching local firms.p
  • Local companies recorded their strongest share in 2021 at 65%, marking the widest gap between local and foreign contributors.
  • “Other payments” peaked during the pandemic, rising to 17% in 2020 before dropping to 0% from 2022 onward.

Nigeria is Africa’s fastest country to attain $100bn GDP, reaching the mark in a record 34 years
  • Nigeria is the fastest to reach $100B — 34 years, achieving the milestone in 1994.
  • Ethiopia took the longest — 81 years, reaching the mark in 2022 after decades of gradual expansion.
  • Resource-driven economies reached the threshold faster, including Angola (36 years) and Algeria (43 years).
  • North African economies crossed earlier, with Egypt (1989) and Morocco (2008) benefiting from diversified economic bases.
  • South Africa reached $100B as early as 1988, reflecting its long-standing industrial and financial depth.
  • Ghana is among the slowest climbers (68 years), but its recent 2025 milestone shows the impact of sustained reforms and growth.
  • Speed varies widely (34 to 81 years), showing that growth paths across Africa are shaped by very different economic realities.

Lagos and Rivers stand as Nigeria’s most self-financing states
  • Rivers, Lagos, and Ogun lead the ranking, covering most operating costs from their own revenue.
  • Jigawa, Bayelsa, and Yobe are the most dependent on federal allocations, with internal revenue covering only a fraction of expenses.
  • Higher-ranked states demonstrate stronger economic resilience and better domestic revenue mobilisation.
  • Lower-ranked states need to grow internal revenue or reduce operating expenses to improve financial self-sufficiency.

The Nigerian Army commands over half of Nigeria’s proposed 2026 defence budget, more than every other force combined
  • The Army has been allocated ₦1.50tn, more than half of the top-ten defence allocations, making it the backbone of Nigeria’s security spending.
  • The Navy (₦443.9bn) and Air Force (₦407.2bn) come next, but together they are far behind the Army.
  • Institutions like the Defence Intelligence Agency, Training and Doctrine Command, and Defence Missions receive meaningful but much smaller funding, reinforcing their support-role status.
  • The Defence Space Administration (₦37.3bn) is on the table, but its small size shows Nigeria is only cautiously stepping into cyber- and space-based security.

Finance, budget, and economic planning ministries command half of Nigeria’s 2026 top allocations
  • The Federal Ministry of Finance dominates with ₦16.78 trillion, accounting for nearly ₦1 in every ₦3 spent among the top ministries.
  • Combined, the ministries of Finance and Budget & Economic Planning control more than 50% of the listed allocations, underscoring the government’s focus on fiscal strategy and economic agenda.
  • The Works and Defence sectors rank third and fourth, reflecting continuous prioritisation of infrastructure development and national security.
  • Education and Health, while critical, receive smaller shares, signalling potential pressure points in human capital development funding

Mauritius ranks 15th globally, securing the number-one spot in Africa on the economic freedom index
  • Mauritius is the continent’s strongest performer by a wide margin, leading with a score of 75, and ranking 15th globally.
  • Botswana and Cape Verde are the only other African countries with a score close to 70, placing them within the global top 40.
  • Most of Africa’s top 15 countries score between 56 and 60, indicating moderate levels of economic freedom.
  • Even Africa’s highest performers trail global leaders, showing persistent gaps in rule of law, regulatory efficiency, and open-market conditions.

POPULAR TOPICS
SIGN UP TO OUR NEWSLETTER
Get periodic updates about the African startup space, access to our reports, among others.
Subscribe Here
Subscription Form

A product of Techpoint Africa. All rights reserved