Nigeria has witnessed a substantial decline in cash transactions, dropping from 91% of total transactions to 55% over the span of four years

Key takeaways:

  • Among all the 40 countries studied in the report, Nigeria leads the decline in cash transactions, dropping from 91% in 2019 to 55% in 2023, a sharper decline than any other country analysed.
  • By 2027, Nigeria’s cash transactions are projected to fall to 42%.
  • Mexico, Thailand, and Japan are also experiencing significant declines, with cash transactions expected to drop below 35% in all three countries by 2027.
  • Brazil, which started with a relatively lower cash transaction rate (48% in 2019), is on track to become one of the least cash-dependent nations in this group, with just 12% of transactions expected to be cash-based by 2027.
  • The global average for cash transactions was already low at 26% in 2019, and it is set to decline further to just 11% by 2027, making cash an increasingly rare payment method worldwide.
  • Germany, a traditionally cash-friendly economy, has seen a major drop, with cash transactions decreasing from 50% in 2019 to a projected 29% by 2027, reflecting broader changes in consumer behavior.

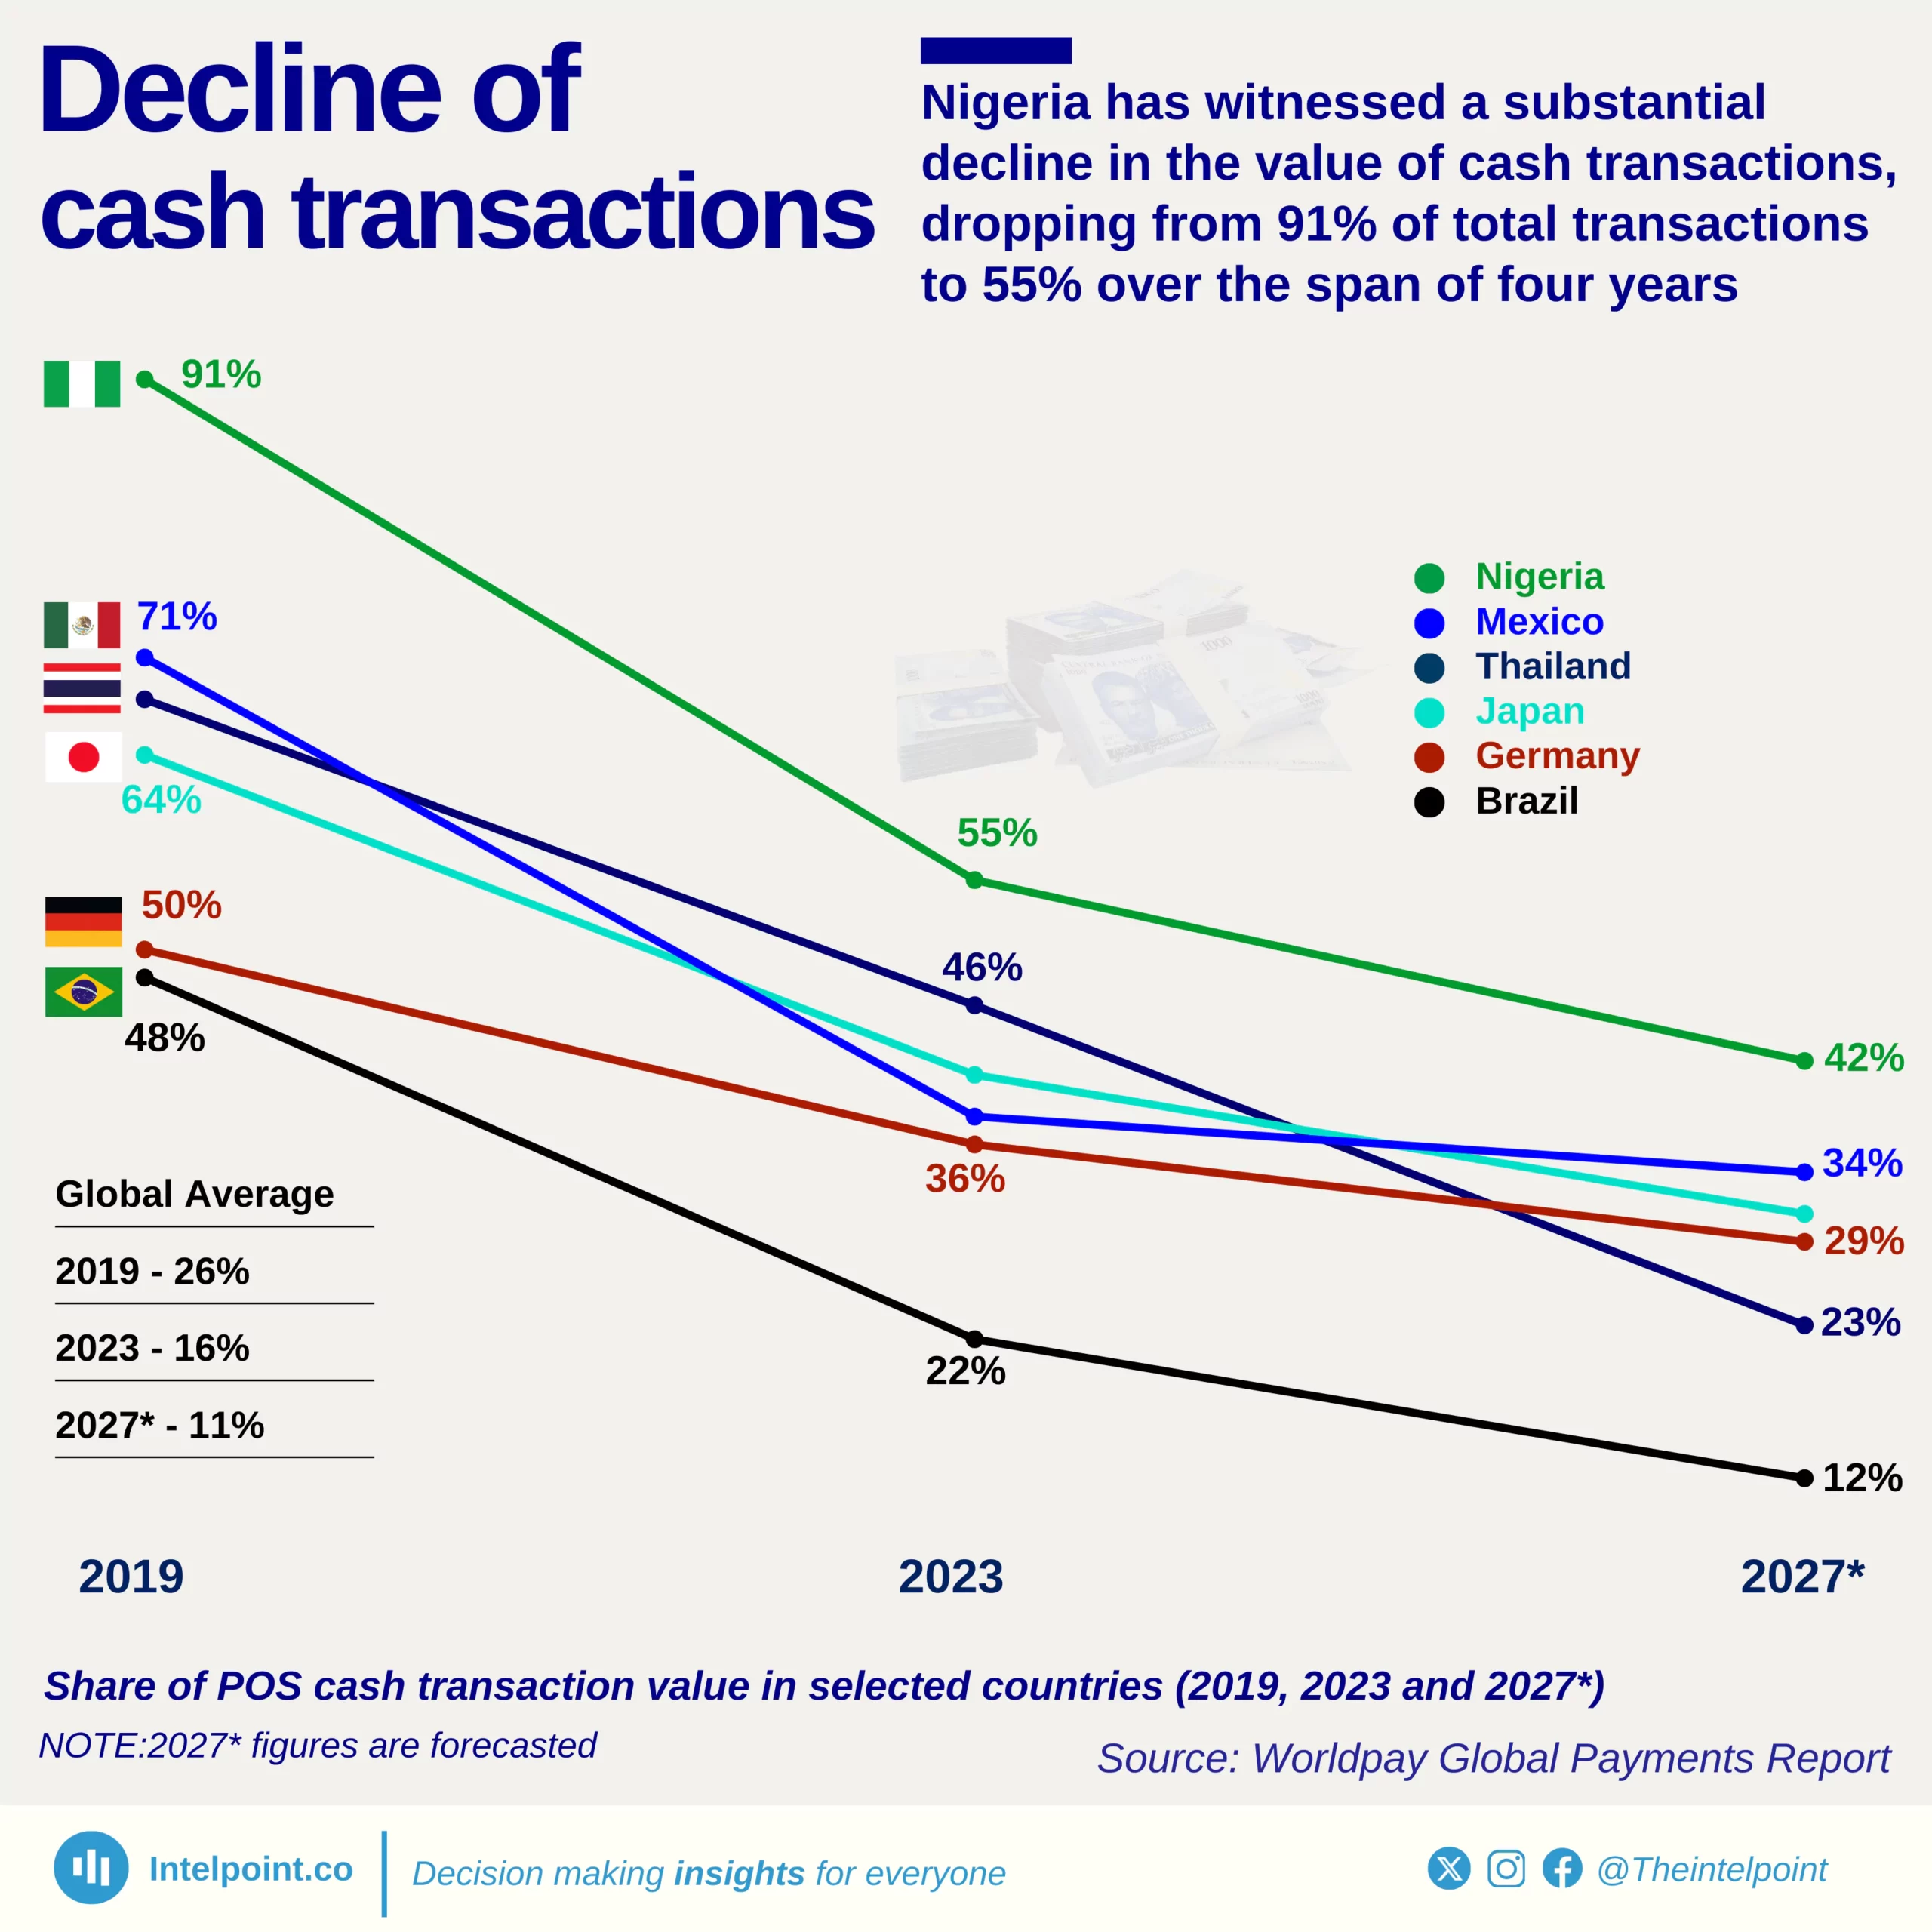
The way people make payments is changing globally, and Nigeria is not left out. In just four years, Nigeria’s cash transactions have plunged from 91% of total transaction value in 2019 to 55% in 2023. This drastic decline highlights the rapid adoption of digital payments, mobile banking, and fintech solutions in the country. By 2027, the value of cash transactions is projected to shrink even further to 42%, signaling a trend toward a cashless economy.
This shift isn’t just happening in Nigeria. Countries like Mexico, Thailand, Japan, Germany, and Brazil are also experiencing a steady drop in cash usage. While the global average of cash transactions was 26% in 2019, it fell to 16% by 2023 and is forecasted to reach just 11% by 2027. The numbers tell a compelling story – the world is moving away from physical cash, and businesses, financial institutions, and individuals must adapt to stay ahead.

Source:

Worldpay Global Payments Report

Period:

2019, 2023, 2027
HTML code to embed chart
Want a bespoke report?
Reach out
Tags
Related Insights

Total microfinance deposits in Kenya only grew 1.66% CAGR over 10 years, ending at KSh 43.0B
  • Microfinance deposits in Kenya grew at only 1.66% CAGR between 2014 and 2024.
  • The peak occurred in 2021 at KSh 50.2B, after which deposits began a steady decline.
  • 2015 (+13.2%) and 2020 (+12.3%) posted the strongest year-on-year growth rates.
  • The sector saw consecutive contractions from 2022 (-7.3%), 2023 (-5.7%), to 2024 (-2.0%).
  • Despite small rebounds in 2018 (+7.3%) and 2019 (+12.3%), the long-term trend is weak.

Microfinance banks in Kenya have consistently posted losses since 2016, reaching KSh -3.5B in 2024
  • Microfinance banks in Kenya recorded their last profit in 2015 (KSh 0.6B) before sliding into losses.
  • The sector’s losses deepened from KSh -0.4B in 2016 to KSh -3.5B in 2024.
  • The steepest single-year decline occurred in 2020, when losses increased by 560.8% to KSh -2.2B.
  • Even in recovery years like 2019 (KSh -0.3B) and 2021 (KSh -0.7B), the sector remained in losses.
  • Over the 10 years, profitability fell at a -212.1% CAGR, reflecting a structural collapse.
  • Since 2016, there has been no single year of profit, highlighting sustained weakness.
  • The worsening losses mirror other sector struggles, such as stagnant deposits, weak asset growth, and rising NPLs.

Kenya’s microfinance banks’ total assets over the years have ranged from KSh 57.0B to KSh 76.4B (2014–2024), standing at KSh 57.9B in 2024
  • Kenya’s microfinance assets grew by just 1.62% between 2014 and 2024.
  • The sector peaked in 2019 at KSh 76.4B, before entering a steady decline.
  • 2023 (-8.8%) and 2024 (-9.8%) posted the steepest year-on-year declines.
  • The sector recorded only two notable growth spikes: 2015 (+21.9%) and 2019 (+7.9%).
  • Overall, the trend from 2020 onward shows persistent contraction in asset value.

After a huge 57.7% drop in 2020, profits in Kenya’s insurance sector have seen a consistent increase
  • Kenya’s insurance sector PAT grew by 143% between 2017 and 2024.
  • The lowest point came in 2020, with profits dropping 57.7% to KSh 6.4B.
  • A sharp rebound followed, with profits rising steadily each year from 2021 to 2024.
  • The strongest yearly growth was in 2019, with a 108% surge in profits.
  • By 2024, PAT stood at KSh 33.1B, the highest in the seven-year period.
  • Profits more than quadrupled from 2020 (KSh 6.4B) to 2024 (KSh 33.1B).

Gross premium income for Kenyan insurers posted an 89.1% growth between 2017 and 2024
  • Gross premium income in Kenya’s insurance sector grew by 89.1% between 2017 and 2024.
  • Premiums rose from KSh 209.0B in 2017 to KSh 395.3B in 2024.
  • The most substantial annual growth occurred in 2023 at 17.6%.
  • 2021 also recorded a significant rise of 16.6% growth.
  • The slowest growth was observed in 2020, at just 2.3%, likely reflecting the impact of the pandemic.
  • Despite fluctuations, the sector has maintained an upward growth trajectory across the 7 years.

Kenya's insurance sector assets doubled from KSh 591B to KSh 1.2T in seven years
  • Kenya’s insurance assets more than doubled in seven years, from KSh 591B in 2017 to KSh 1.2T in 2024.
  • This represents a 109.4% growth over the period.
  • The sector recorded positive growth every single year, with no declines.
  • The most substantial growth occurred in 2024, at 17%.
  • Asset growth averaged between 7.5% and 12.5% annually until the surge in 2024.
  • 2023 marked the first time assets crossed the KSh 1 trillion mark.

POPULAR TOPICS
SIGN UP TO OUR NEWSLETTER
Get periodic updates about the African startup space, access to our reports, among others.
Subscribe Here
Subscription Form

A product of Techpoint Africa. All rights reserved