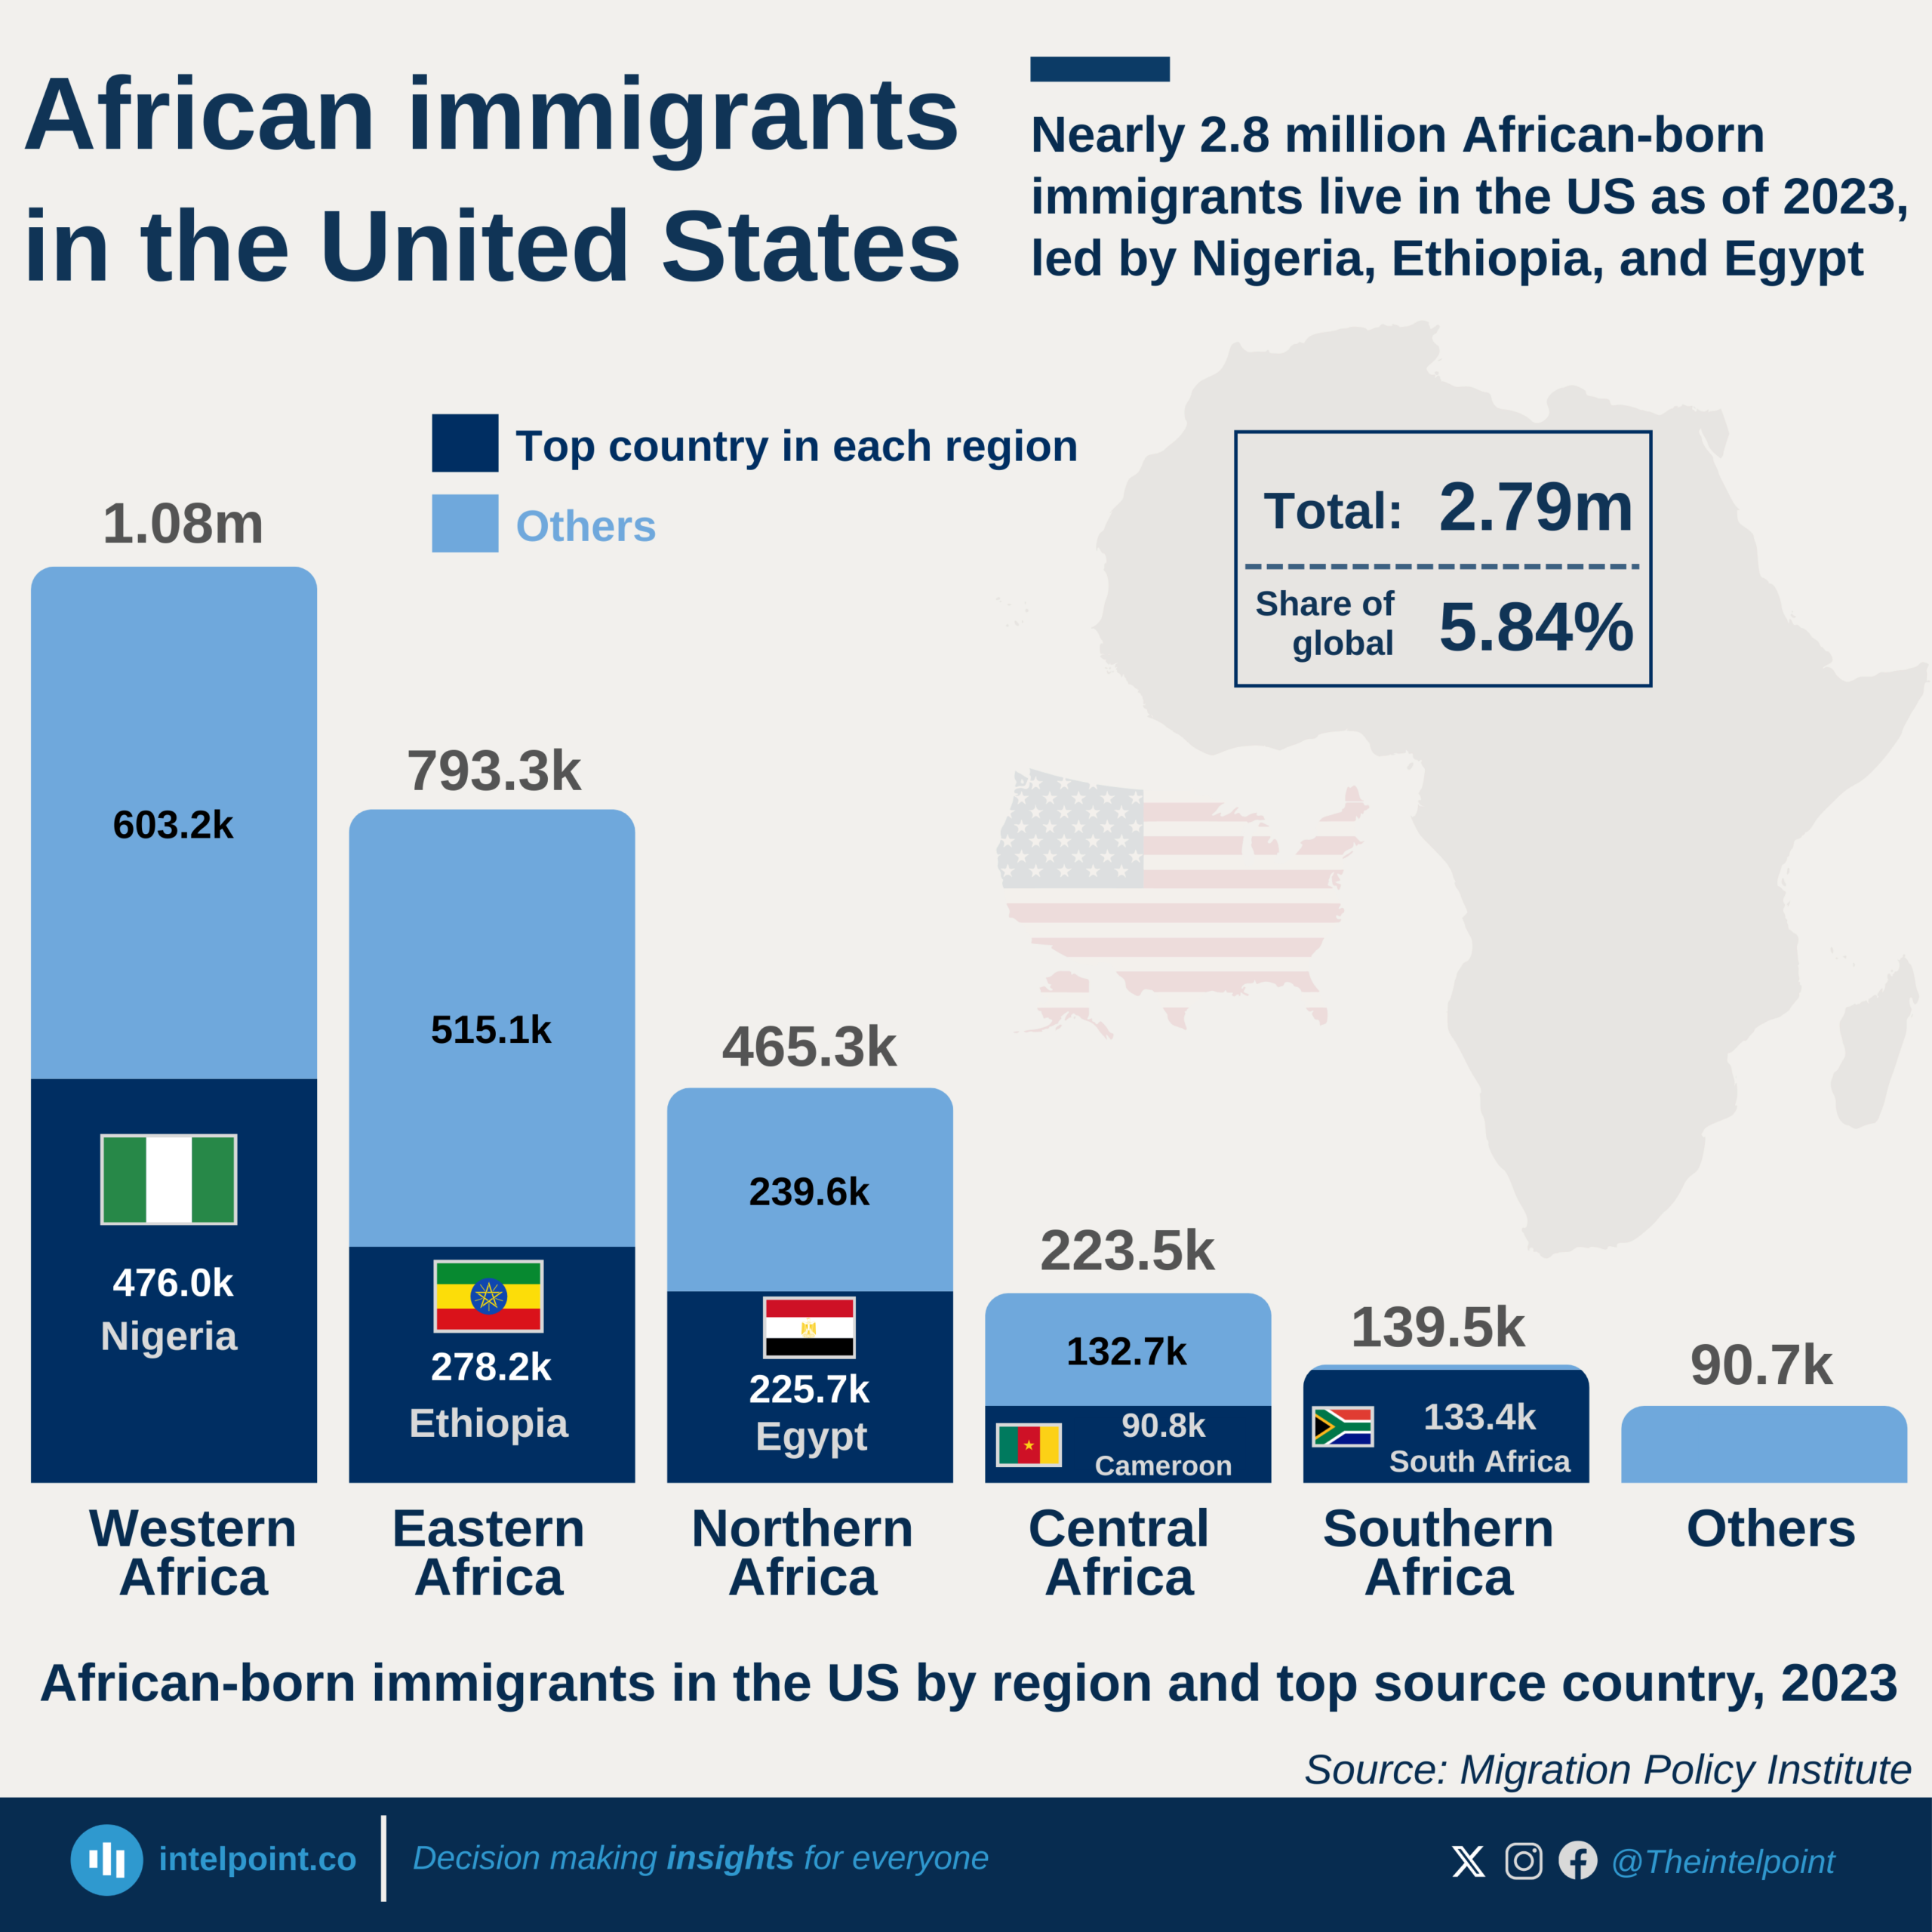
Nearly 2.8 million African-born immigrants live in the US as of 2023, led by Nigeria, Ethiopia, and Egypt

  • In 2023, the total number of African-born immigrants in the US was about 2.79 million.
  • Western Africa is the largest source region, contributing 1.08 million immigrants (39%), led by Nigeria (476k).
  • Eastern Africa is the second-largest source (28%), dominated by Ethiopia (278.2k).
  • Northern Africa accounts for 17%, mainly from Egypt (225.7k).
  • Central Africa contributes 8%, with Cameroon (90.7k) as the top country.
  • Southern Africa is smaller at 5%, almost entirely from South Africa (133.4k).
  • Five countries—Nigeria, Ethiopia, Egypt, Cameroon, and South Africa—together make up nearly half of all African-born immigrants in the US.

African migration to the United States has expanded rapidly in recent decades, with 2.79 million African-born immigrants recorded in 2023.

The distribution of African immigrants is far from even across the continent. Western Africa stands out as the leading region of origin, contributing more than 1.08 million immigrants, or nearly 39% of the total African-born population in the US. Within this region, Nigeria dominates with 476k immigrants, making it the single largest African source country. Eastern Africa follows with 28%, led by Ethiopia’s 278k immigrants, the second-largest group overall.

Northern Africa contributes 17%, anchored by Egypt with nearly 226k people, while Central Africa adds 8%, with Cameroon’s 90.7k representing a large share. Southern Africa is smaller at 5%, but highly concentrated: South Africa alone accounts for 133.4k out of 139.5k. An additional 90.7k people were recorded under Africa not elsewhere classified.

For the most part, just five countries, Nigeria, Ethiopia, Egypt, Cameroon, and South Africa, account for nearly half of all African-born immigrants in the US, reflecting both the diversity of African migration and the outsized role of a few nations.
Source:

Migration Policy Institute

Period:

2023
HTML code to embed chart
Want a bespoke report?
Reach out
Tags
Related Insights

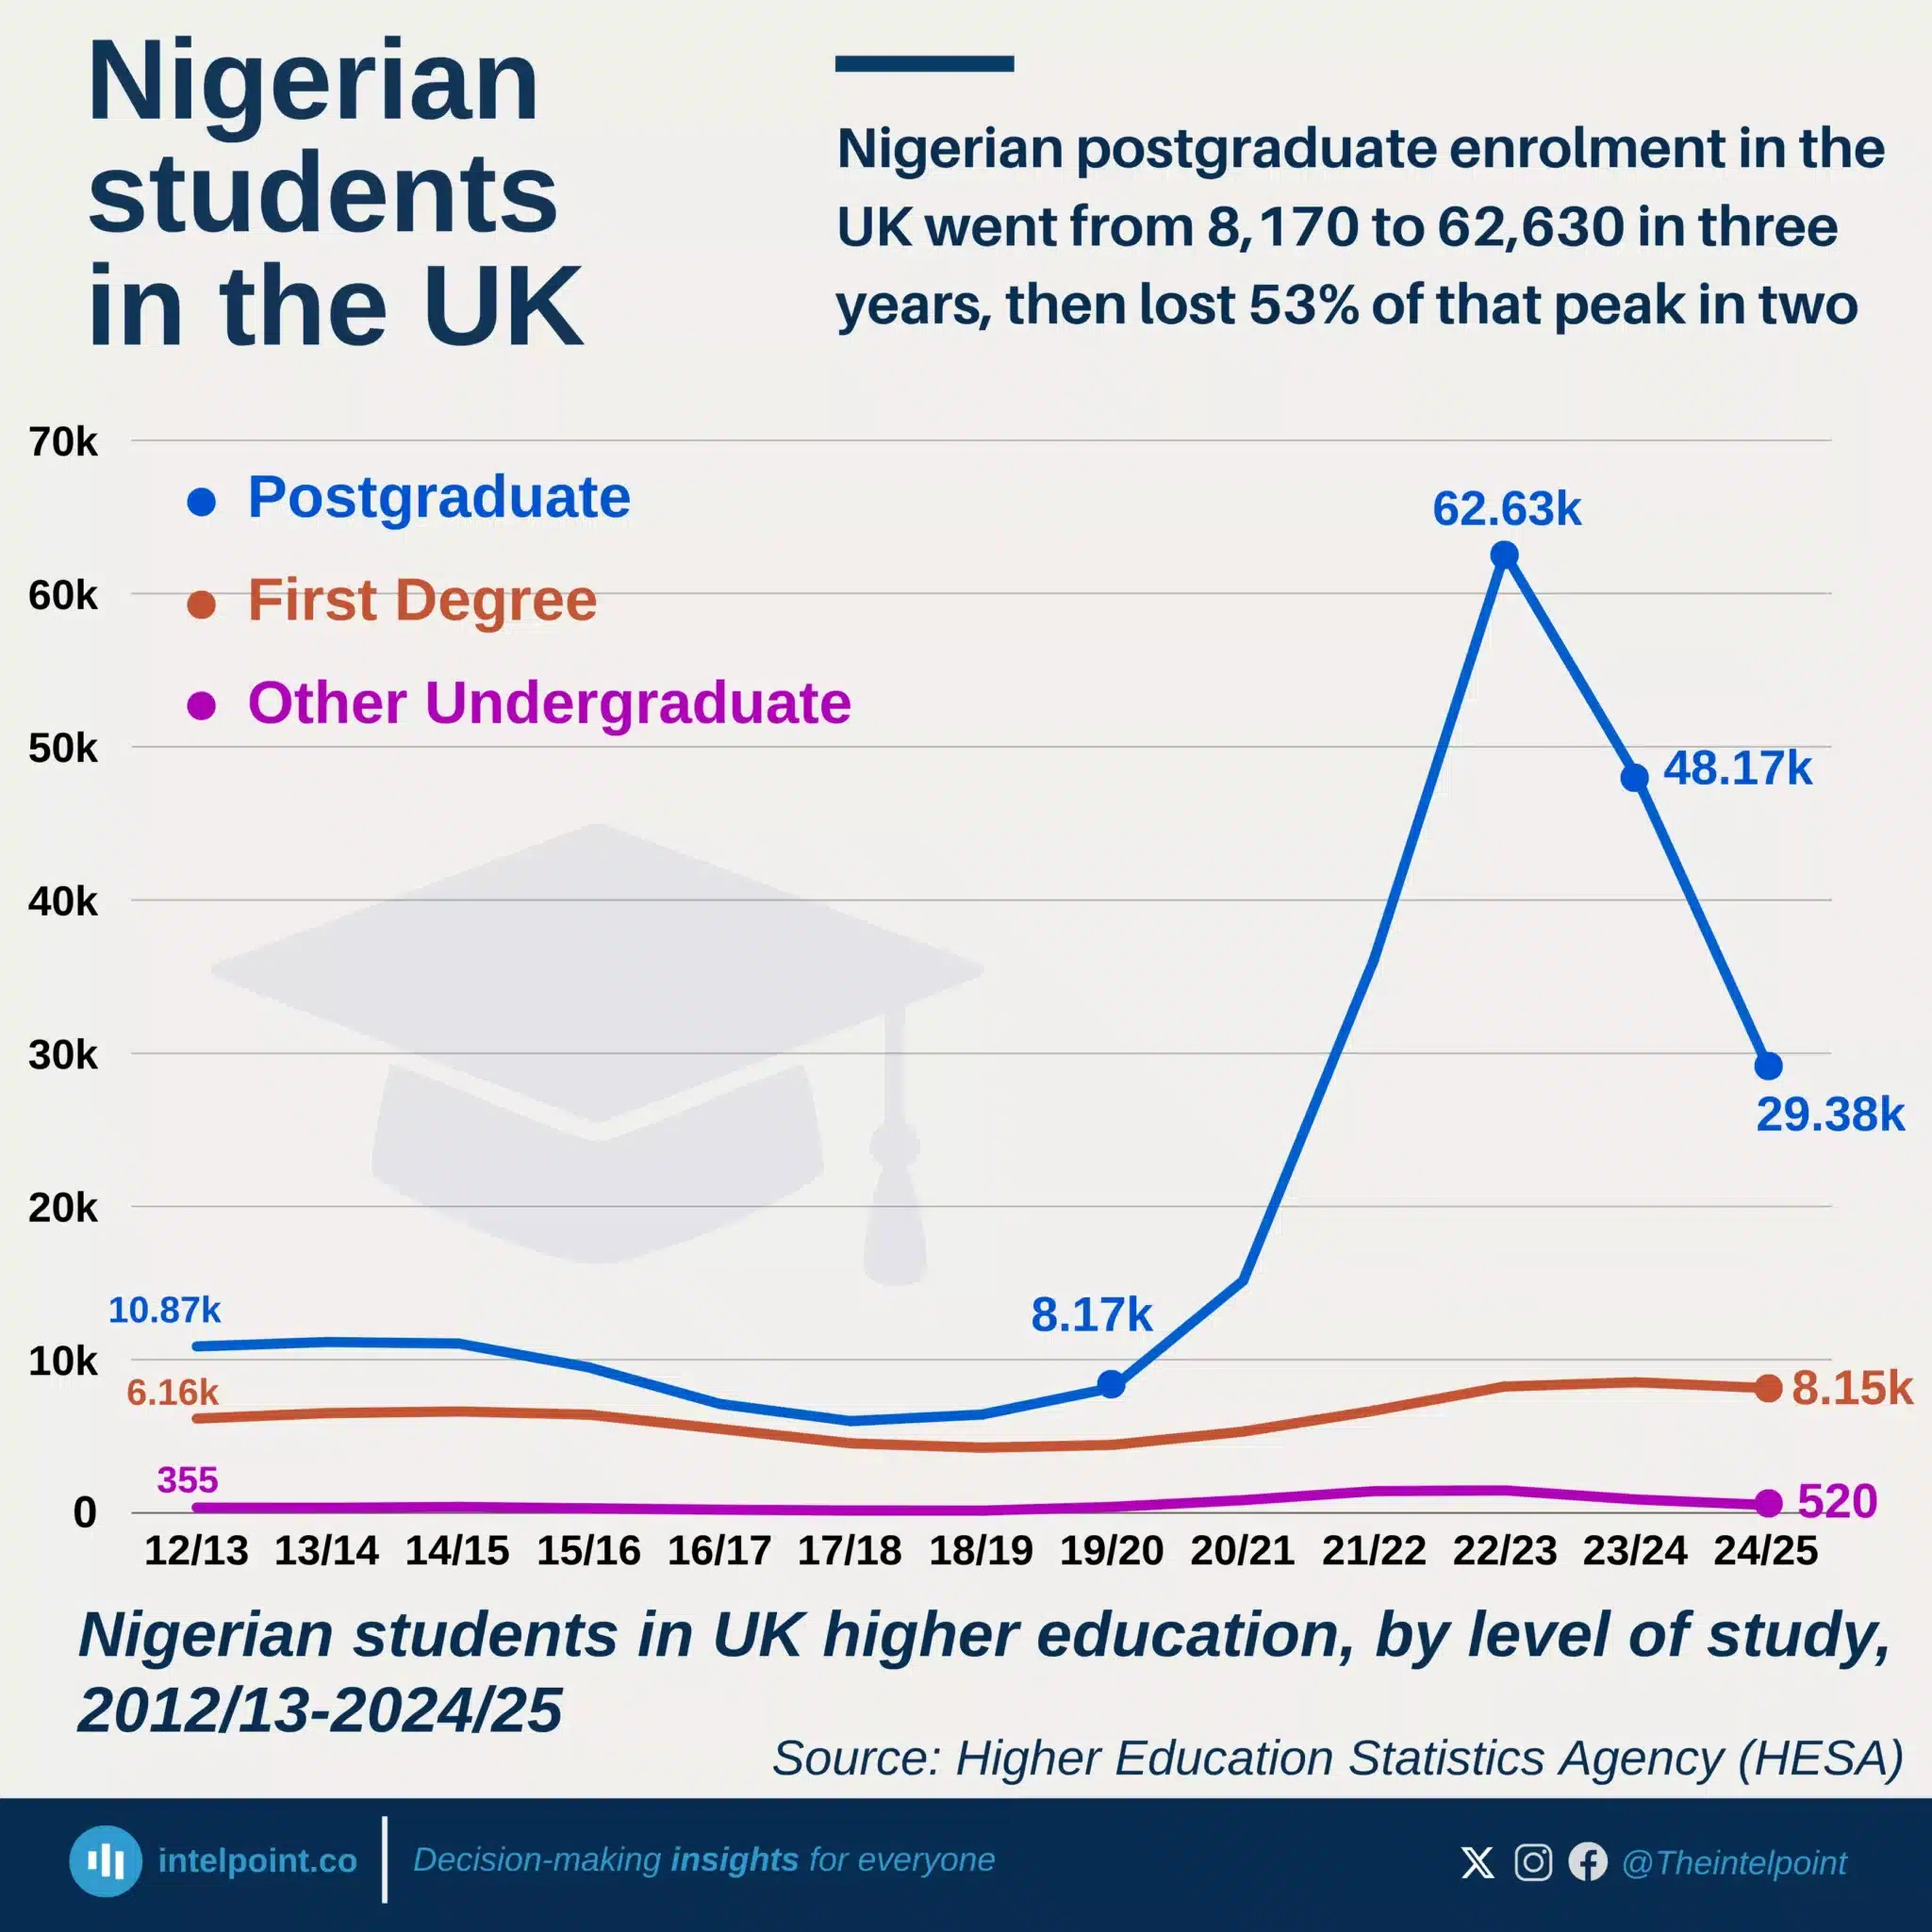
Nigerian postgraduate enrolment in the UK went from 8,170 to 62,630 in three years, then lost 53% of that peak in two
  • Postgraduate enrolment fell by 19,540 in one year, accounting for 96% of Nigeria’s total decline.
  • Nigerian postgraduate enrolment remained 3.6 times its 2019/20 level despite the recent decline.
  • Nigeria fell from third to fourth among the UK’s largest sources of international students.
  • Nepal nearly doubled its enrolment to 24,435, moving from eighth to fifth.

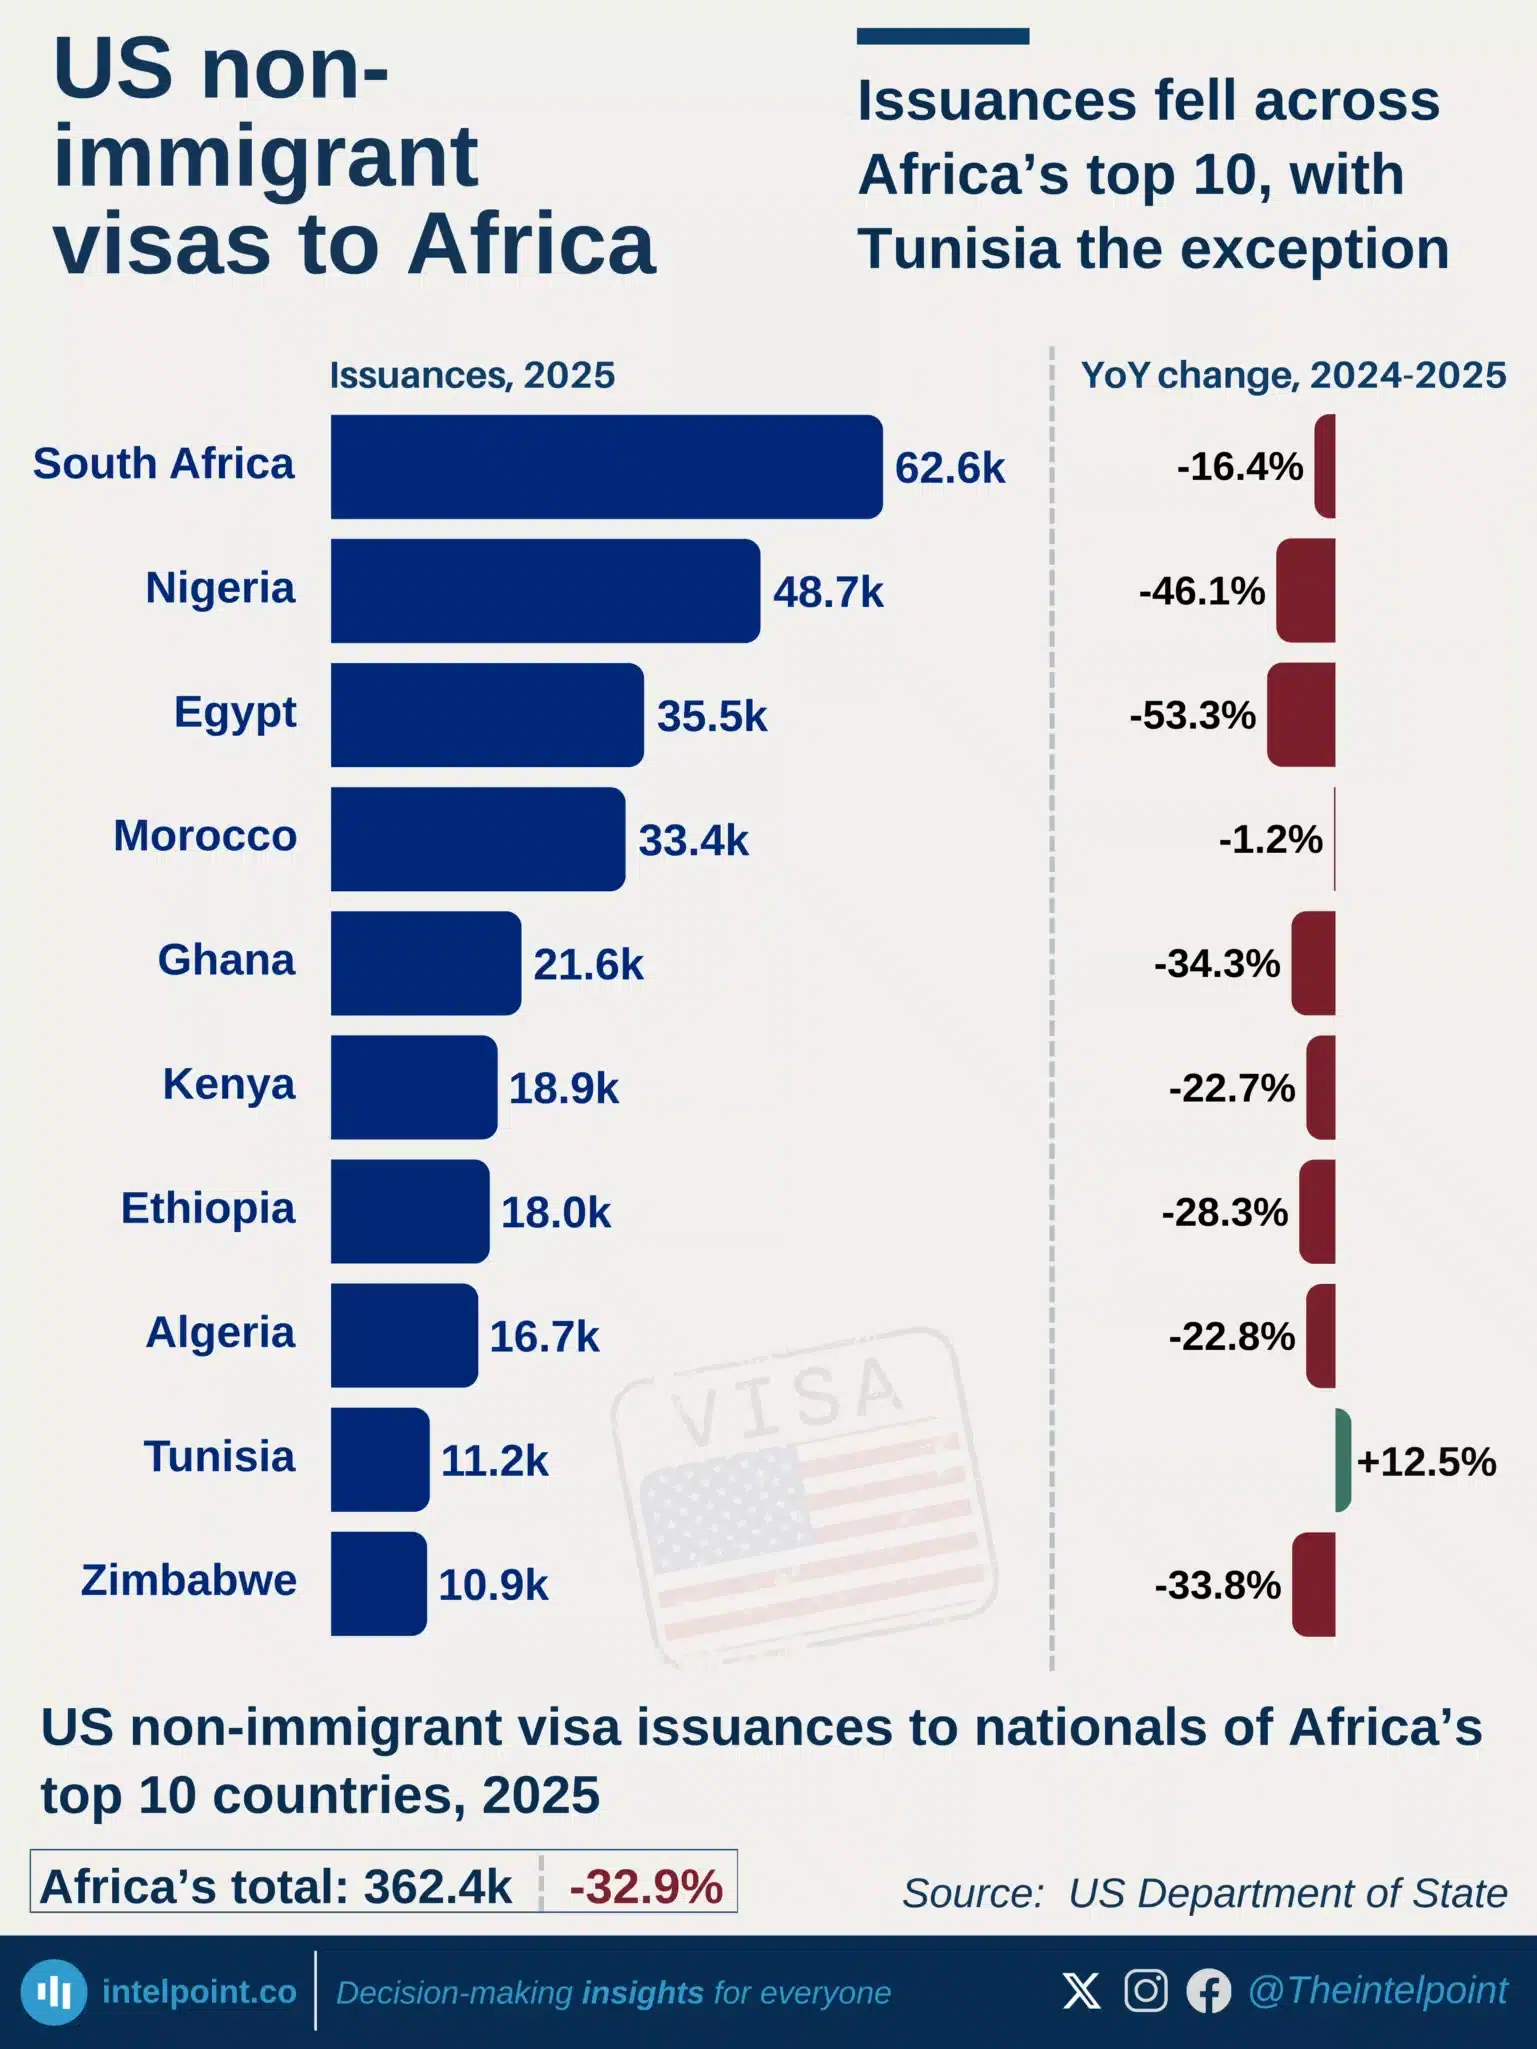
US non-immigrant visas to Africa: issuances fell across Africa’s top 10, with Tunisia the exception
  • South Africa overtook Nigeria as Africa’s largest source of US non-immigrant visa issuances in 2025, with 62,647 visas.
  • Nigeria’s issuances fell 46.1% to 48,669, down from 90,344 in 2024.
  • US non-immigrant visa issuances to African nationals fell 32.9%, from 539,800 to 362,431.
  • Only three African nationalities recorded increases: Tunisia (+12.5%), Guinea (+12.0%) and Eswatini (+3.2%).

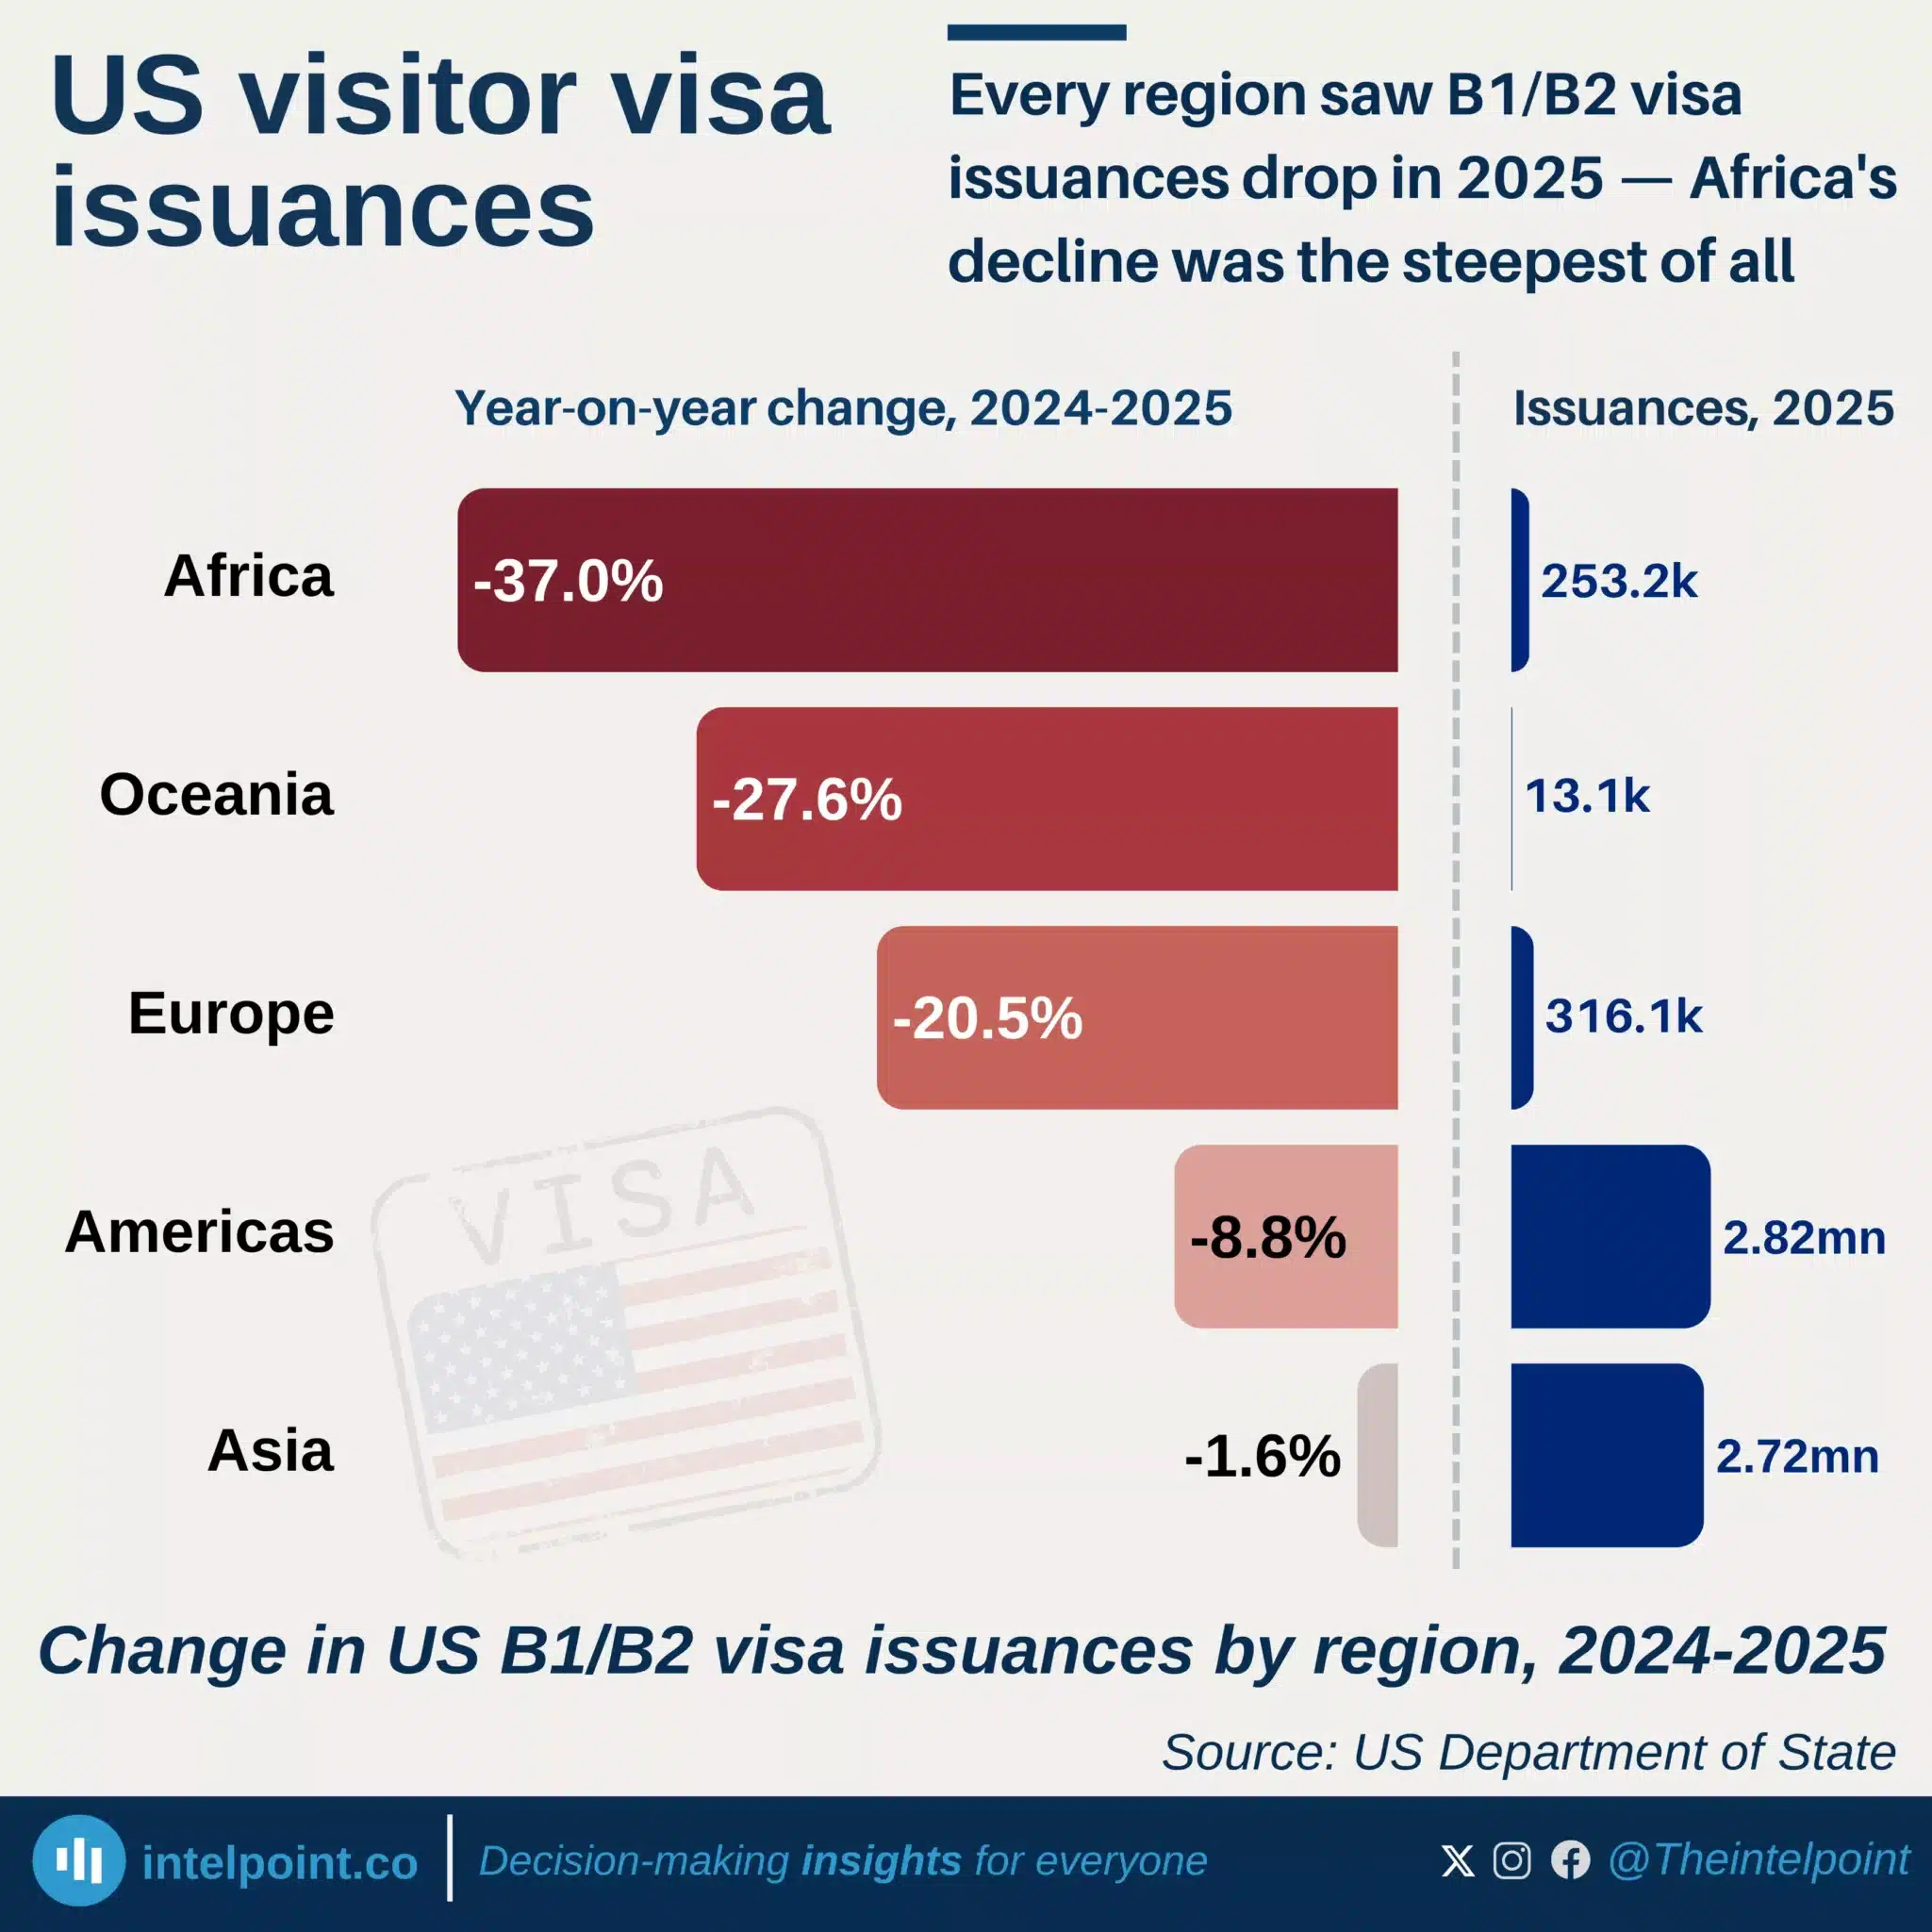
Every region saw B1/B2 visa issuances drop in 2025 — Africa's decline was the steepest of all
  • Africa’s US visa issuances fell 37% in 2025, from 401.8k to 253.2k.
  • Egypt and Nigeria accounted for more than half of Africa’s 148.6k decline.
  • B1/B2 visas accounted for 84% of Africa’s overall decline in issuances.
  • Africa’s decline was significantly steeper than the 20.5% drop recorded in Europe.

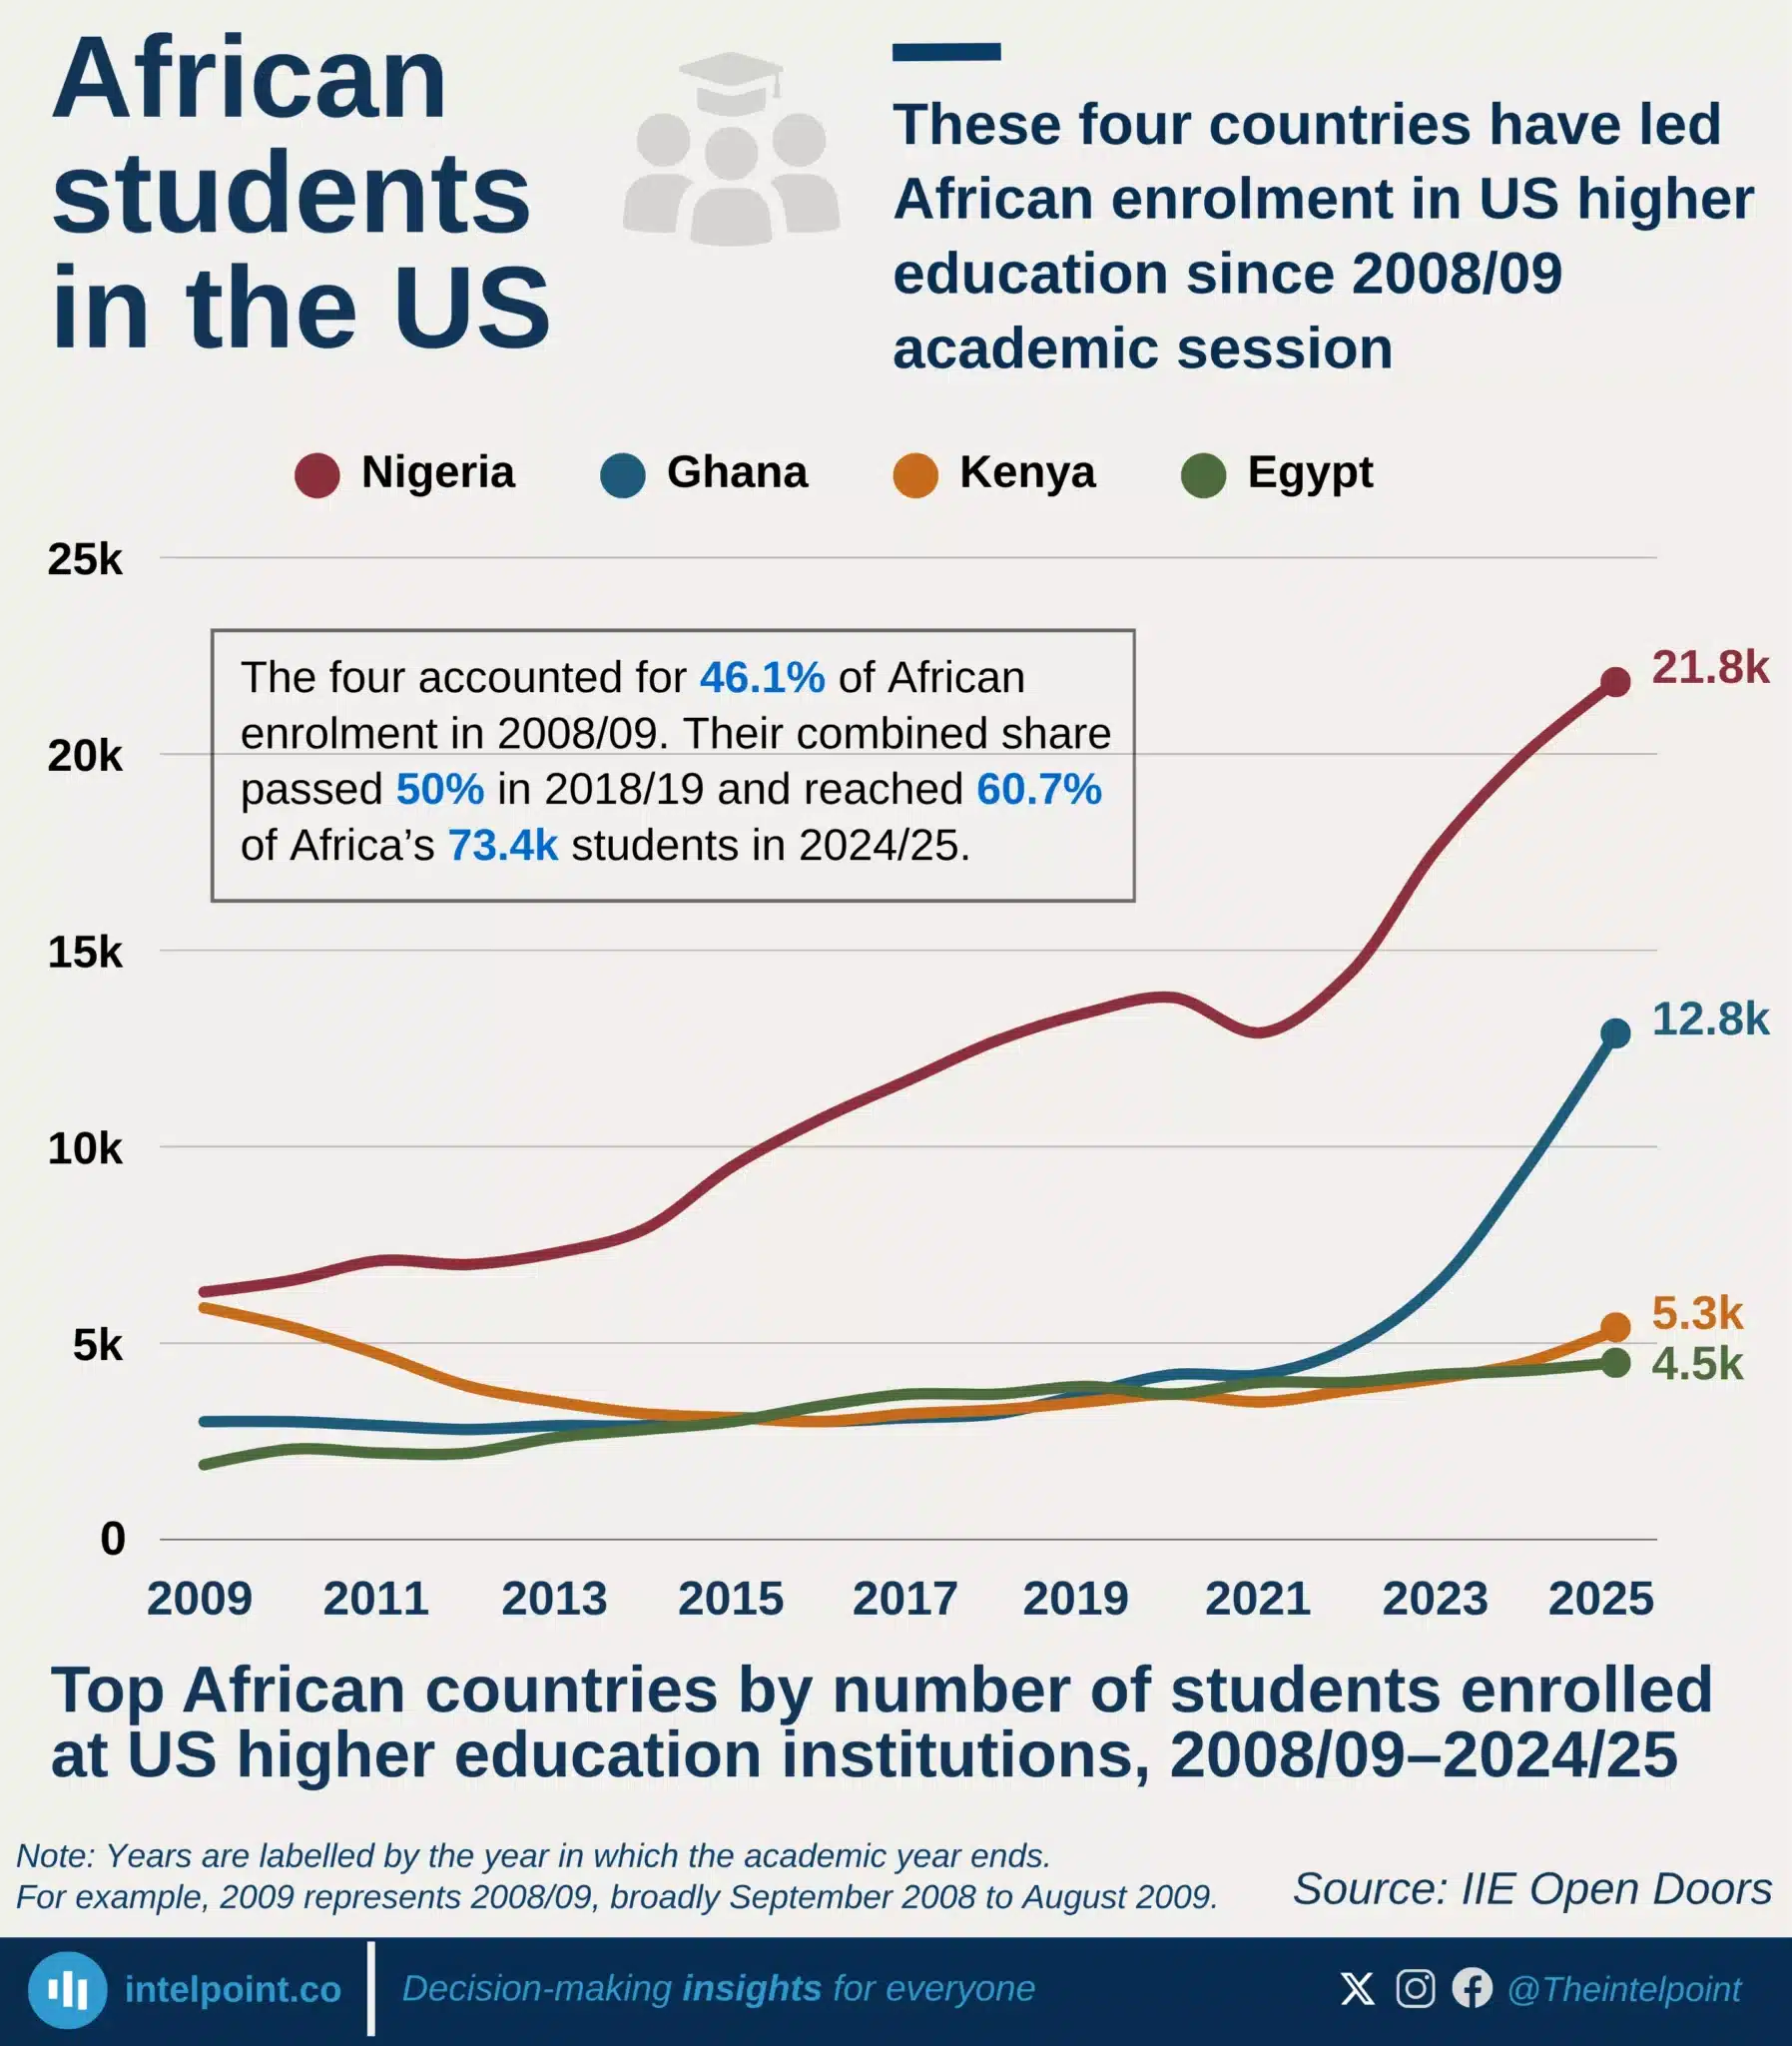
These four countries have led African enrolment in US higher education since 2008/09 academic session
  • Ghana recorded the most striking recent growth, reaching 12,825 students in 2024/25.
  • Nigeria remained Africa’s leader with 21,847 students.
  • Nigeria, Ghana, Kenya and Egypt have held the top four positions since 2008/09.
  • Their combined share of African enrolment increased from 46.1% to 60.7%.
  • Africa had 73,406 students enrolled in US higher education in 2024/25.

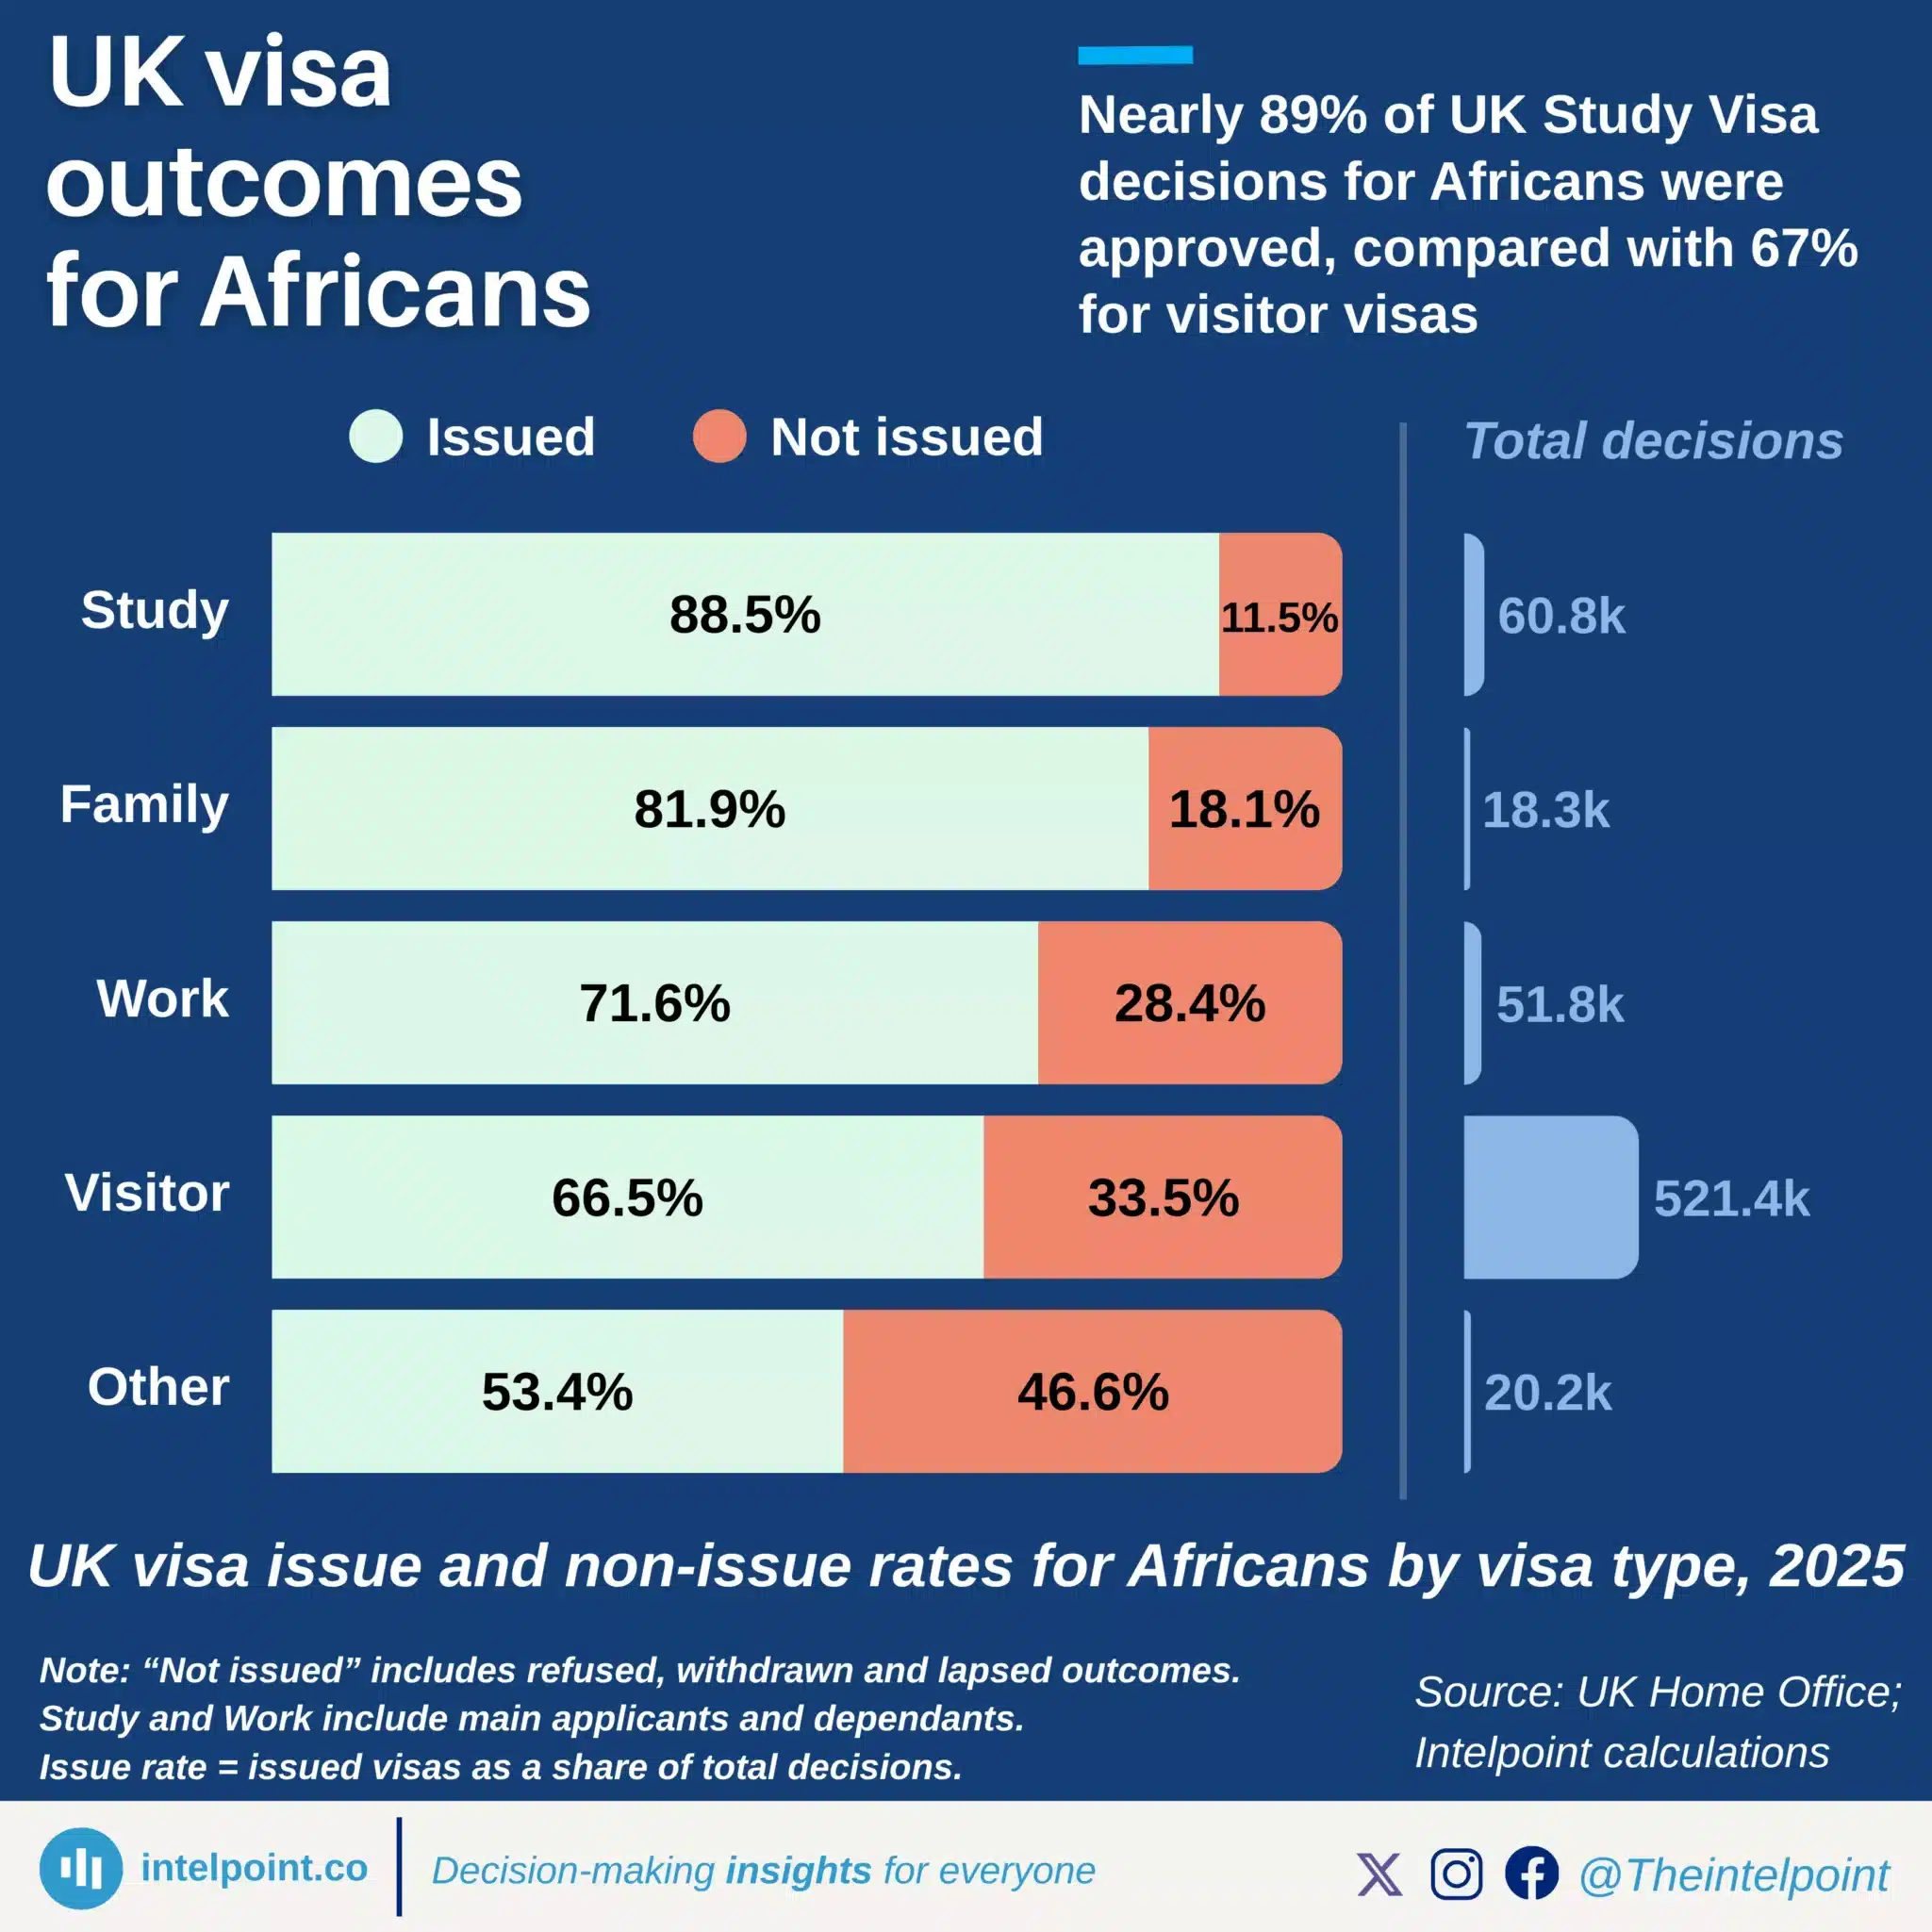
Nearly 89% of UK Study Visa decisions for Africans were approved, compared with 67% for visitor visas
  • The UK made 672,400 visa decisions involving African applicants in 2025.
  • Visitor visas dominated the decisions, accounting for 521,400, or about 78% of the total.
  • Study visas had the highest issue rate, with 88.5% of decisions resulting in issued visas.
  • Visitor visas had a much lower issue rate at 66.5%, despite having the largest decision volume.
  • Work visa decisions had a 71.6% issue rate, below the global work visa average of 86.5%.
  • Other visa routes had the lowest issue rate, with only 53.4% of decisions resulting in issued visas.

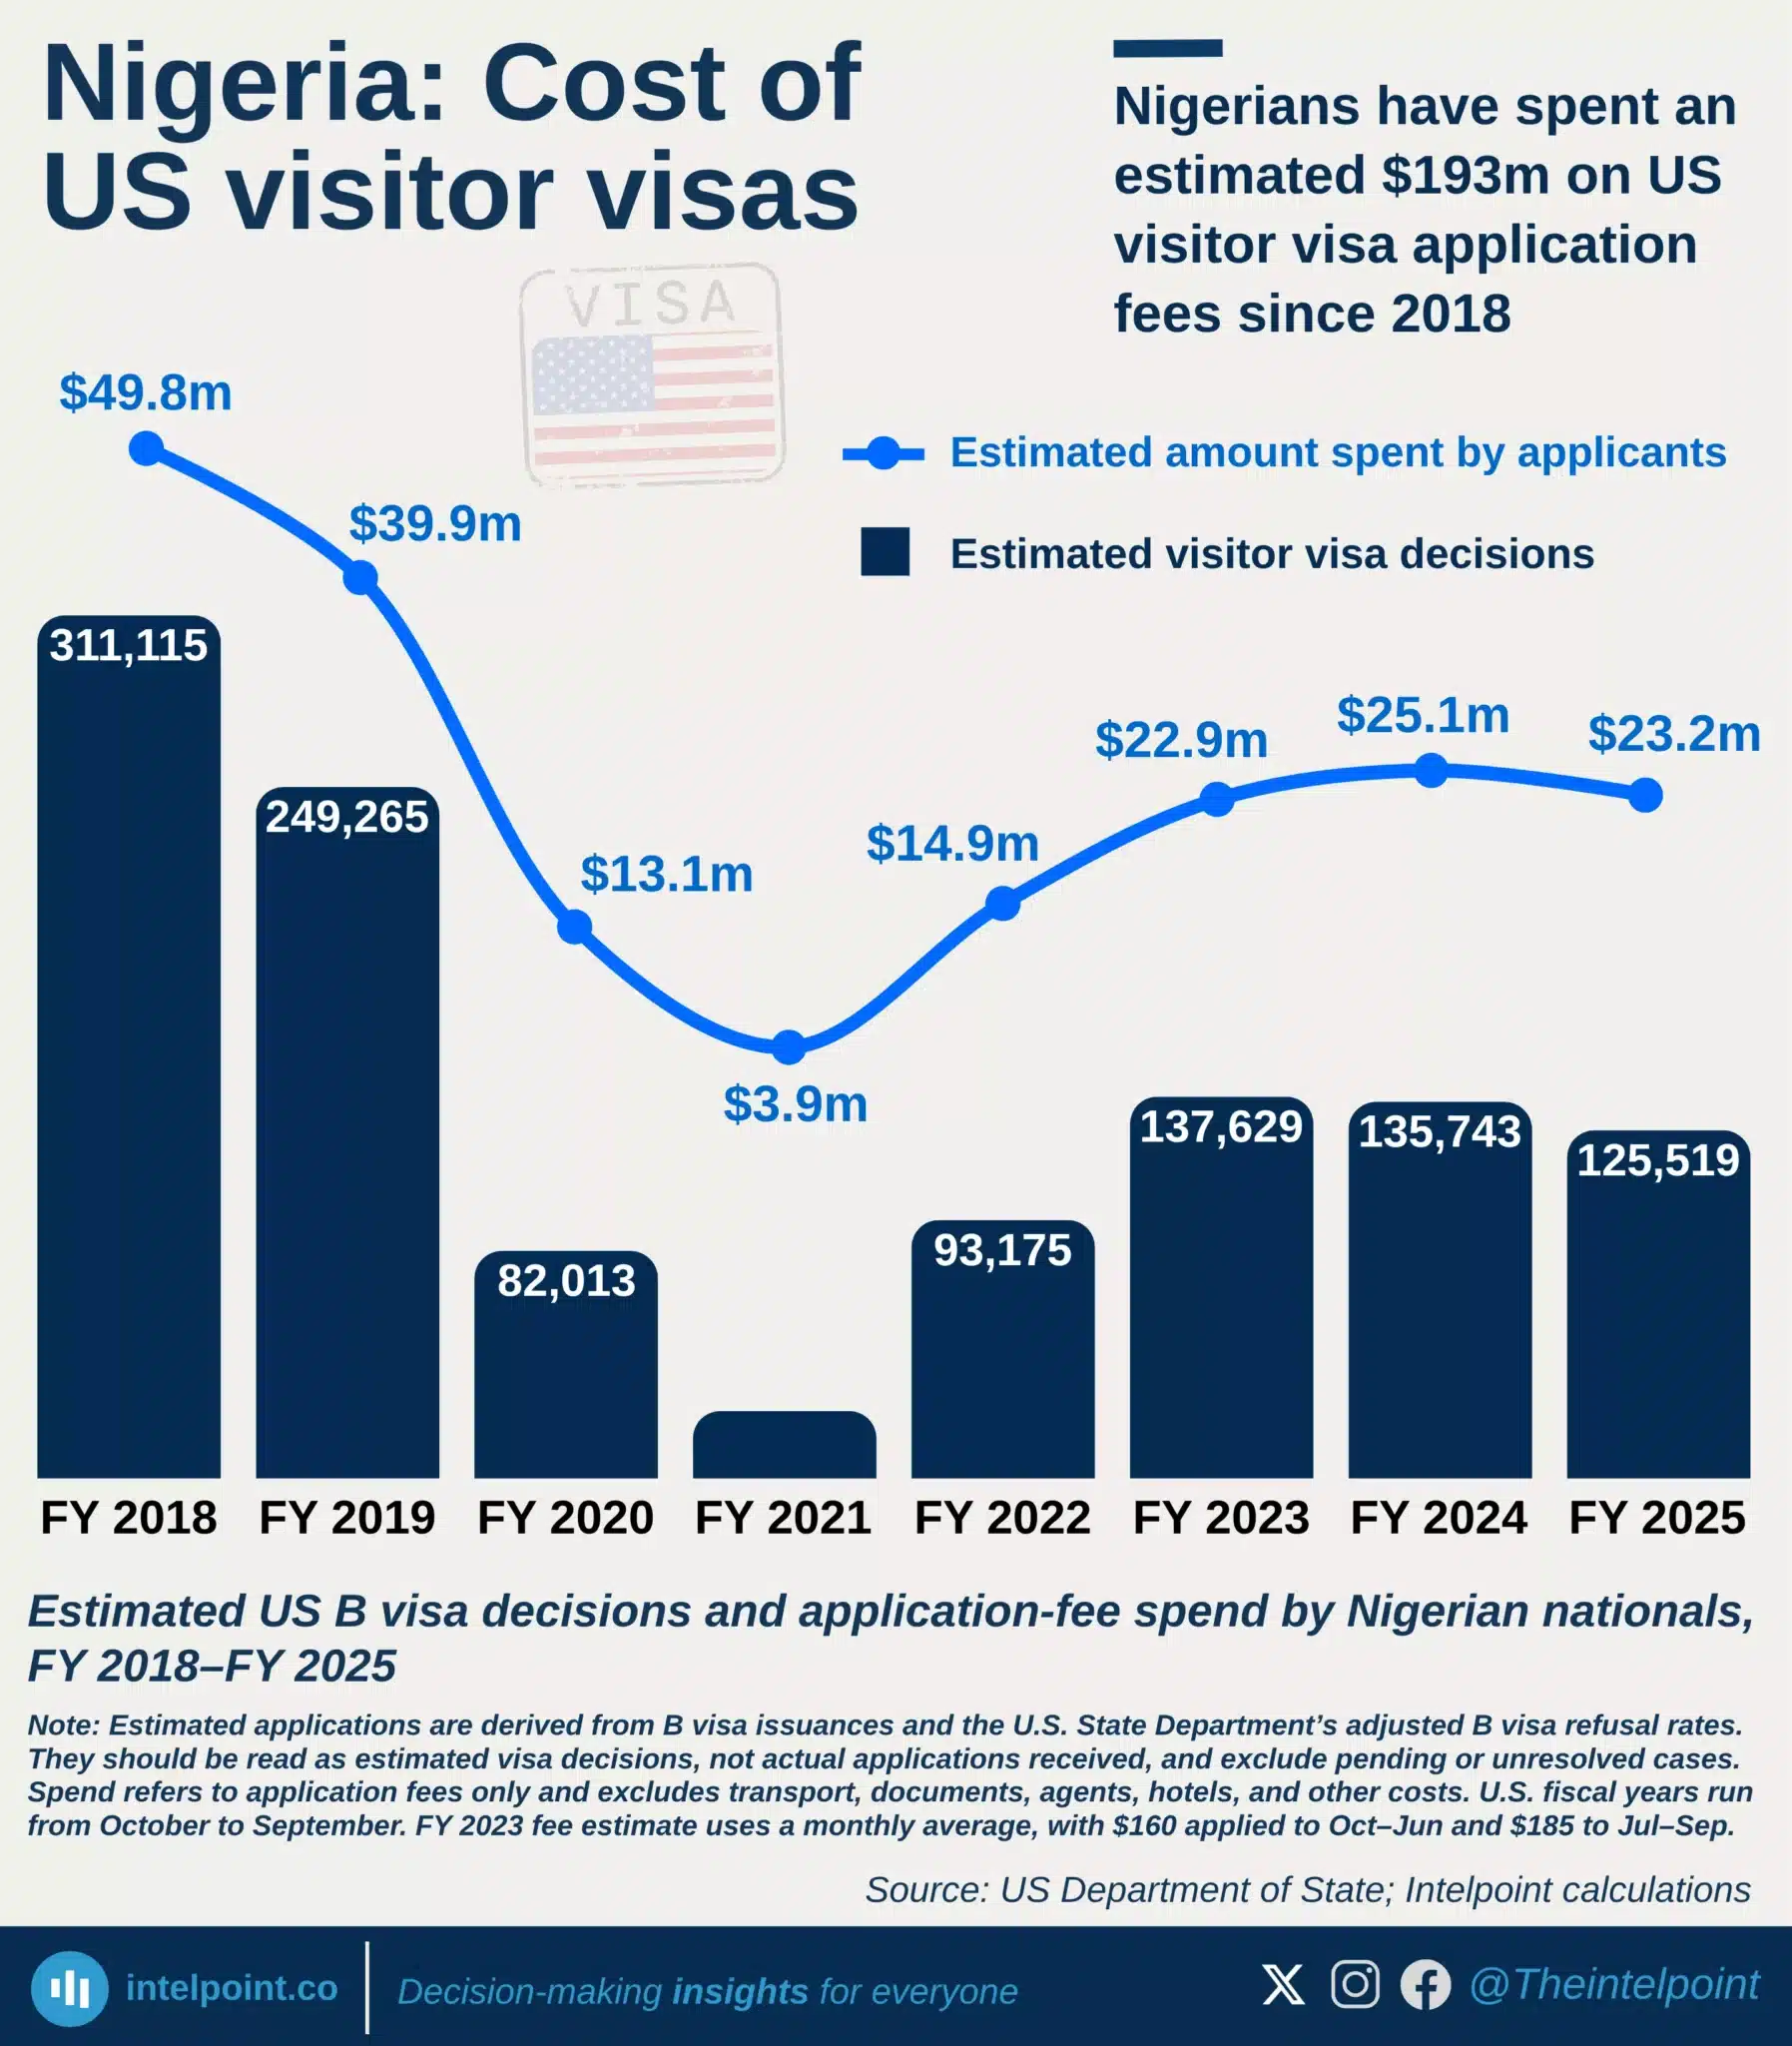
Nigerians have spent an estimated $193 million on U.S. visitor visa application fees since 2018
  • Estimated visitor visa fee spending reached $193 million between FY 2018 and FY 2025.
  • Applicants paid the fee whether their visas were approved or refused.
  • Estimated spending peaked at $49.8 million in FY 2018.
  • Spending recovered to $25.1 million in FY 2024 before falling to $23.2 million in FY 2025.
  • The estimates exclude transport, documents, agents, accommodation and other related costs.

POPULAR TOPICS
SIGN UP TO OUR NEWSLETTER
Get periodic updates about the African startup space, access to our reports, among others.
Subscribe Here
Subscription Form

A product of Techpoint Africa. All rights reserved