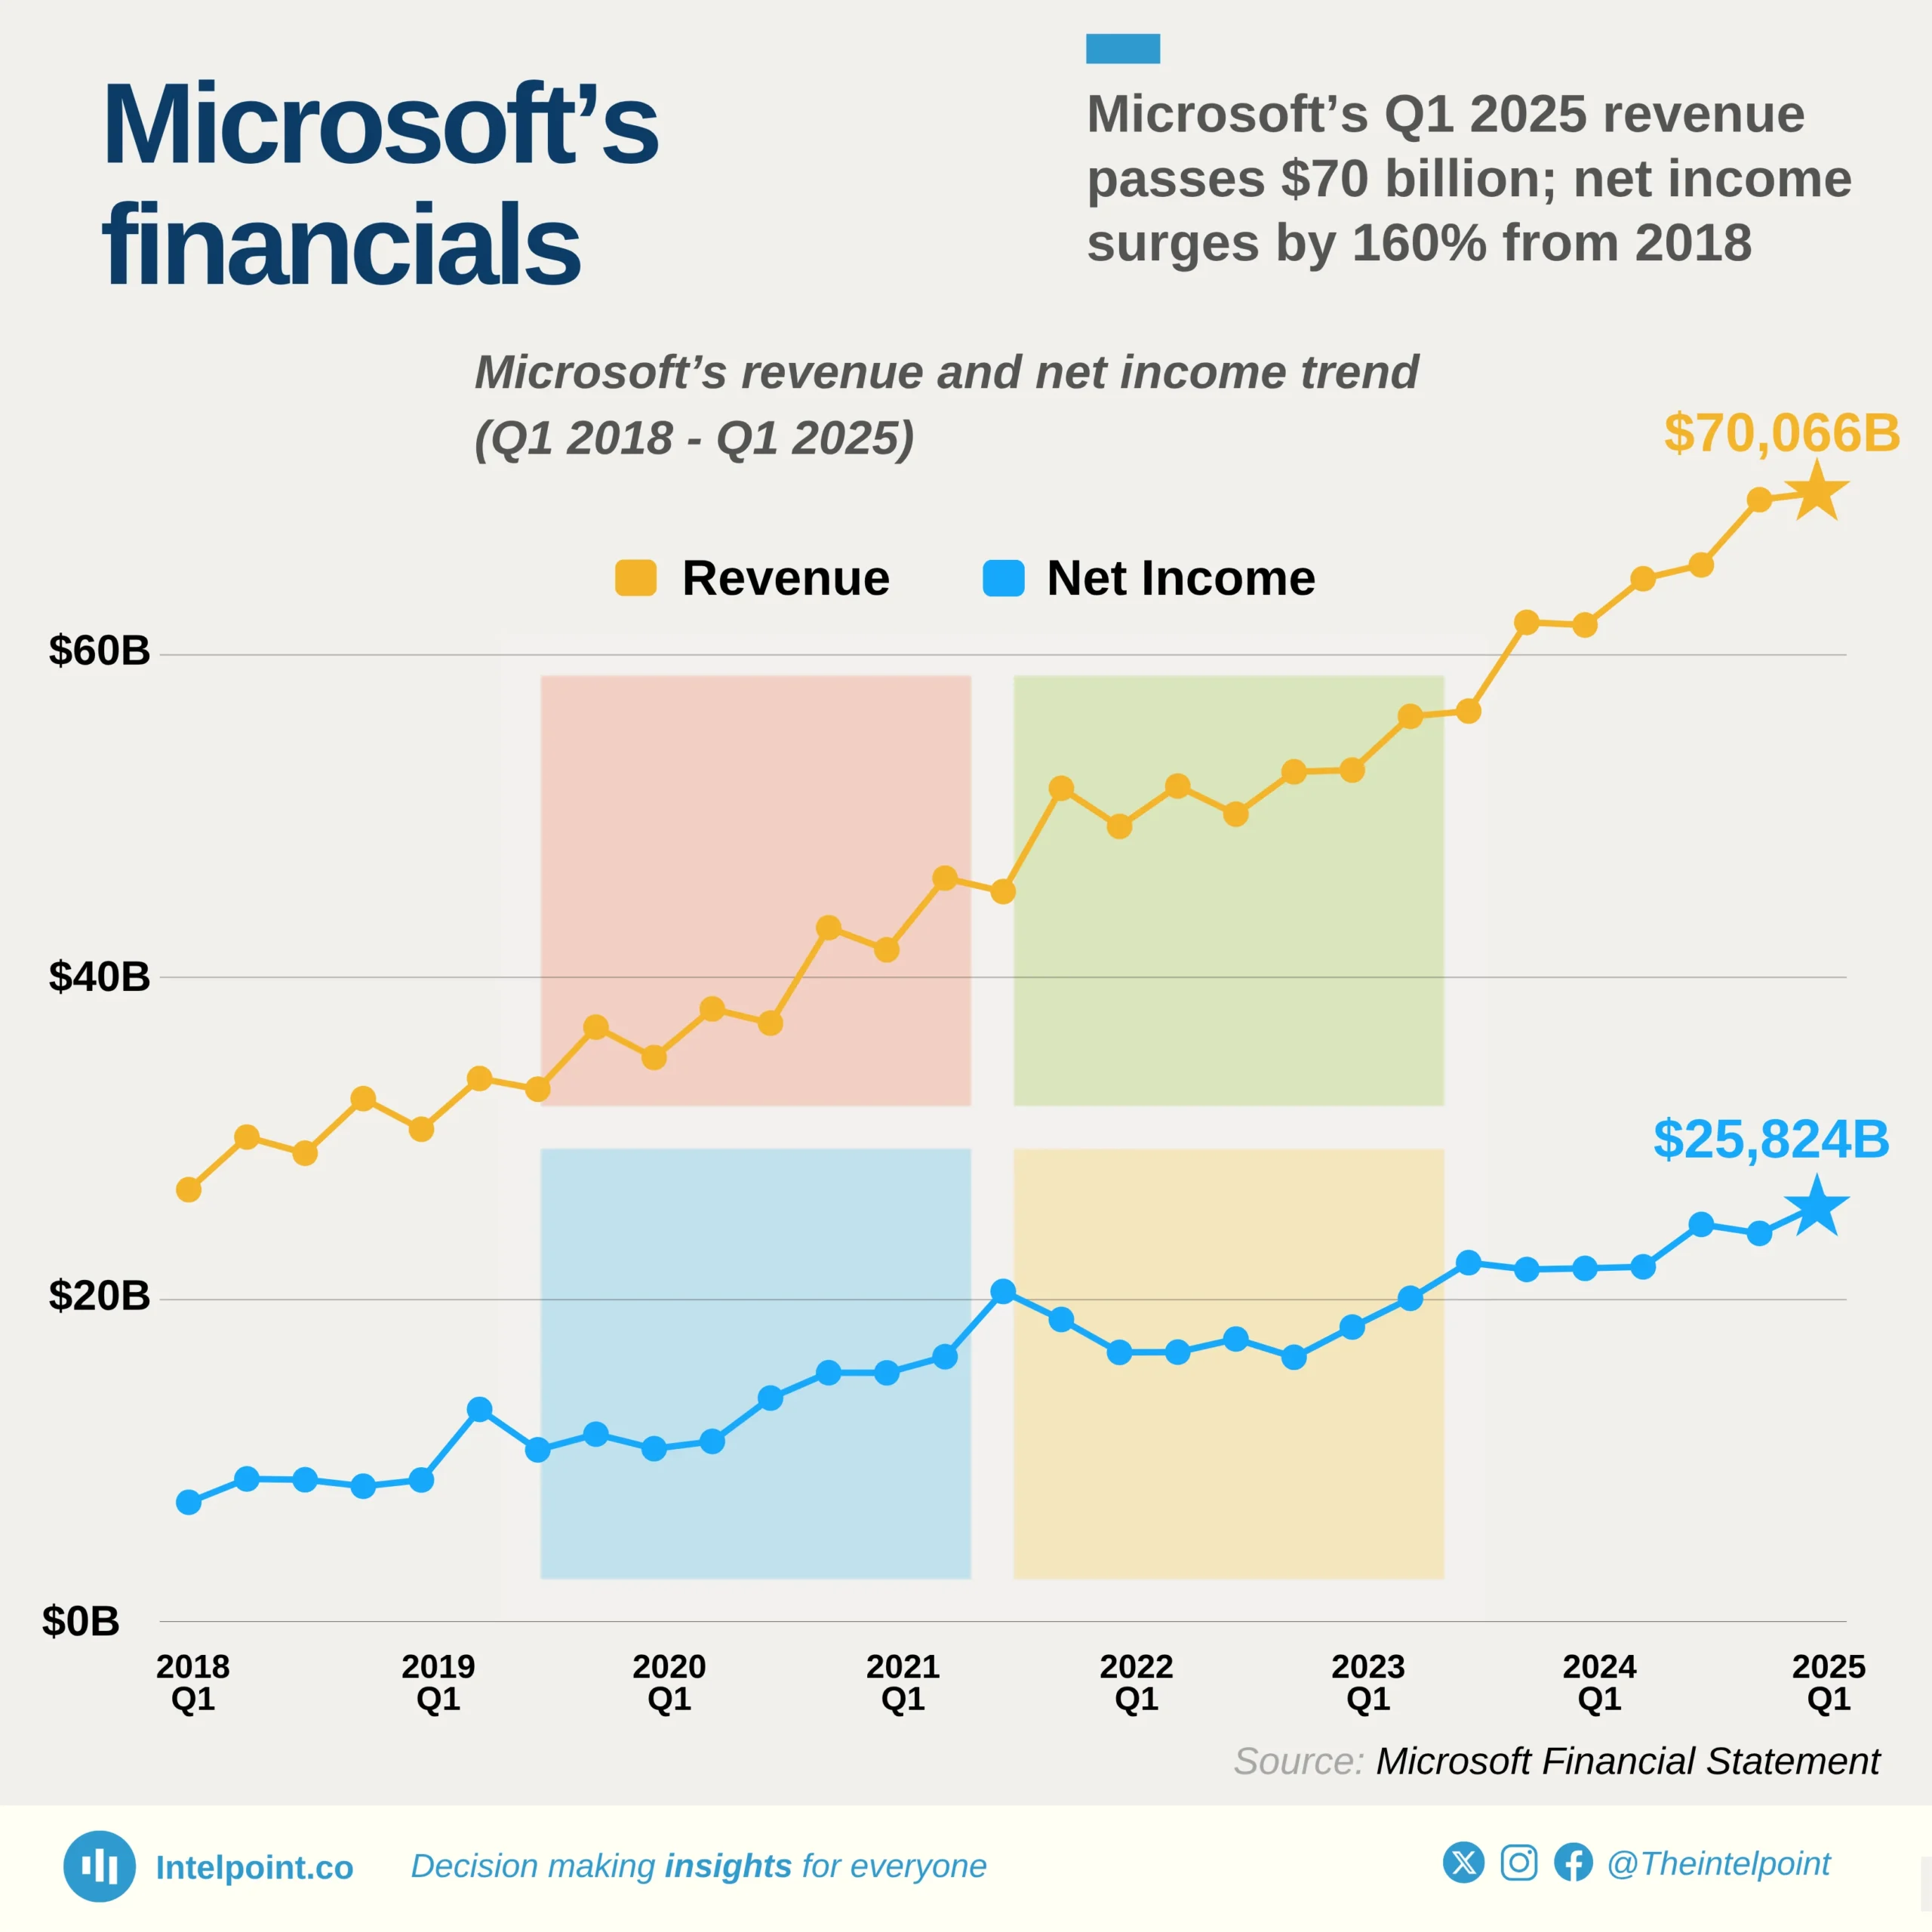
Microsoft’s Q1 2025 revenue passes $70 billion; net income surges by 160% from 2018

Key takeaways

  • Microsoft’s revenue has grown steadily from $26.8B in Q1 2018 to $70.1B in Q1 2025, marking a 161% increase over the seven-year period.
  • Its net income more than tripled from $7.4B in Q1 2018 to $25.8B in Q1 2025, with consistent year-on-year growth, especially sharp increases between 2020 and 2023.
  • The company crossed the $50B quarterly revenue mark for the first time in Q4 2021, and hasn’t dropped below that threshold since Q1 2022.
  • From Q1 2023 to Q1 2025 alone, Microsoft’s net income surged by over $7.5B, signalling an era of record profitability, with each quarter surpassing $20B in profit since Q2 2023.

Microsoft’s financial performance between 2018 and 2025 paints a compelling picture of robust and consistent growth. Starting with $26.8 billion in revenue in Q1 2018, the tech giant steadily expanded its earnings, culminating in $70.1 billion by Q1 2025, a more than 2.5x increase in just seven years. This growth trajectory was not limited to top-line revenue; net income followed a similar upward path, moving from $7.4 billion to an all-time high of $25.8 billion over the same period.

The company’s most aggressive financial leap occurred post-2020, with revenue consistently surpassing the $50 billion mark from late 2021 onwards. Particularly notable is the period from 2023 to 2025, during which Microsoft achieved sustained quarterly net profits above $20 billion. This financial momentum reflects Microsoft’s operational efficiency, market dominance, and successful expansion across its cloud, enterprise, and AI-driven services, positioning it as one of the most profitable companies of the decade.
Source:

Microsoft Financial Statement

Period:

Q1 2018 - Q1 2025
HTML code to embed chart
Want a bespoke report?
Reach out
Tags
Related Insights

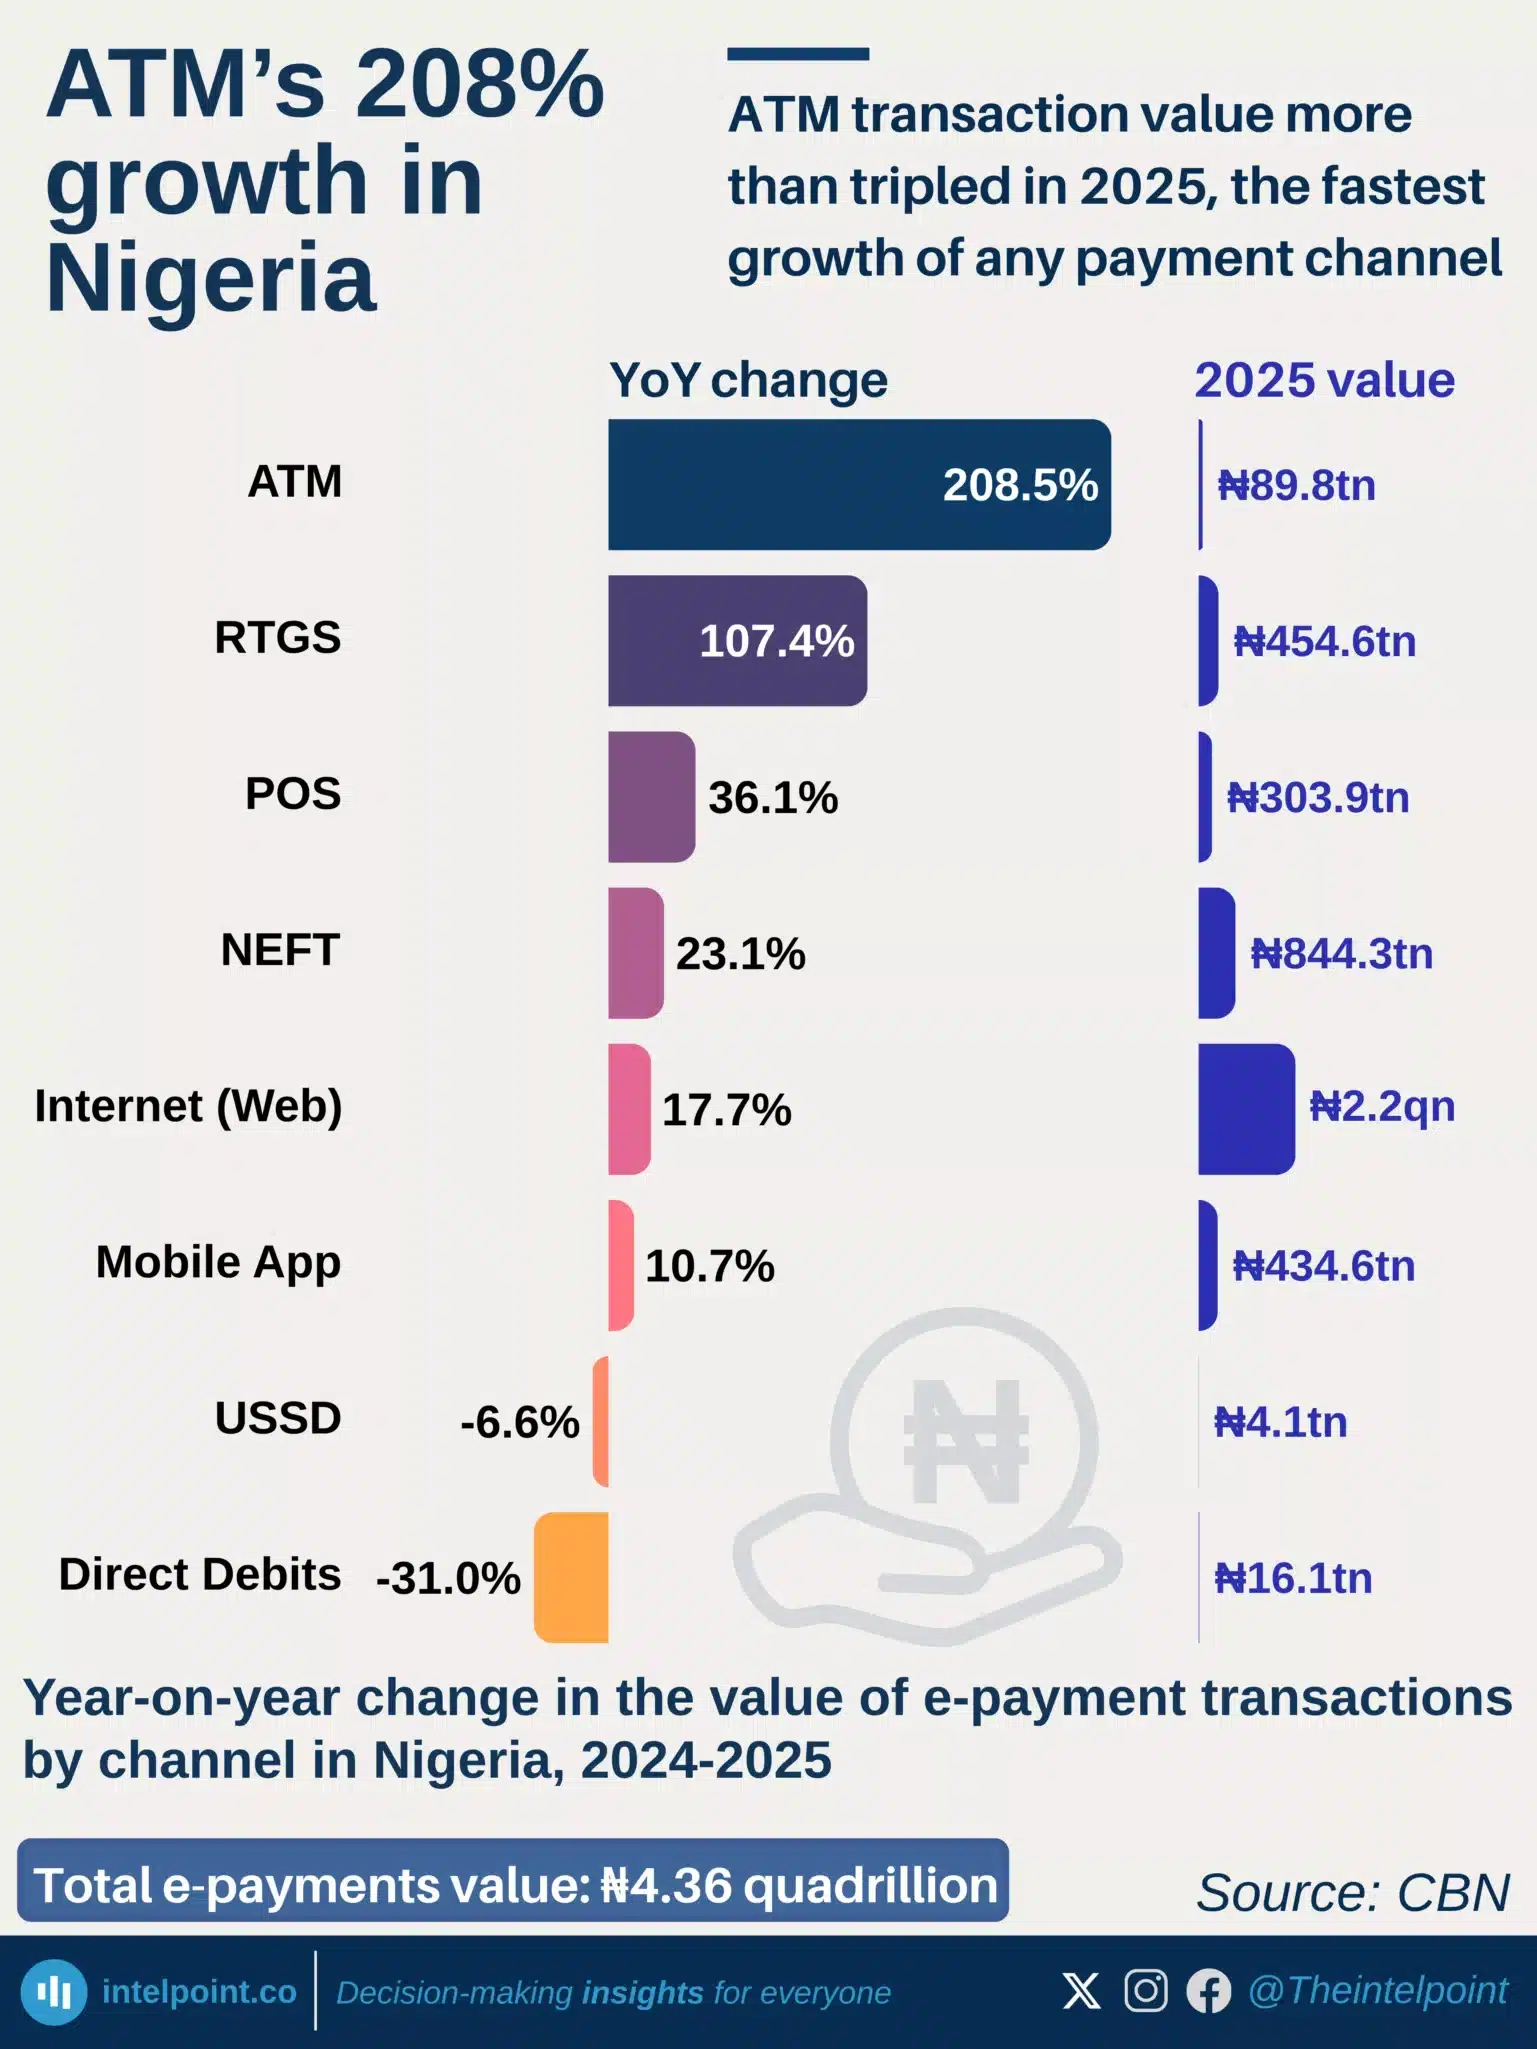
ATM transaction value more than tripled in 2025, the fastest growth of any payment channel
  • ATM transactions surged 208.5% to ₦89.8 trillion in 2025.
  • ATM was Nigeria’s fastest-growing payment channel by value.
  • Average ATM transaction size nearly doubled, rising 90%.
  • ATM usage grew despite higher withdrawal fees introduced by the CBN.
  • Internet/Web payments remained dominant at ₦2.21 quadrillion, despite slower growth.

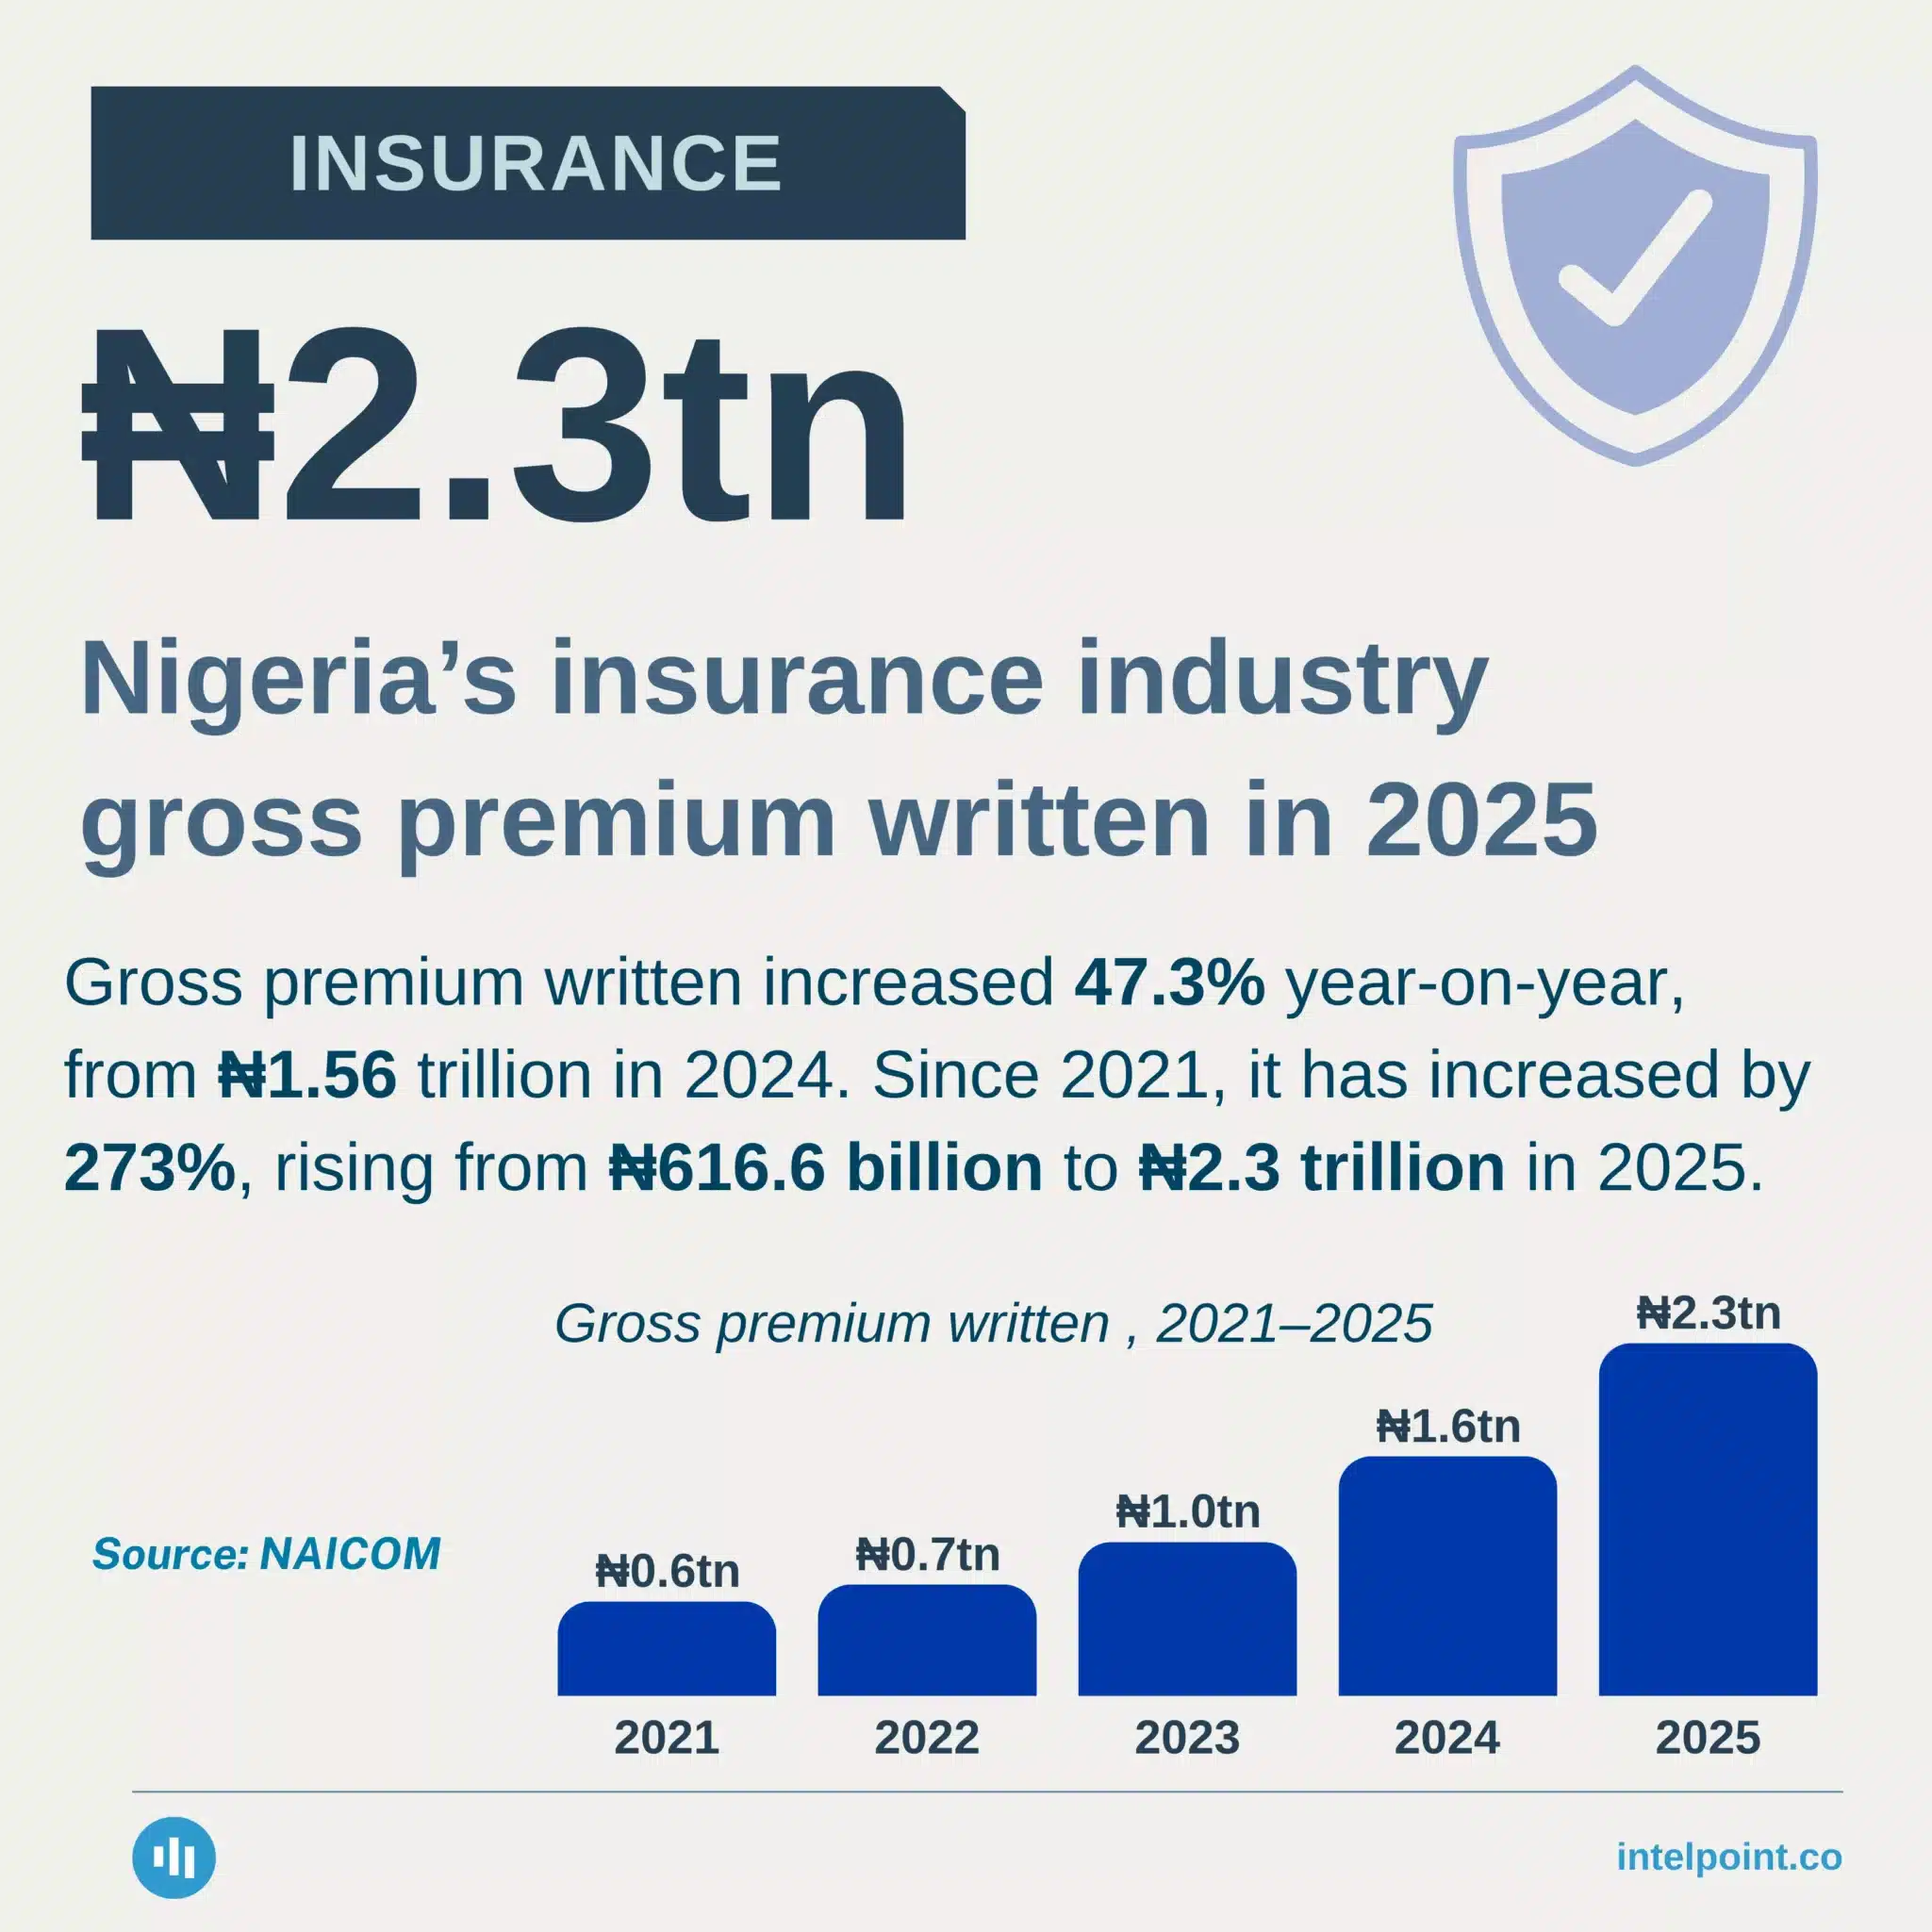
Nigeria’s insurance industry gross premium written in 2025
  • Nigeria's insurance industry generated ₦2.3 trillion in gross premium written in 2025.
  • Gross premium written increased 47.3% from ₦1.56 trillion in 2024.
  • Premiums have grown by 273% since 2021, from ₦616.6 billion.
  • Gross premium written has increased every year since 2021.
  • Premium growth does not necessarily mean higher insurance coverage or profitability.

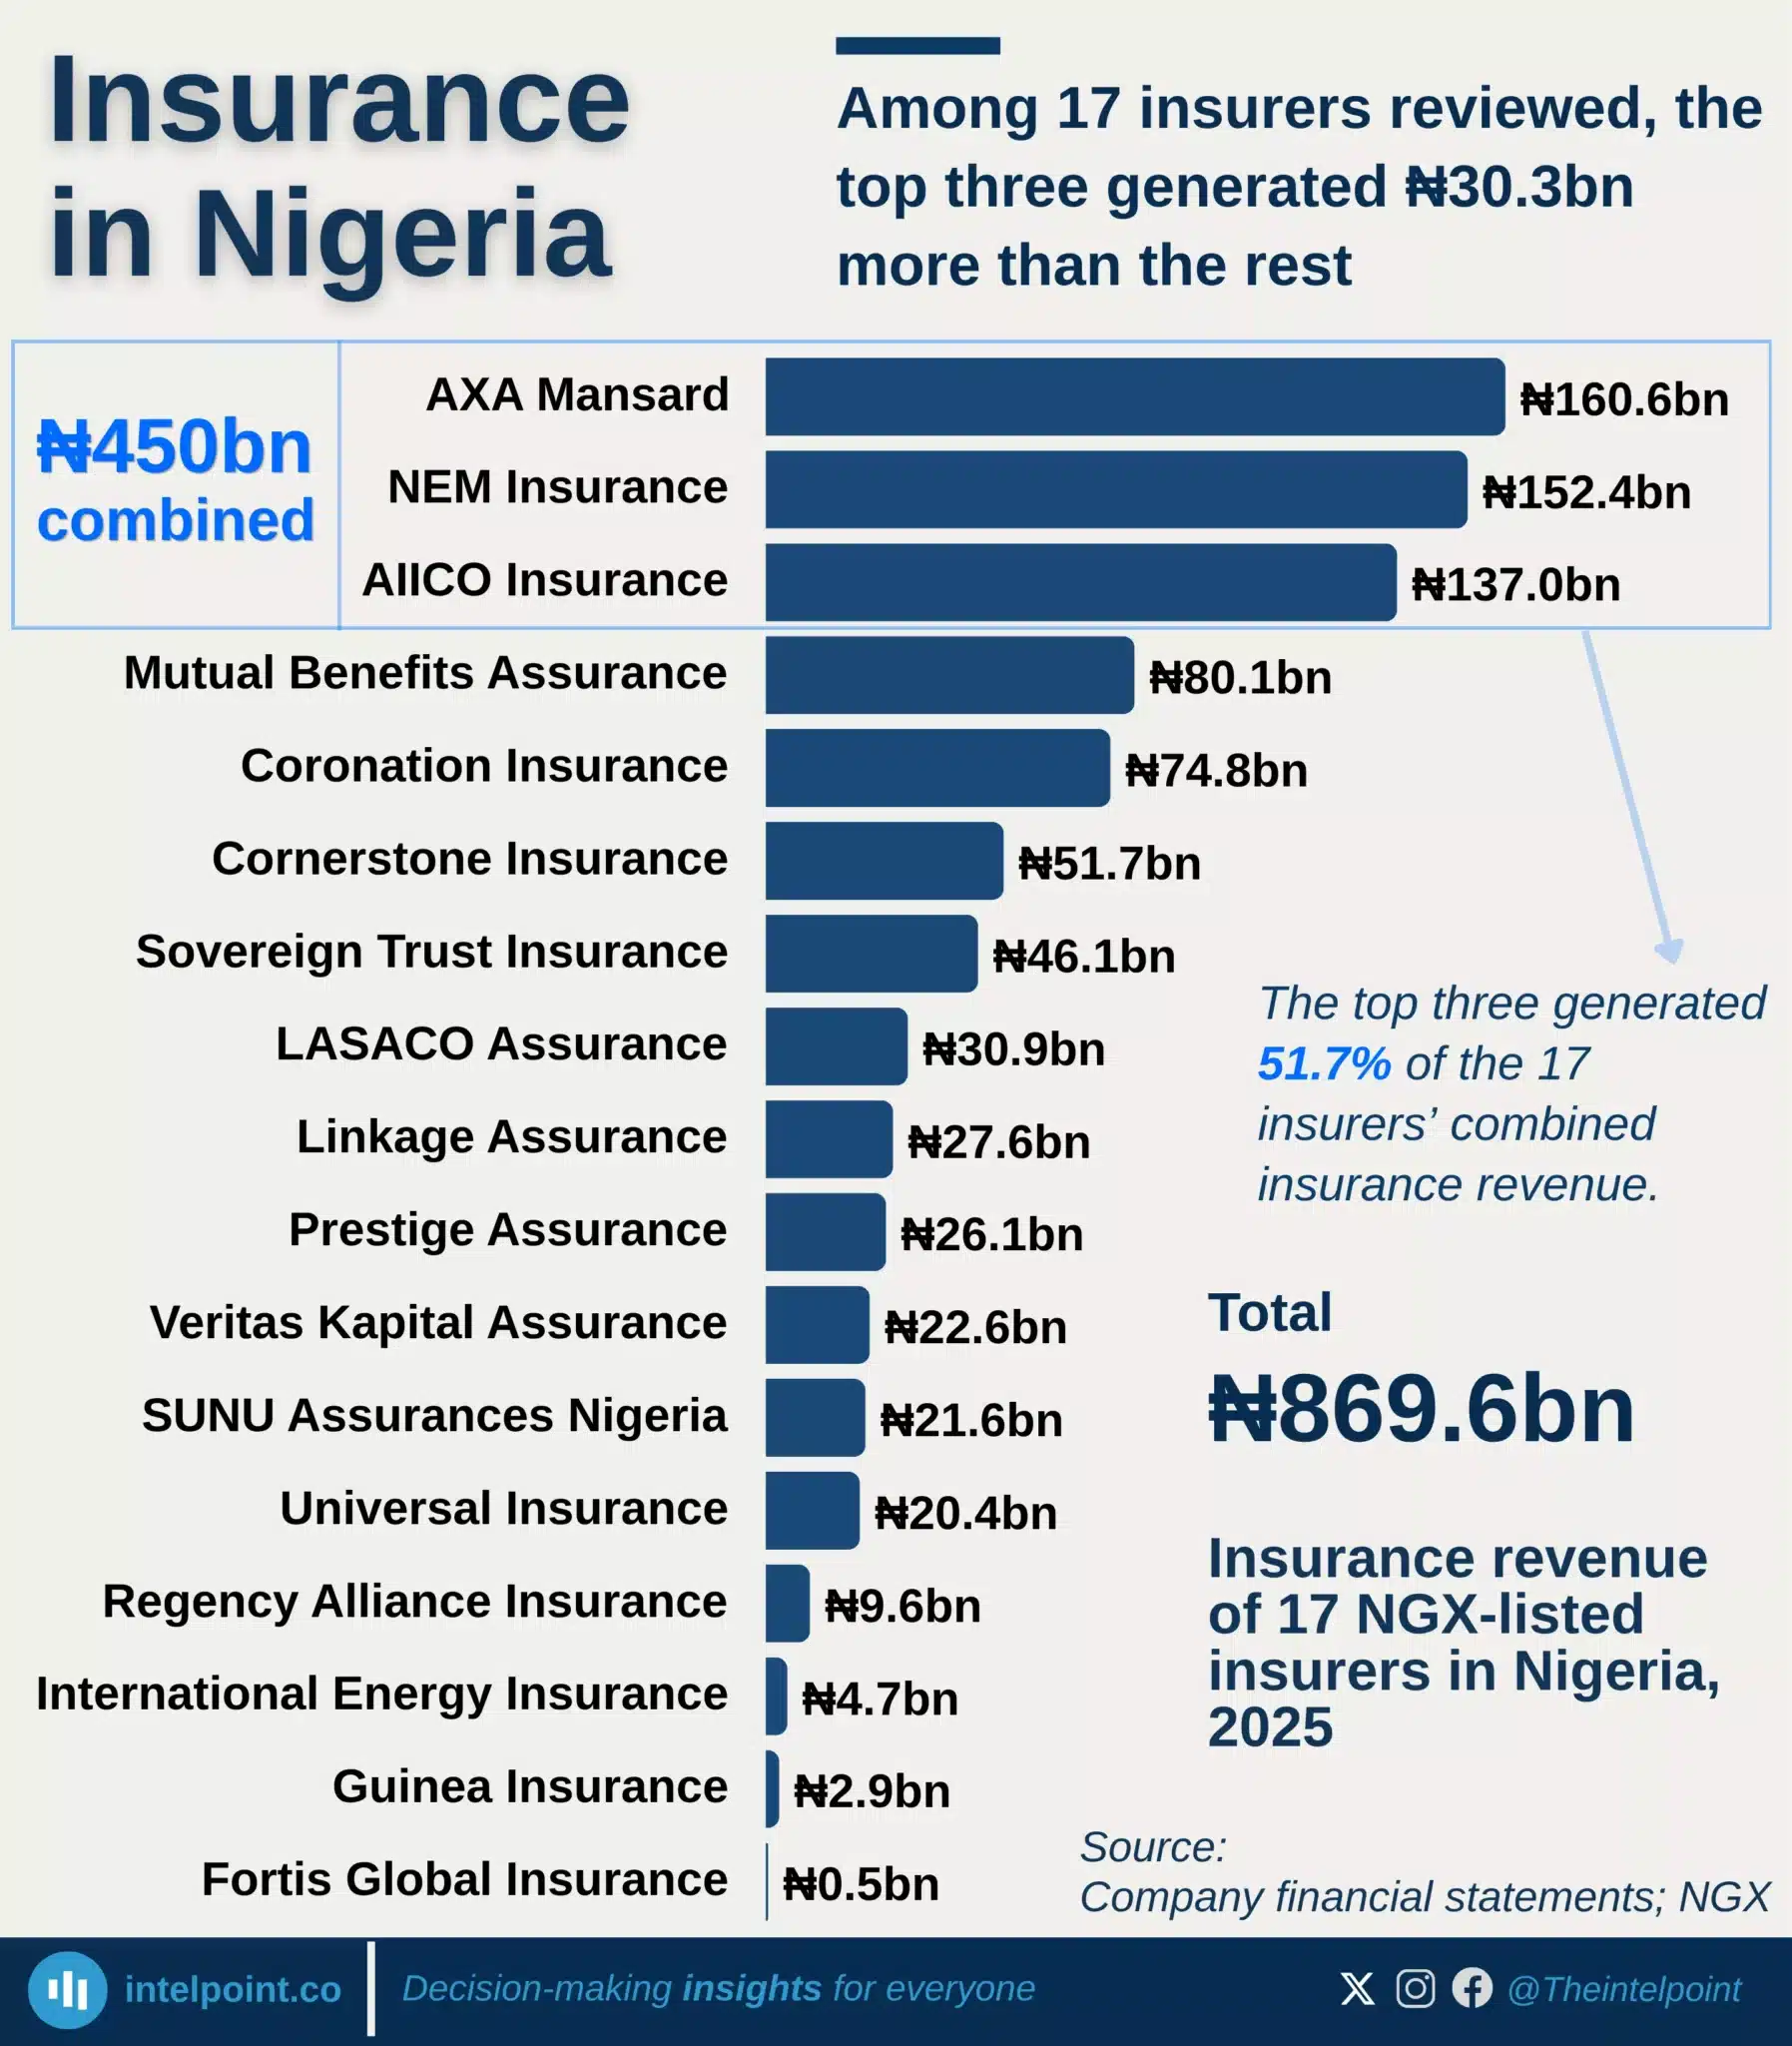
Among 17 insurers reviewed, the top three generated ₦30.3bn more than the rest
  • AXA Mansard, NEM Insurance and AIICO generated 51.7% of the combined revenue of 17 NGX-listed insurers.
  • The top three earned ₦449.9 billion, ₦30.3 billion more than the other 14 insurers combined.
  • The 17 insurers generated a combined ₦869.6 billion in insurance revenue in 2025.
  • AXA Mansard recorded the highest insurance revenue at ₦160.6 billion.
  • Revenue rose at 15 insurers, but only four reported higher profits.

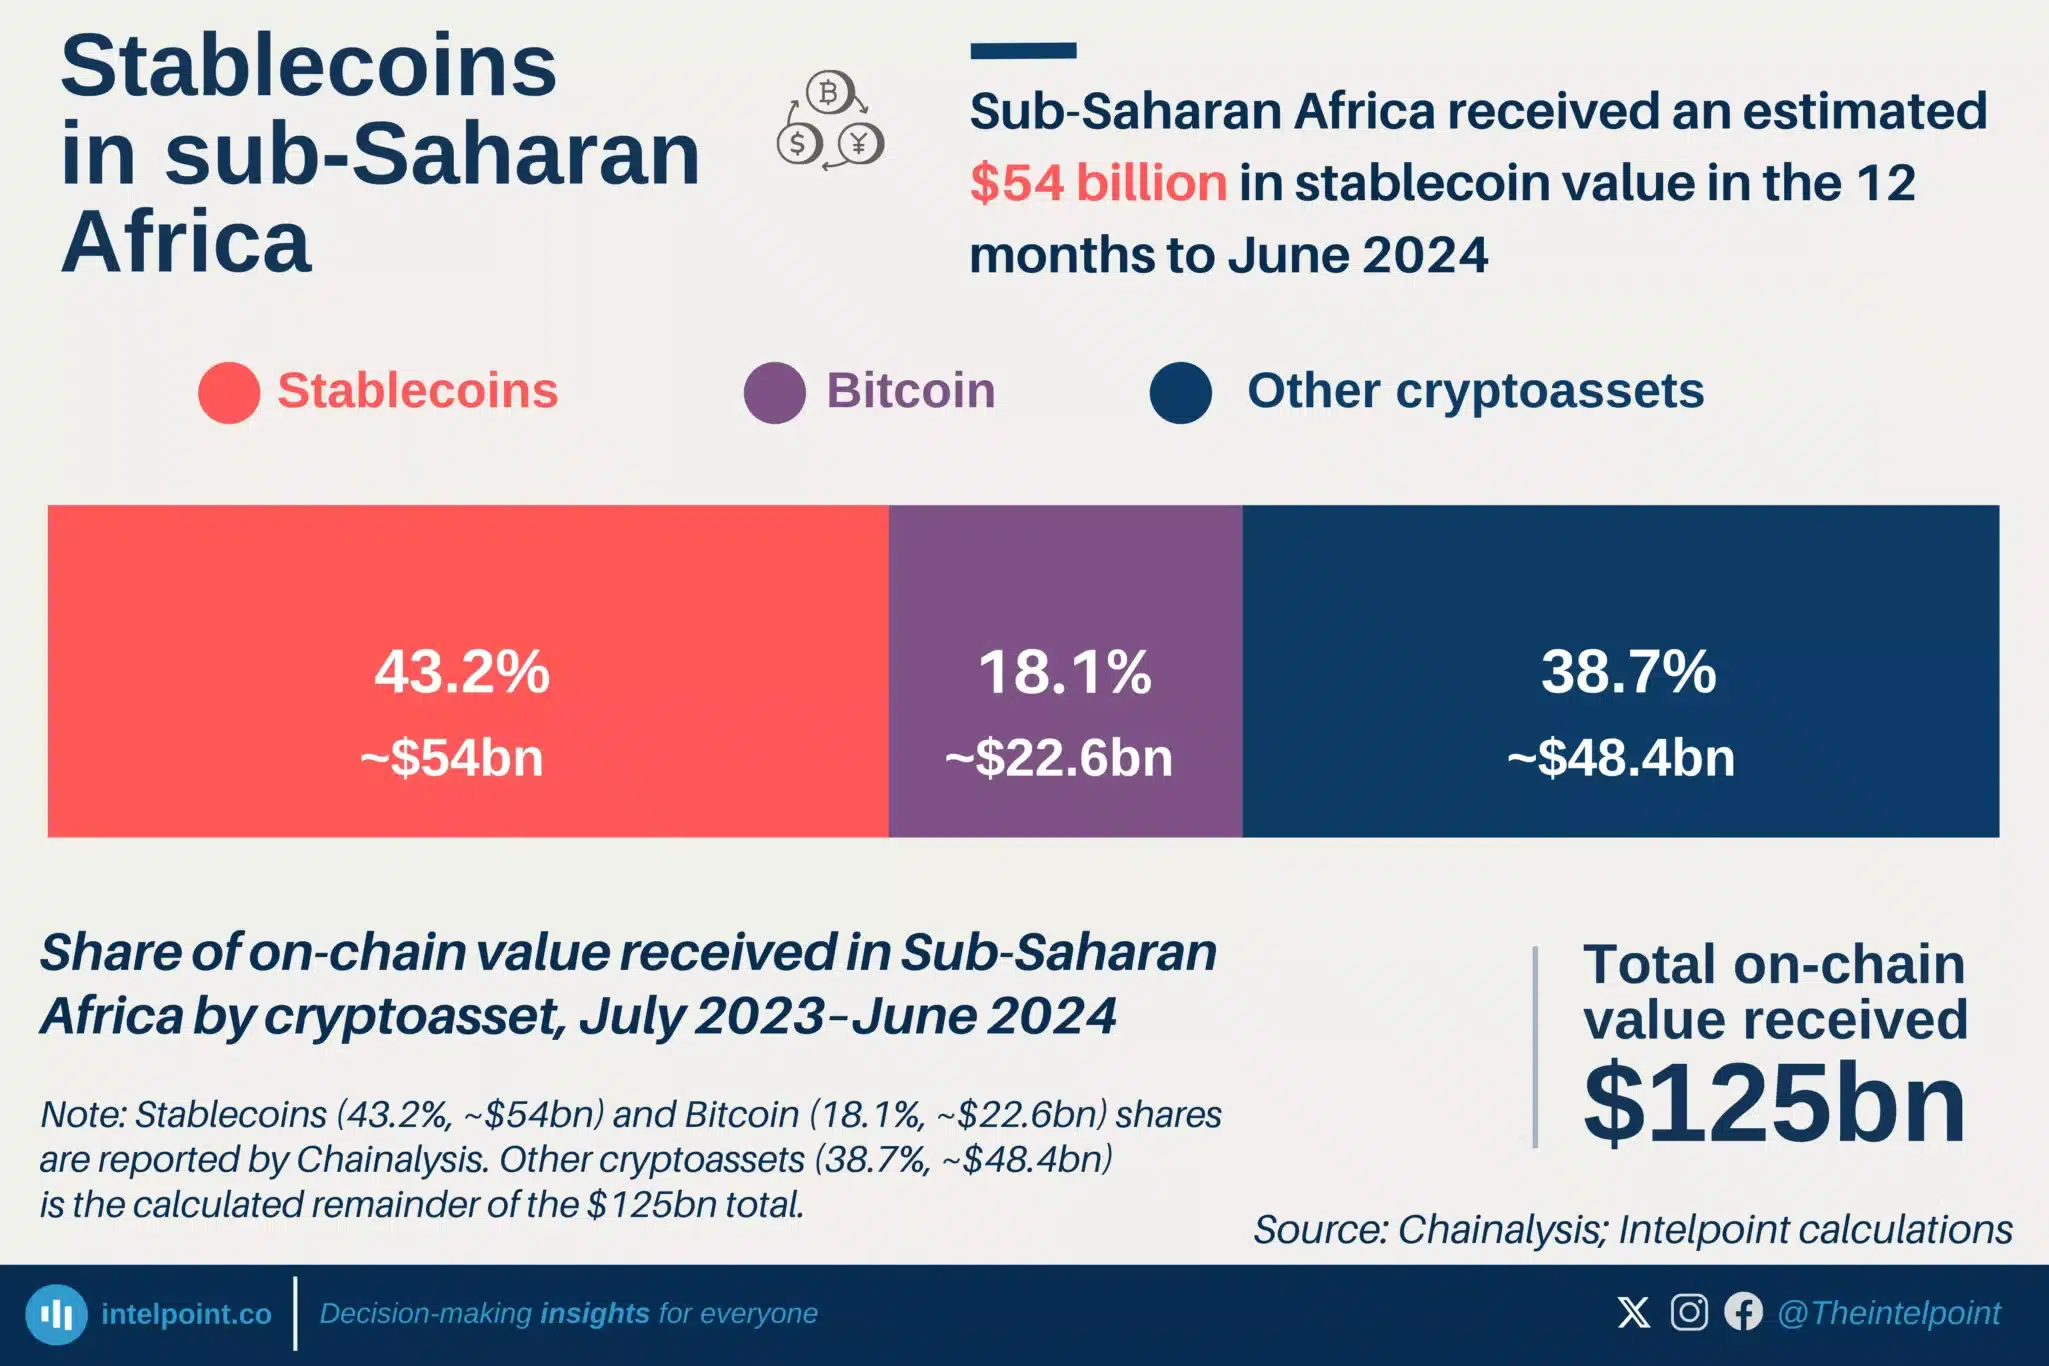
Sub-Saharan Africa received an estimated $54 billion in stablecoin value in the 12 months to June 2024
  • Total received: $125 billion in on-chain value.
  • Stablecoin value: $54 billion, representing 43.2%.
  • Bitcoin comparison: Stablecoins received more than twice Bitcoin’s value.
  • Key driver: Currency depreciation and limited dollar access.

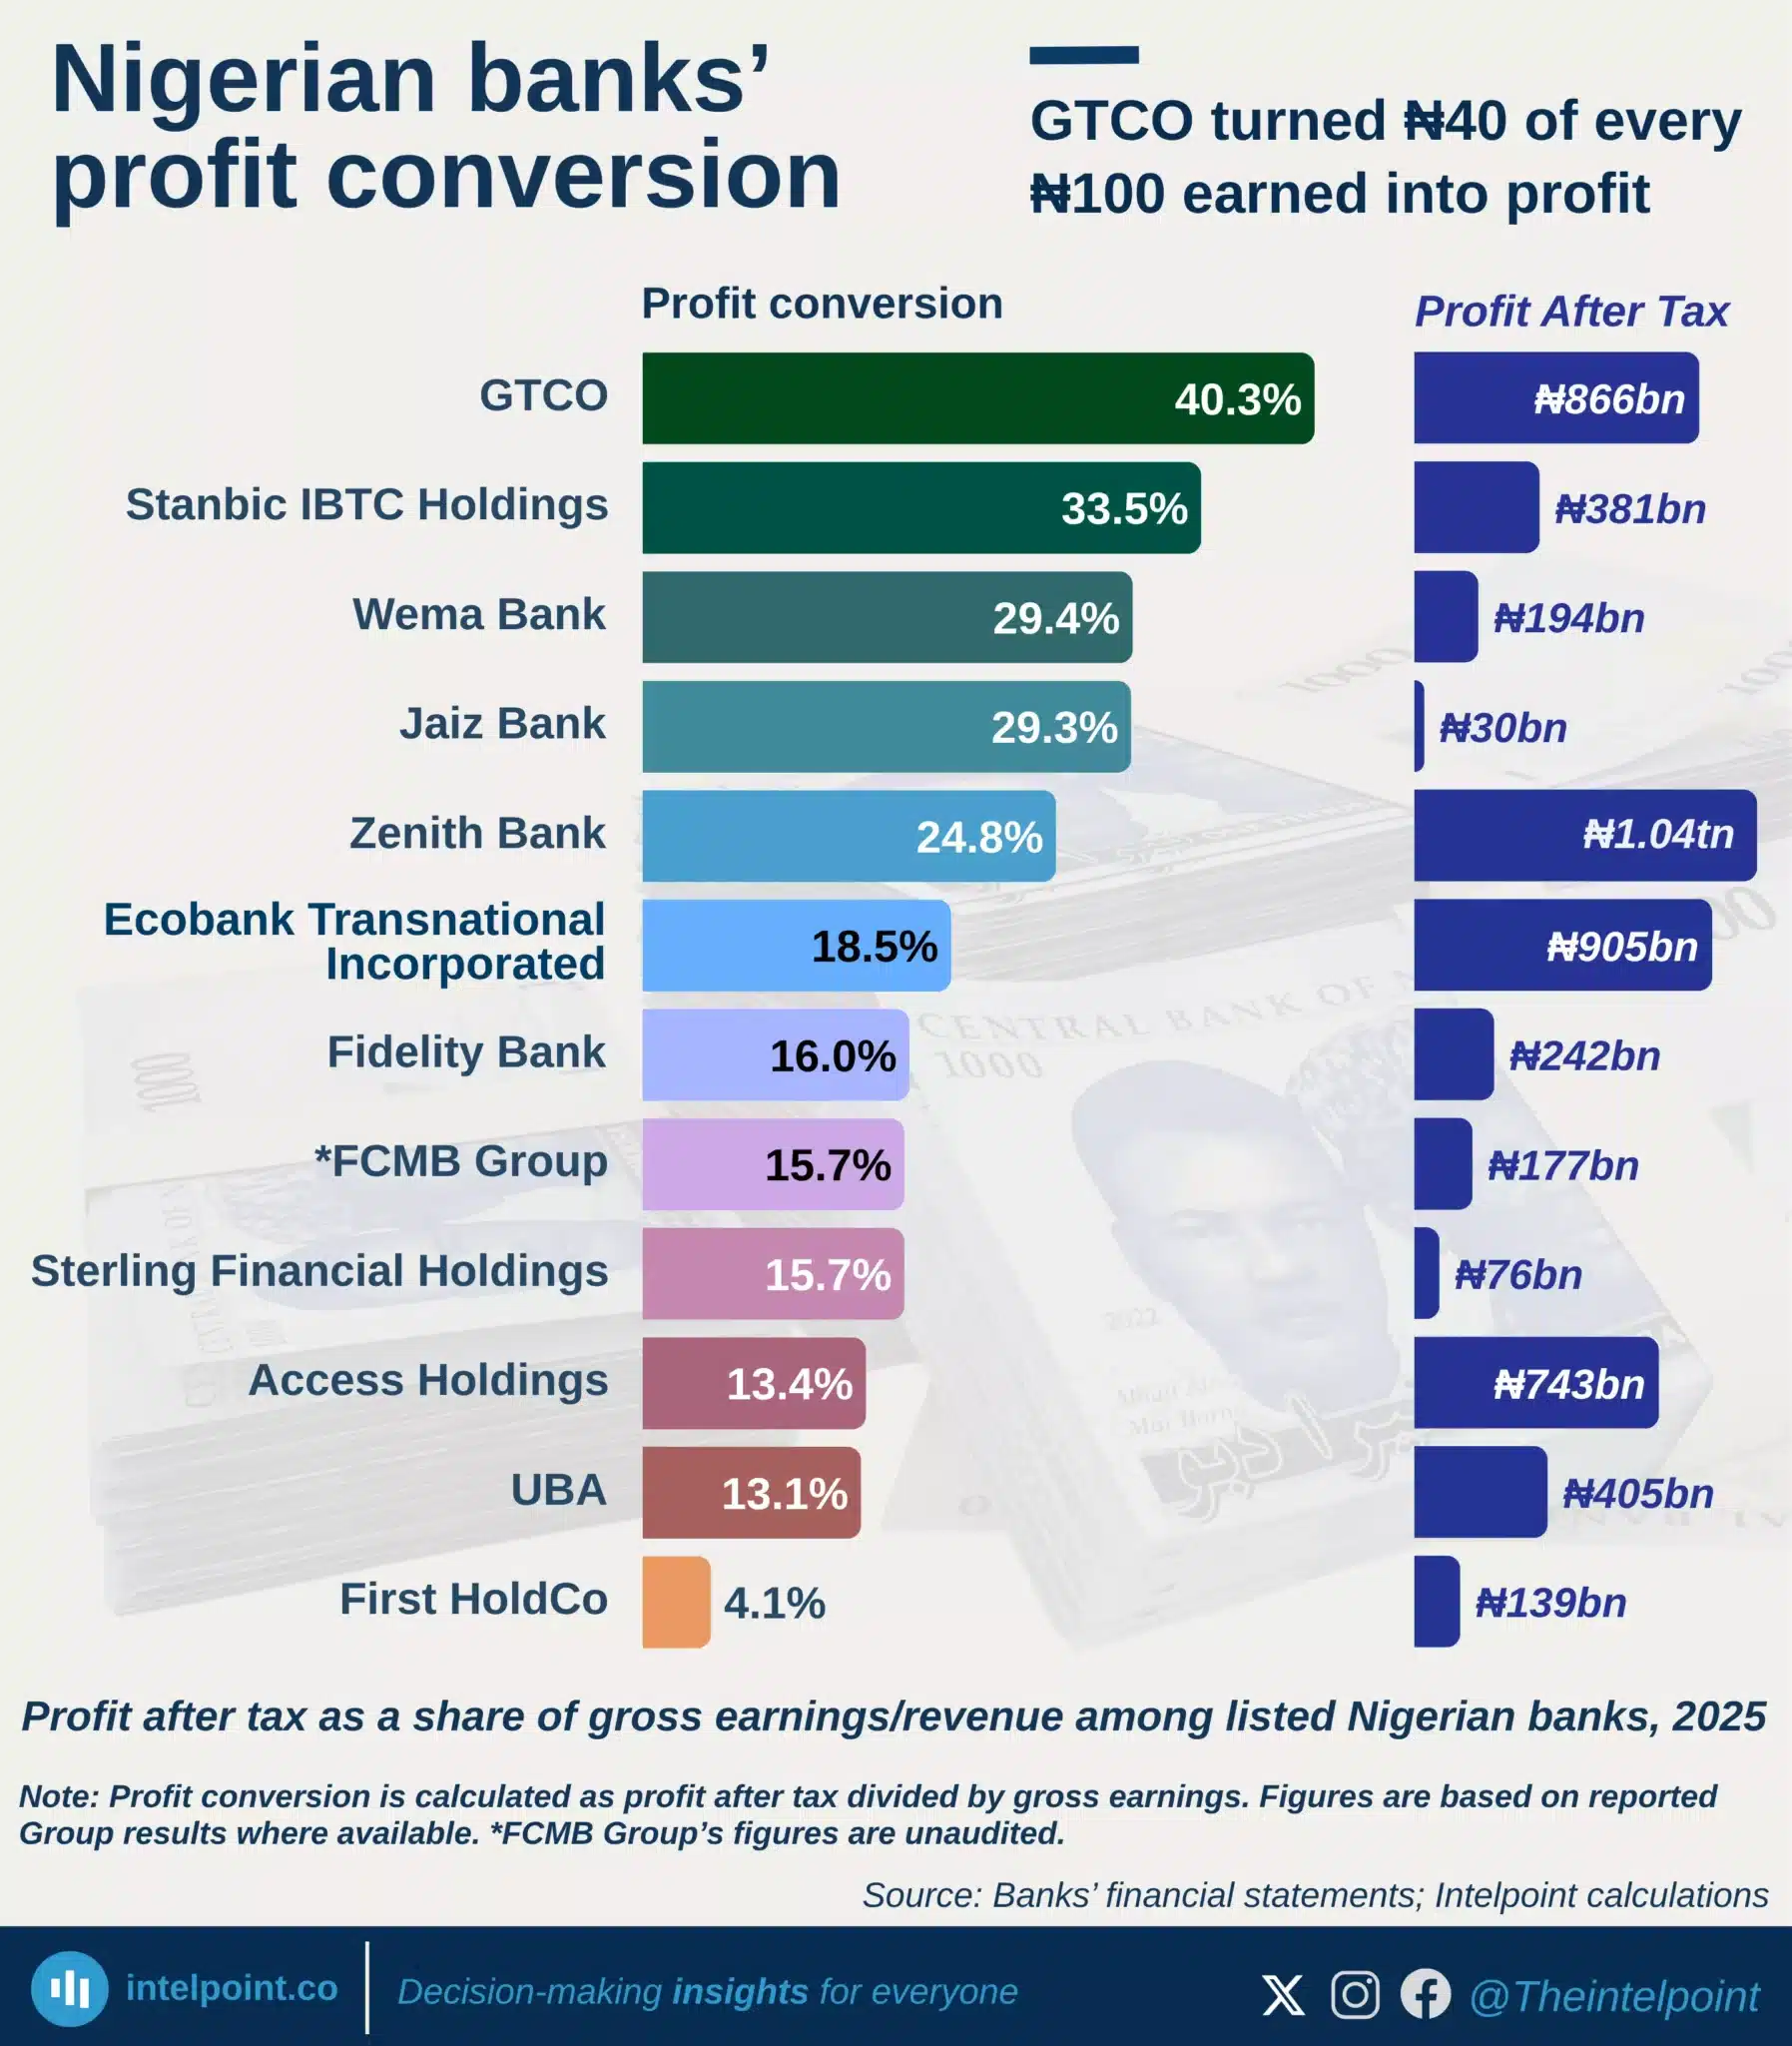
GTCO turned ₦40 of every ₦100 earned into profit
  • GTCO had the strongest profit conversion in 2025.
  • GTCO turned about ₦40 of every ₦100 earned into profit.
  • Stanbic IBTC followed with about ₦34 profit per ₦100 earned.
  • Zenith made the highest profit, but not the strongest conversion.
  • First HoldCo had the weakest profit conversion among the banks reviewed.
 

Kenyan banks’ non-performing loan ratios fell, with KCB’s ratio down 2.9 points
  • All eight selected Kenyan banks reduced their NPL ratios in 2025.
  • KCB recorded the largest improvement, with a 2.9% point drop.
  • KCB still had the highest NPL ratio in the group at 16.9%.
  • Co-operative Bank remained highly stressed at 15.7%, despite some improvement.
  • Equity Bank and Absa Bank Kenya both ended 2025 at 11.5%.
  • Standard Chartered Kenya had the lowest NPL ratio in the group at 5.5%.

POPULAR TOPICS
SIGN UP TO OUR NEWSLETTER
Get periodic updates about the African startup space, access to our reports, among others.
Subscribe Here
Subscription Form

A product of Techpoint Africa. All rights reserved