Manufactured goods drove imports as oil products pushed total to ₦15.29 trillion in Q2 2025

Key Takeaways

  • ₦7.88 trillion worth of manufactured goods made up 51.6% of imports, underscoring Nigeria’s dependence on foreign industrial products.
  • Other petroleum oil products accounted for ₦2.79 trillion (18.2%) of imports, showing continued reliance on external energy supplies despite Nigeria’s oil-rich status.
  • ₦1.72 trillion in raw material imports (11.3%) highlights the gap in local processing capacity.
  • Solid minerals (₦70.9 bn, 0.46%) and energy goods (₦150 mn, almost 0%) show almost no role in imports.

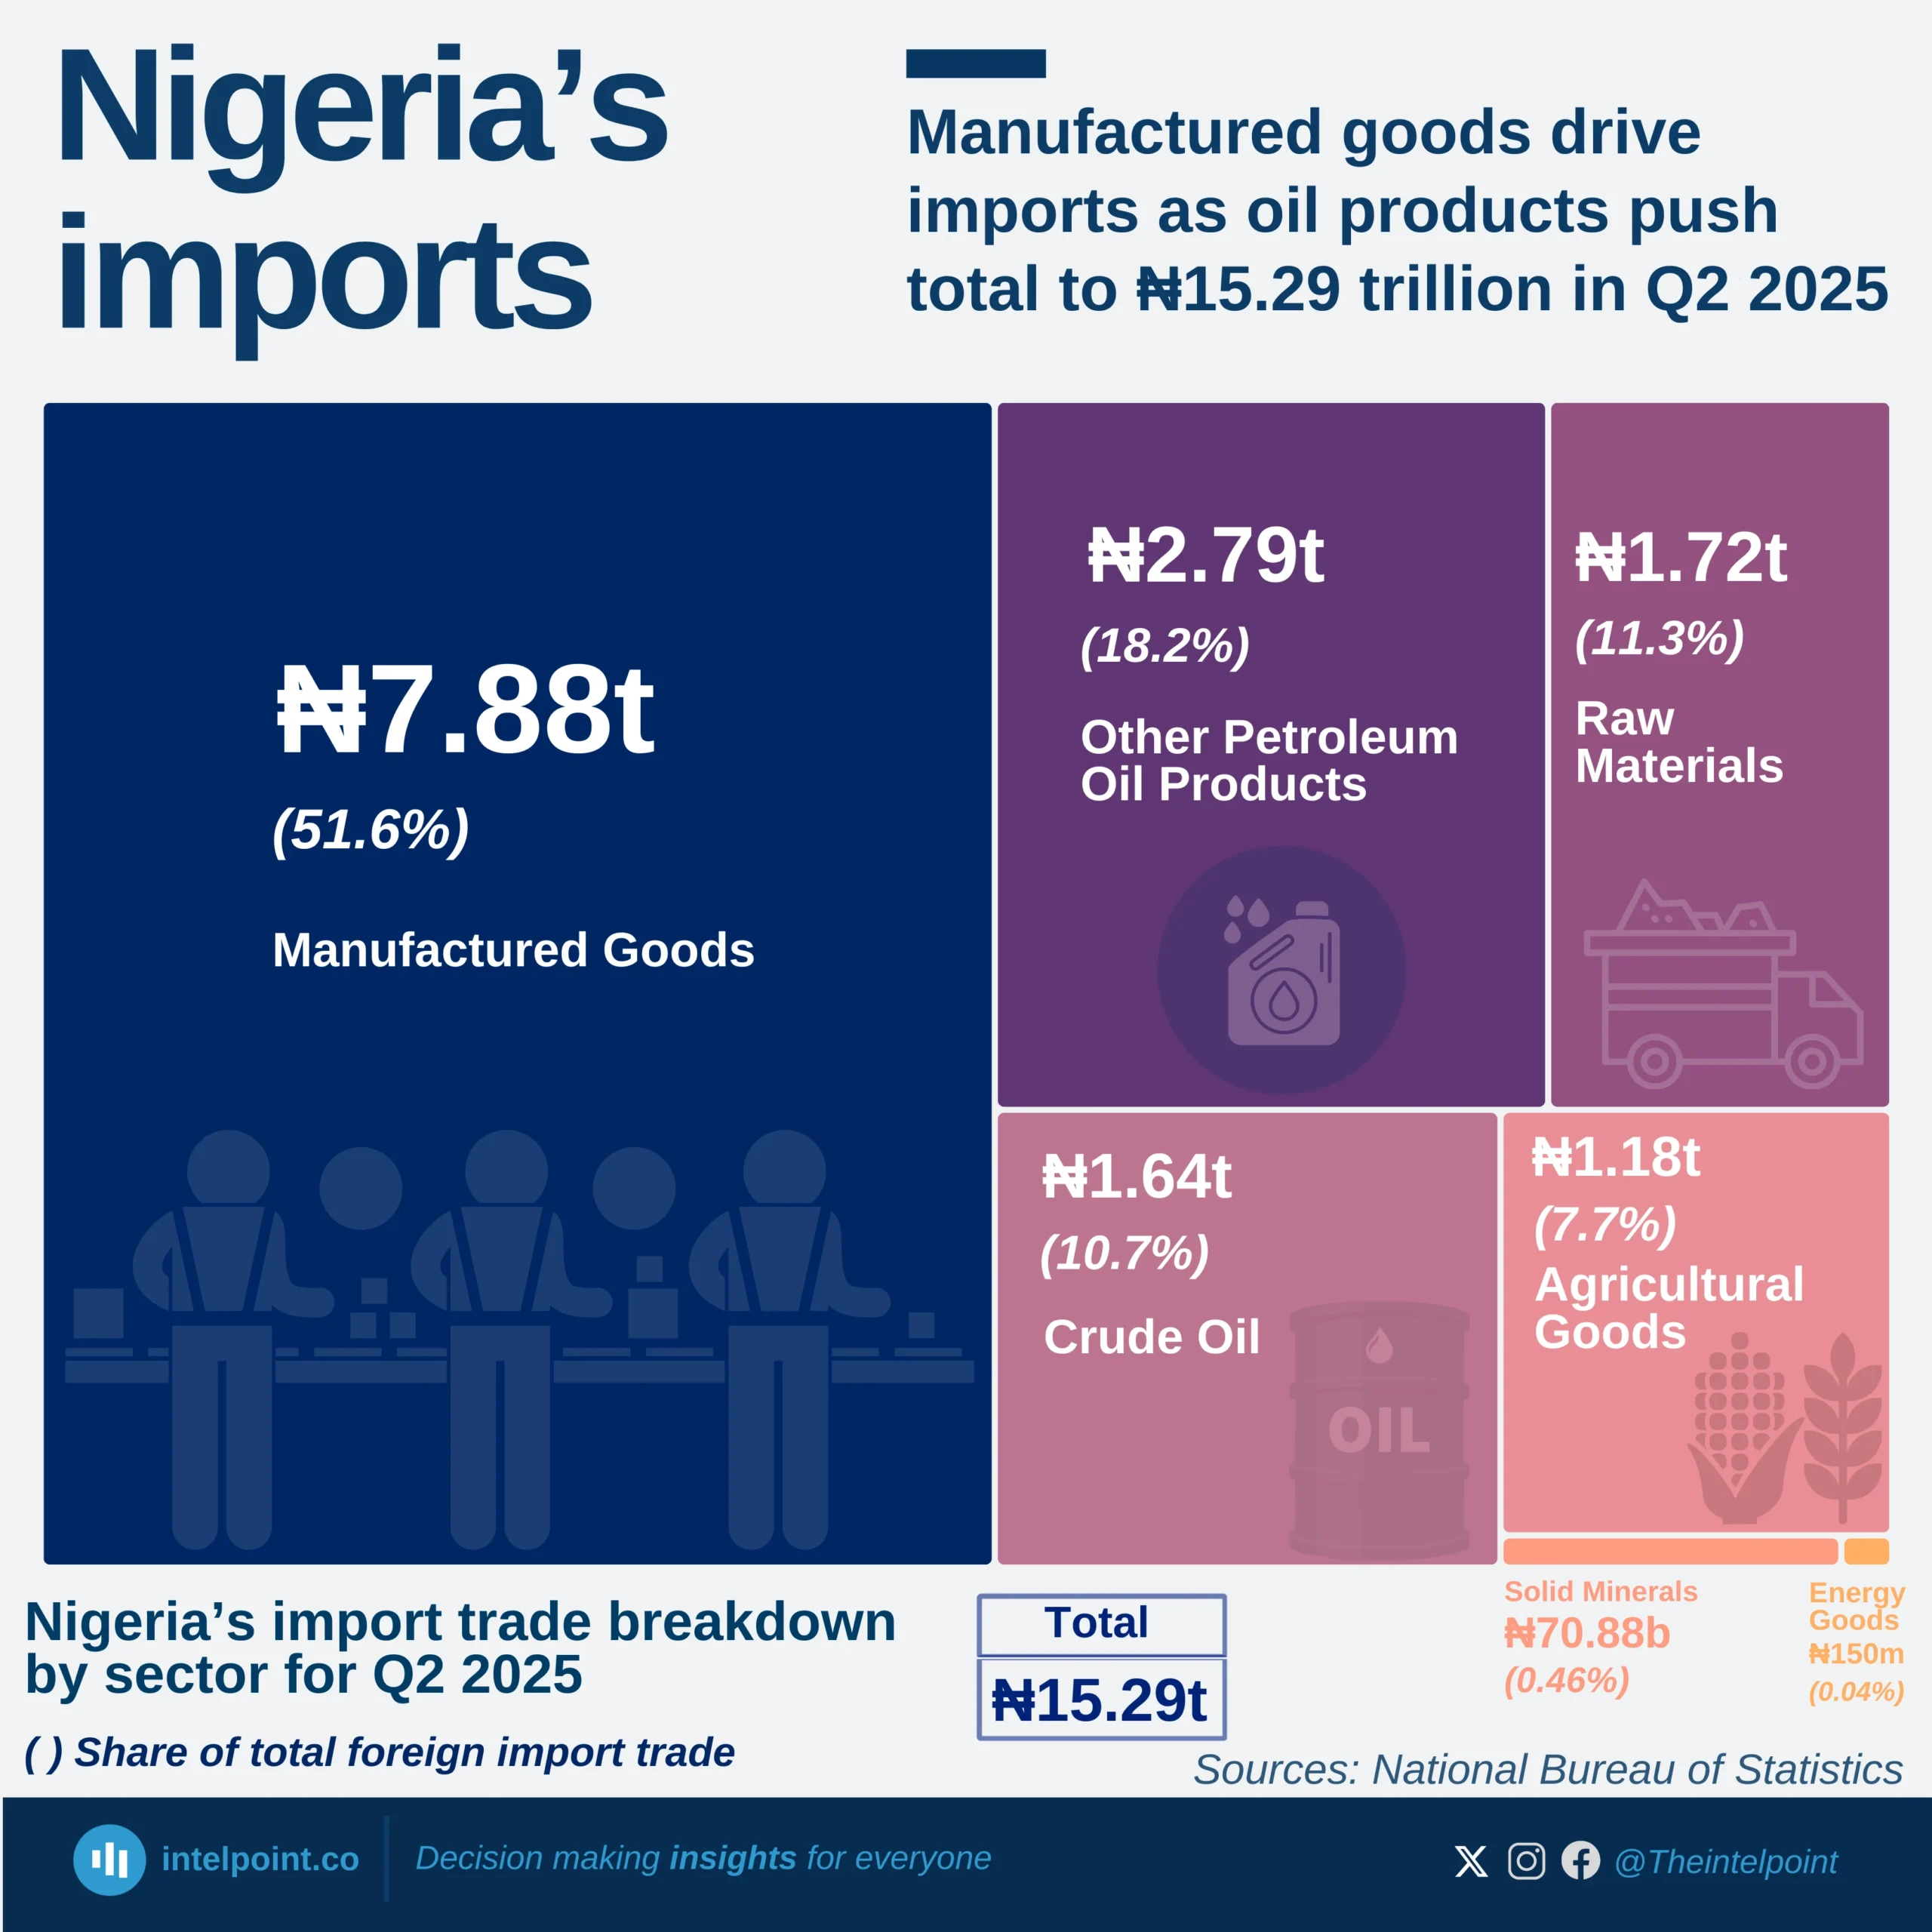
Nigeria’s import profile in Q2 2025 highlights a strong dependence on manufactured goods, which accounted for more than half of the total ₦15.29 trillion import bill. Despite being an oil producer, the country still imported ₦2.79 trillion worth of petroleum products and ₦1.64 trillion worth of crude oil, reflecting deep infrastructure gaps in refining and broader energy security challenges.

The reliance on raw material imports (₦1.72 trillion) also points to underdeveloped domestic industries that could otherwise add value locally. Meanwhile, categories like solid minerals (₦70.9 bn) and energy goods (₦150 mn) contributed little to the overall import basket.

Overall, the data paints a picture of an economy still heavily reliant on external markets for manufactured and refined goods, signalling opportunities for industrial growth, local refining capacity, and raw material processing as pathways to reduce the trade imbalance.

Source:

National Bureau of Statistics

Period:

Q2 2025
HTML code to embed chart
Want a bespoke report?
Reach out
Tags
Related Insights

Agricultural products led Kenya’s 2024 export economy, with coffee, tea, and spices generating $1.7 bn
  • Agriculture dominated Kenya’s exports, with coffee, tea, and spices alone contributing $1.7 billion, the largest single export category.
  • Mineral fuels were a surprisingly strong second, delivering $1.1 billion, and showing Kenya’s growing role in regional fuel distribution.
  • Horticultural exports (flowers, live plants, and trees) contributed $790 million, reinforcing Kenya’s global strength in floriculture.
  • All other export categories fall below $300 million individually, reflecting a long list of small but diverse export segments such as textiles, vegetables, and pharmaceuticals.

Mining led South Africa’s 2024 exports with 18.7%, as gems and precious metals generated over $20 bn
  • Gems and precious metals were the largest single export category, contributing $20.6 billion.
  • Ores and industrial minerals followed closely with $17.2 billion, showing the country’s reliance on mining.
  • Vehicles and machinery were significant non-mineral exports, with a combined $18.3 billion.
  • Agricultural and light industry products like fruits, nuts, and beverages contributed modestly, strengthening mining and manufacturing’s position as the core export drivers.

Cocoa accounted for 4.6% of Nigeria’s 2024 exports, making it the country’s second-largest export after oil
  • Mineral fuels (including crude oil) accounted for $49.3 billion, or 86.8% of total exports in 2024.
  • Non-oil exports remained marginal, with the second-largest item, cocoa, contributing only 4.6%.
  • Fertilisers, ores, slag, ash, and oilseeds collectively made up less than 5%, indicating limited diversification.
  • All other export categories each contributed 1% or less, underscoring Nigeria’s narrow export base.

Nigeria’s power grid is 69.9% powered by thermal plants
  • Thermal energy dominates Nigeria’s grid, supplying 69.9% of total power.
  • Hydro plants contribute 30.1%, making them the country’s second major source.
  • The heavy reliance on thermal generation shows Nigeria’s grid is still largely fossil-fuel driven.
  • Hydro remains a crucial but secondary source, supporting overall supply stability.

Nigeria's DisCos recorded ₦360bn revenue gap after collecting ₦1.12tn from ₦1.49tn billed in H1 2025
  • DisCos billed approximately ₦1.49 trillion but collected only ₦1.12 trillion in H1 2025.
  • Ikeja and Eko DisCos generated the highest revenues, collecting ₦206.22 billion and ₦210.59 billion, respectively.
  • Revenue collection gaps remain significant, with Jos, Kaduna, and Yola posting the weakest collection performances.
  • The wide gap between billings and actual collections suggests persistent challenges in customer payment compliance, metering, and distribution efficiency.

Nigeria has installed 3.65 million electricity metres since 2019; Ikeja DisCo leads with 823,000, and Aba Power at the bottom with 56,000
  • Approximately 3.65 million metres have been installed nationwide across all frameworks since 2019.
  • Ikeja DisCo leads by a wide margin with 823,000 installations, over twice the volume of most other DisCos.
  • Kaduna, Yola, and Aba Power recorded the lowest metre installations, each below 100,000.
  • The disparities in installation totals reveal uneven progress in achieving nationwide metering coverage.

POPULAR TOPICS
SIGN UP TO OUR NEWSLETTER
Get periodic updates about the African startup space, access to our reports, among others.
Subscribe Here
Subscription Form

A product of Techpoint Africa. All rights reserved