For every $1 Nigeria earned from exporting digital services between 2005 and 2024, it spent almost $10 on imports

  • Nigeria exported $10.81 billion in digital services between 2005 and 2024.
  • Imports during the same period reached $105.34 billion.
  • The result was a trade deficit of $94.53 billion over 20 years.
  • Exports rose from just $40 million in 2005 to $1.55 billion in 2024.
  • Imports were almost ten times larger than exports, showing a persistent imbalance.

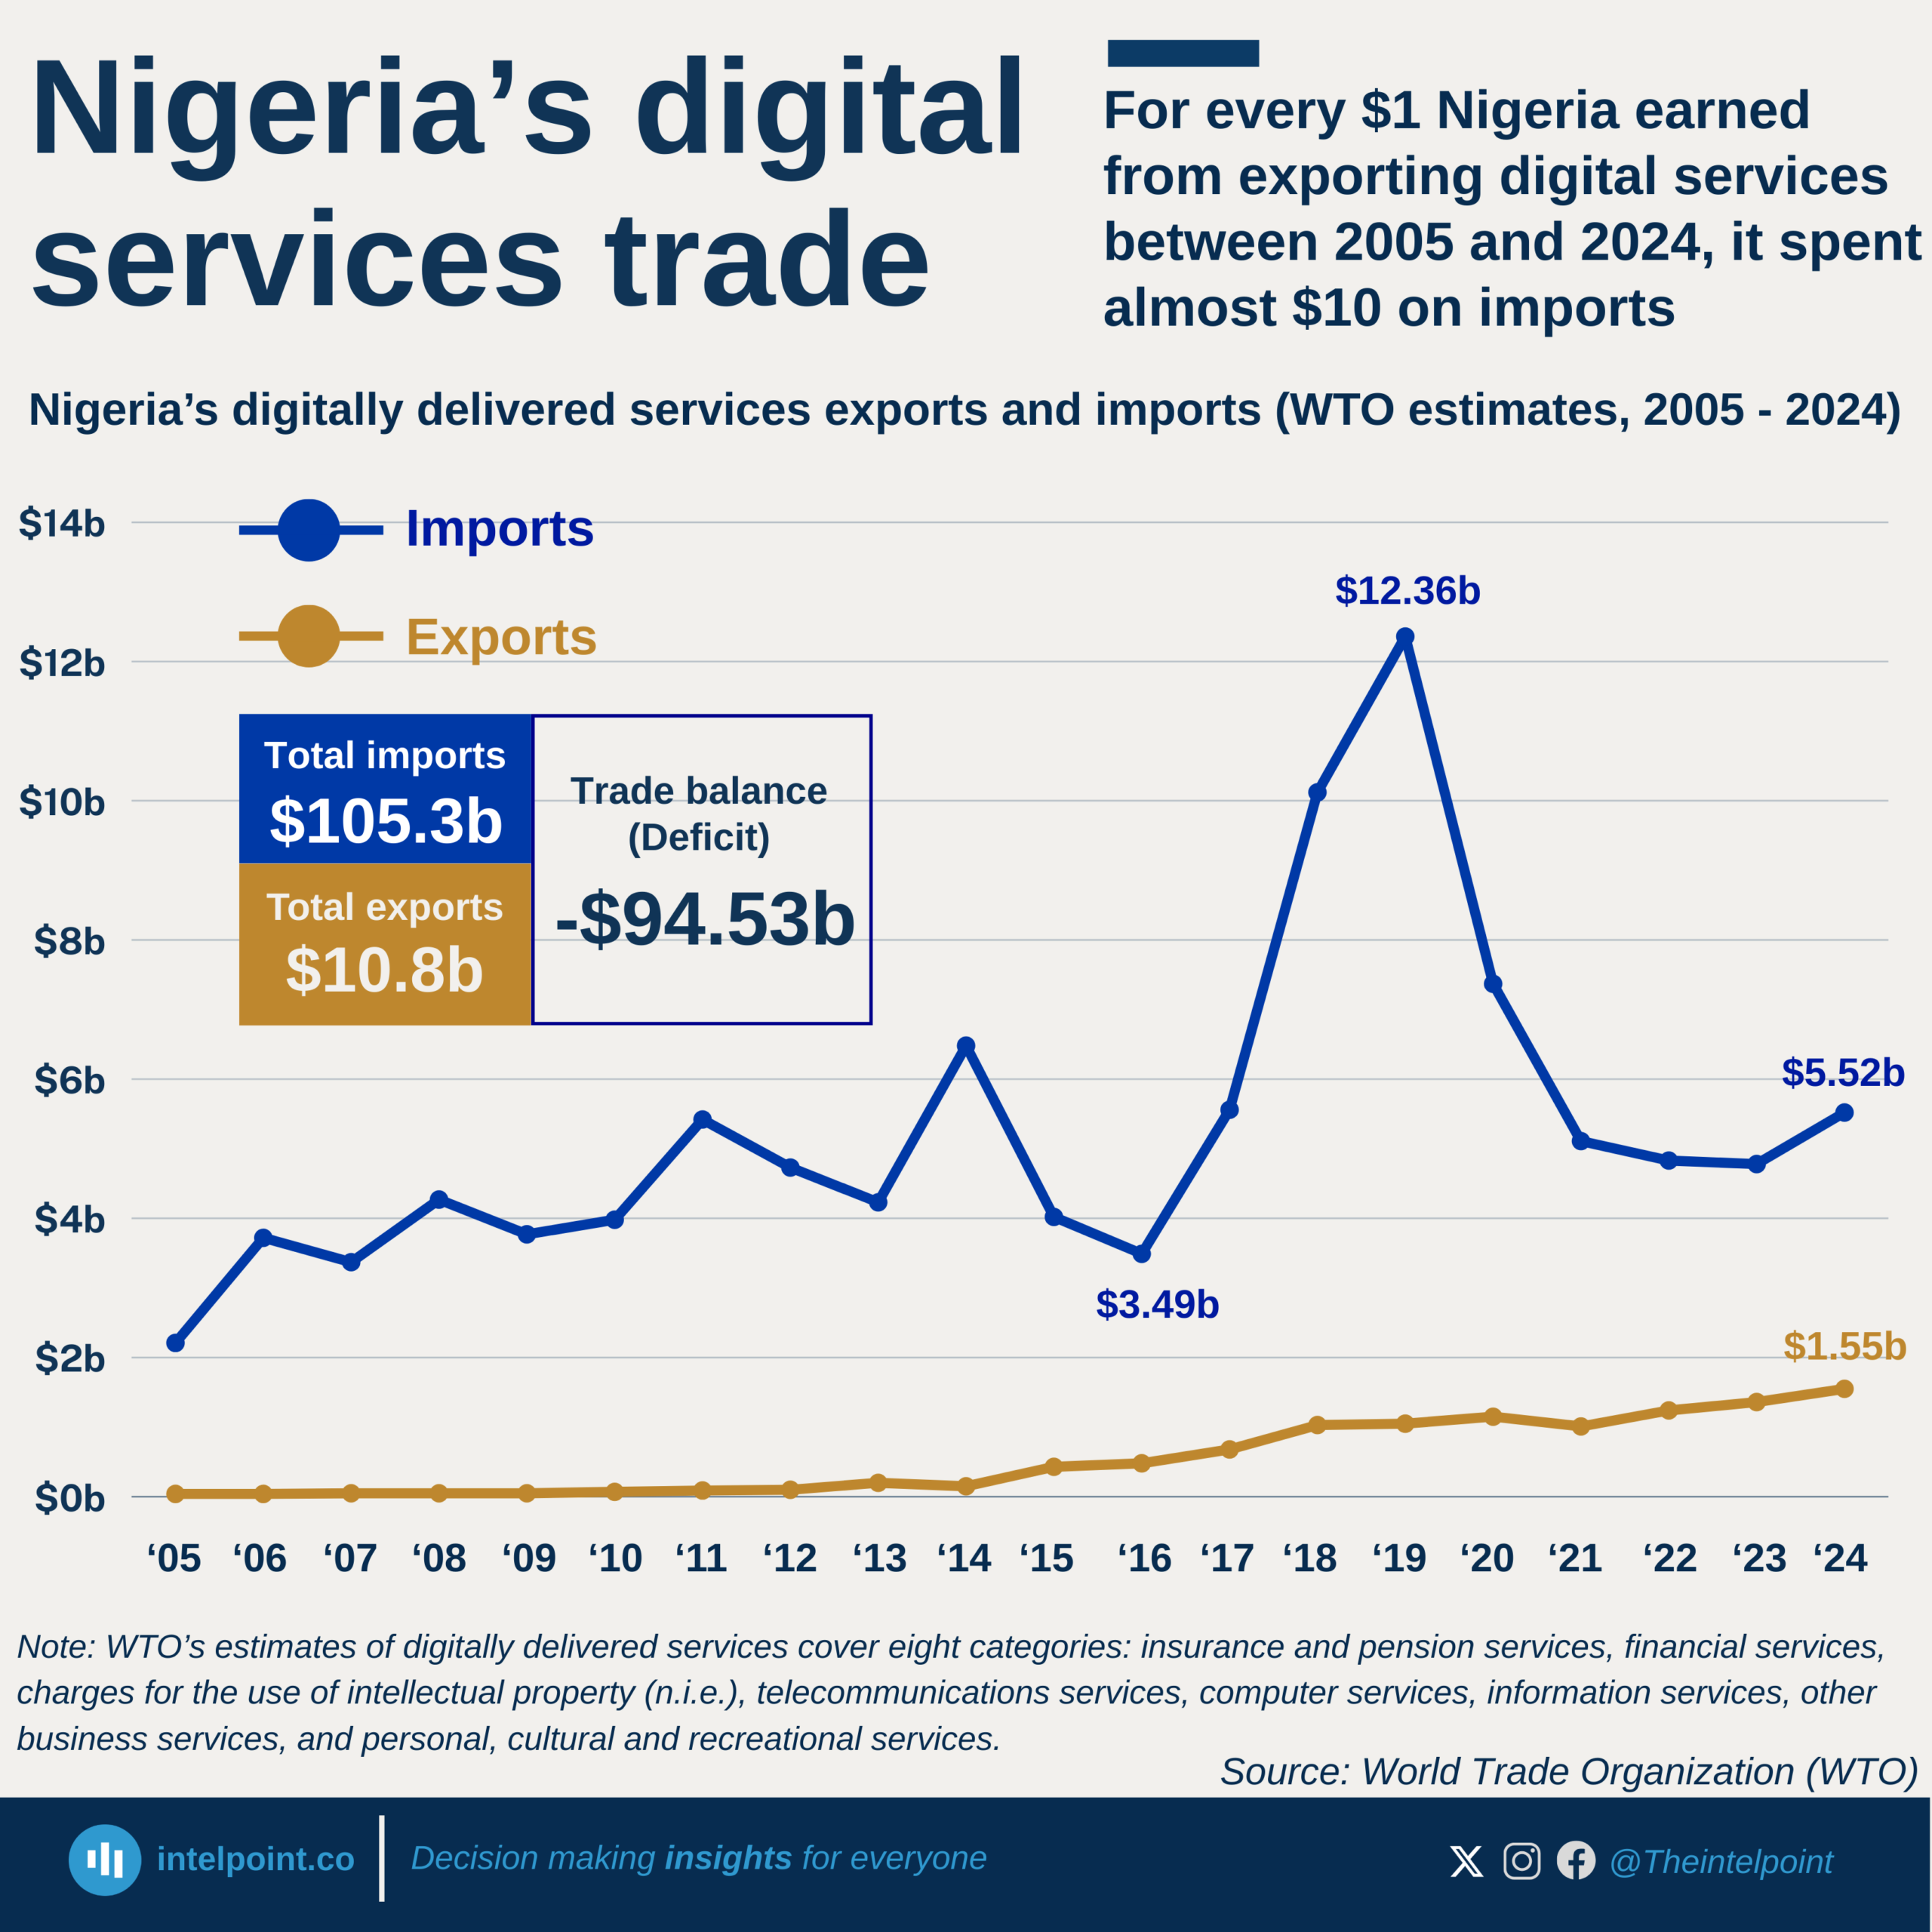
Nigeria is heavily dependent on foreign digital services and has not yet built a strong export base to compete in the global digital economy.From 2005 to 2024, Nigeria exported $10.81 billion in digital services but imported $105.34 billion, resulting in a massive trade deficit of $94.53 billion. Exports grew gradually from $40 million in 2005 to $1.55 billion in 2024, yet imports consistently outweighed them, peaking at $12.36 billion in 2019.

The widening gap reflects Nigeria's limited ability to capture value from the global digital economy.

Source:

World Trade Organization (WTO)

Period:

1970-2023
HTML code to embed chart
Want a bespoke report?
Reach out
Tags
Related Insights

China dominates Nigeria’s imports while Spain leads as top export destination in Q2 2025
  • China remains Nigeria’s largest import partner, accounting for ₦4.96T or 32.45% of total imports—more than double the U.S.'s share.
  • The United States holds second place in imports, contributing ₦2.16T (14.12%), while India, the Netherlands, and the UAE follow with smaller shares below 6%.
  • Spain tops Nigeria’s export market, receiving ₦2.47T worth of goods, representing 10.85% of total exports.
  • Europe features strongly among export partners, with Spain, France, and the Netherlands together absorbing nearly a quarter of Nigeria’s outbound trade.

Togo emerges as Nigeria’s largest African trading partner in Q2 2025
  • Togo leads on both sides of trade, supplying ₦211.99B in imports and receiving ₦811.97B in exports, making it Nigeria’s strongest African partner by value.
  • South Africa ranks second, with imports of ₦115.15B and exports of ₦473.65B, reflecting deep bilateral trade ties.
  • Côte d’Ivoire also features prominently, sending ₦106.15B worth of goods to Nigeria while importing ₦408.97B, showing balanced engagement.
  • West Africa dominates Nigeria’s intra-African trade, with Togo, Côte d’Ivoire, and Ghana collectively accounting for a significant share of regional exports.

Manufactured goods drove imports as oil products pushed total to ₦15.29 trillion in Q2 2025
  • ₦7.88 trillion worth of manufactured goods made up 51.6% of imports, underscoring Nigeria’s dependence on foreign industrial products.
  • Other petroleum oil products accounted for ₦2.79 trillion (18.2%) of imports, showing continued reliance on external energy supplies despite Nigeria’s oil-rich status.
  • ₦1.72 trillion in raw material imports (11.3%) highlights the gap in local processing capacity.
  • Solid minerals (₦70.9 bn, 0.46%) and energy goods (₦150 mn, almost 0%) show almost no role in imports.

Nigeria’s foreign trade hit ₦38 trillion in Q2 2025, driven by strong export growth
  • Total trade in Q2 2025 was valued at ₦38.04tn.
  • Imports accounted for ₦15.29tn, led by manufactured goods and petroleum products.
  • Exports reached ₦22.75tn, boosted mainly by crude oil.
  • The trade gap favoured Nigeria with a surplus of ₦7.46tn.

Morocco leads Africa in digital trade surpluses, with $26 billion 20-year cumulative gain
  • Morocco achieved the highest cumulative surplus in Africa’s digital trade at $26.4 billion between 2005 and 2024.
  • Mauritius and Tunisia followed distantly with surpluses of $8.7 billion and $4.4 billion, respectively.
  • Nigeria and Angola recorded the deepest deficits, each exceeding $90 billion cumulatively.
  • Africa’s overall digital trade balance remained negative, averaging a -$618 million deficit in 2024.
  • Smaller economies like Kenya and Togo managed modest but consistent surpluses over the years.

In 2024, Asia and Europe together accounted for 63% of the world's copper export value
  • Asia leads global copper exports with 31.6% of total export value.
  • Europe follows closely at 31.4%, making the two regions nearly equal in contribution.
  • Combined, Asia and Europe control 63% of the global copper export market.
  • Africa ranks third globally, contributing 15.3% to copper exports.
  • Oceania plays the smallest role, with just 2% of the total export value.

POPULAR TOPICS
SIGN UP TO OUR NEWSLETTER
Get periodic updates about the African startup space, access to our reports, among others.
Subscribe Here
Subscription Form

A product of Techpoint Africa. All rights reserved