Every North-East state received at least 2× what they contributed (₦46.68 billion in total), a 211.6% increase

Key Takeaways

  • The North-East remitted only ₦14.98 billion but received ₦46.68 billion, showing a 211.6% gain due to sharing.
  • Taraba, the lowest contributor (₦0.94 billion), saw the highest percentage gain (635%) with an allocation of ₦6.91 billion, reinforcing that smaller economies benefit the most from VAT sharing.
  • Bauchi, despite remitting just ₦2.44 billion, received the highest allocation (₦8.93 billion), a 266% increase, illustrating how VAT is shared based on equality and population, not economic activity.
  • Every state in the region received at least 2× what they remitted, highlighting the North East’s reliance on VAT sharing and fuelling the fiscal federalism debate on whether VAT should be retained at the state level.

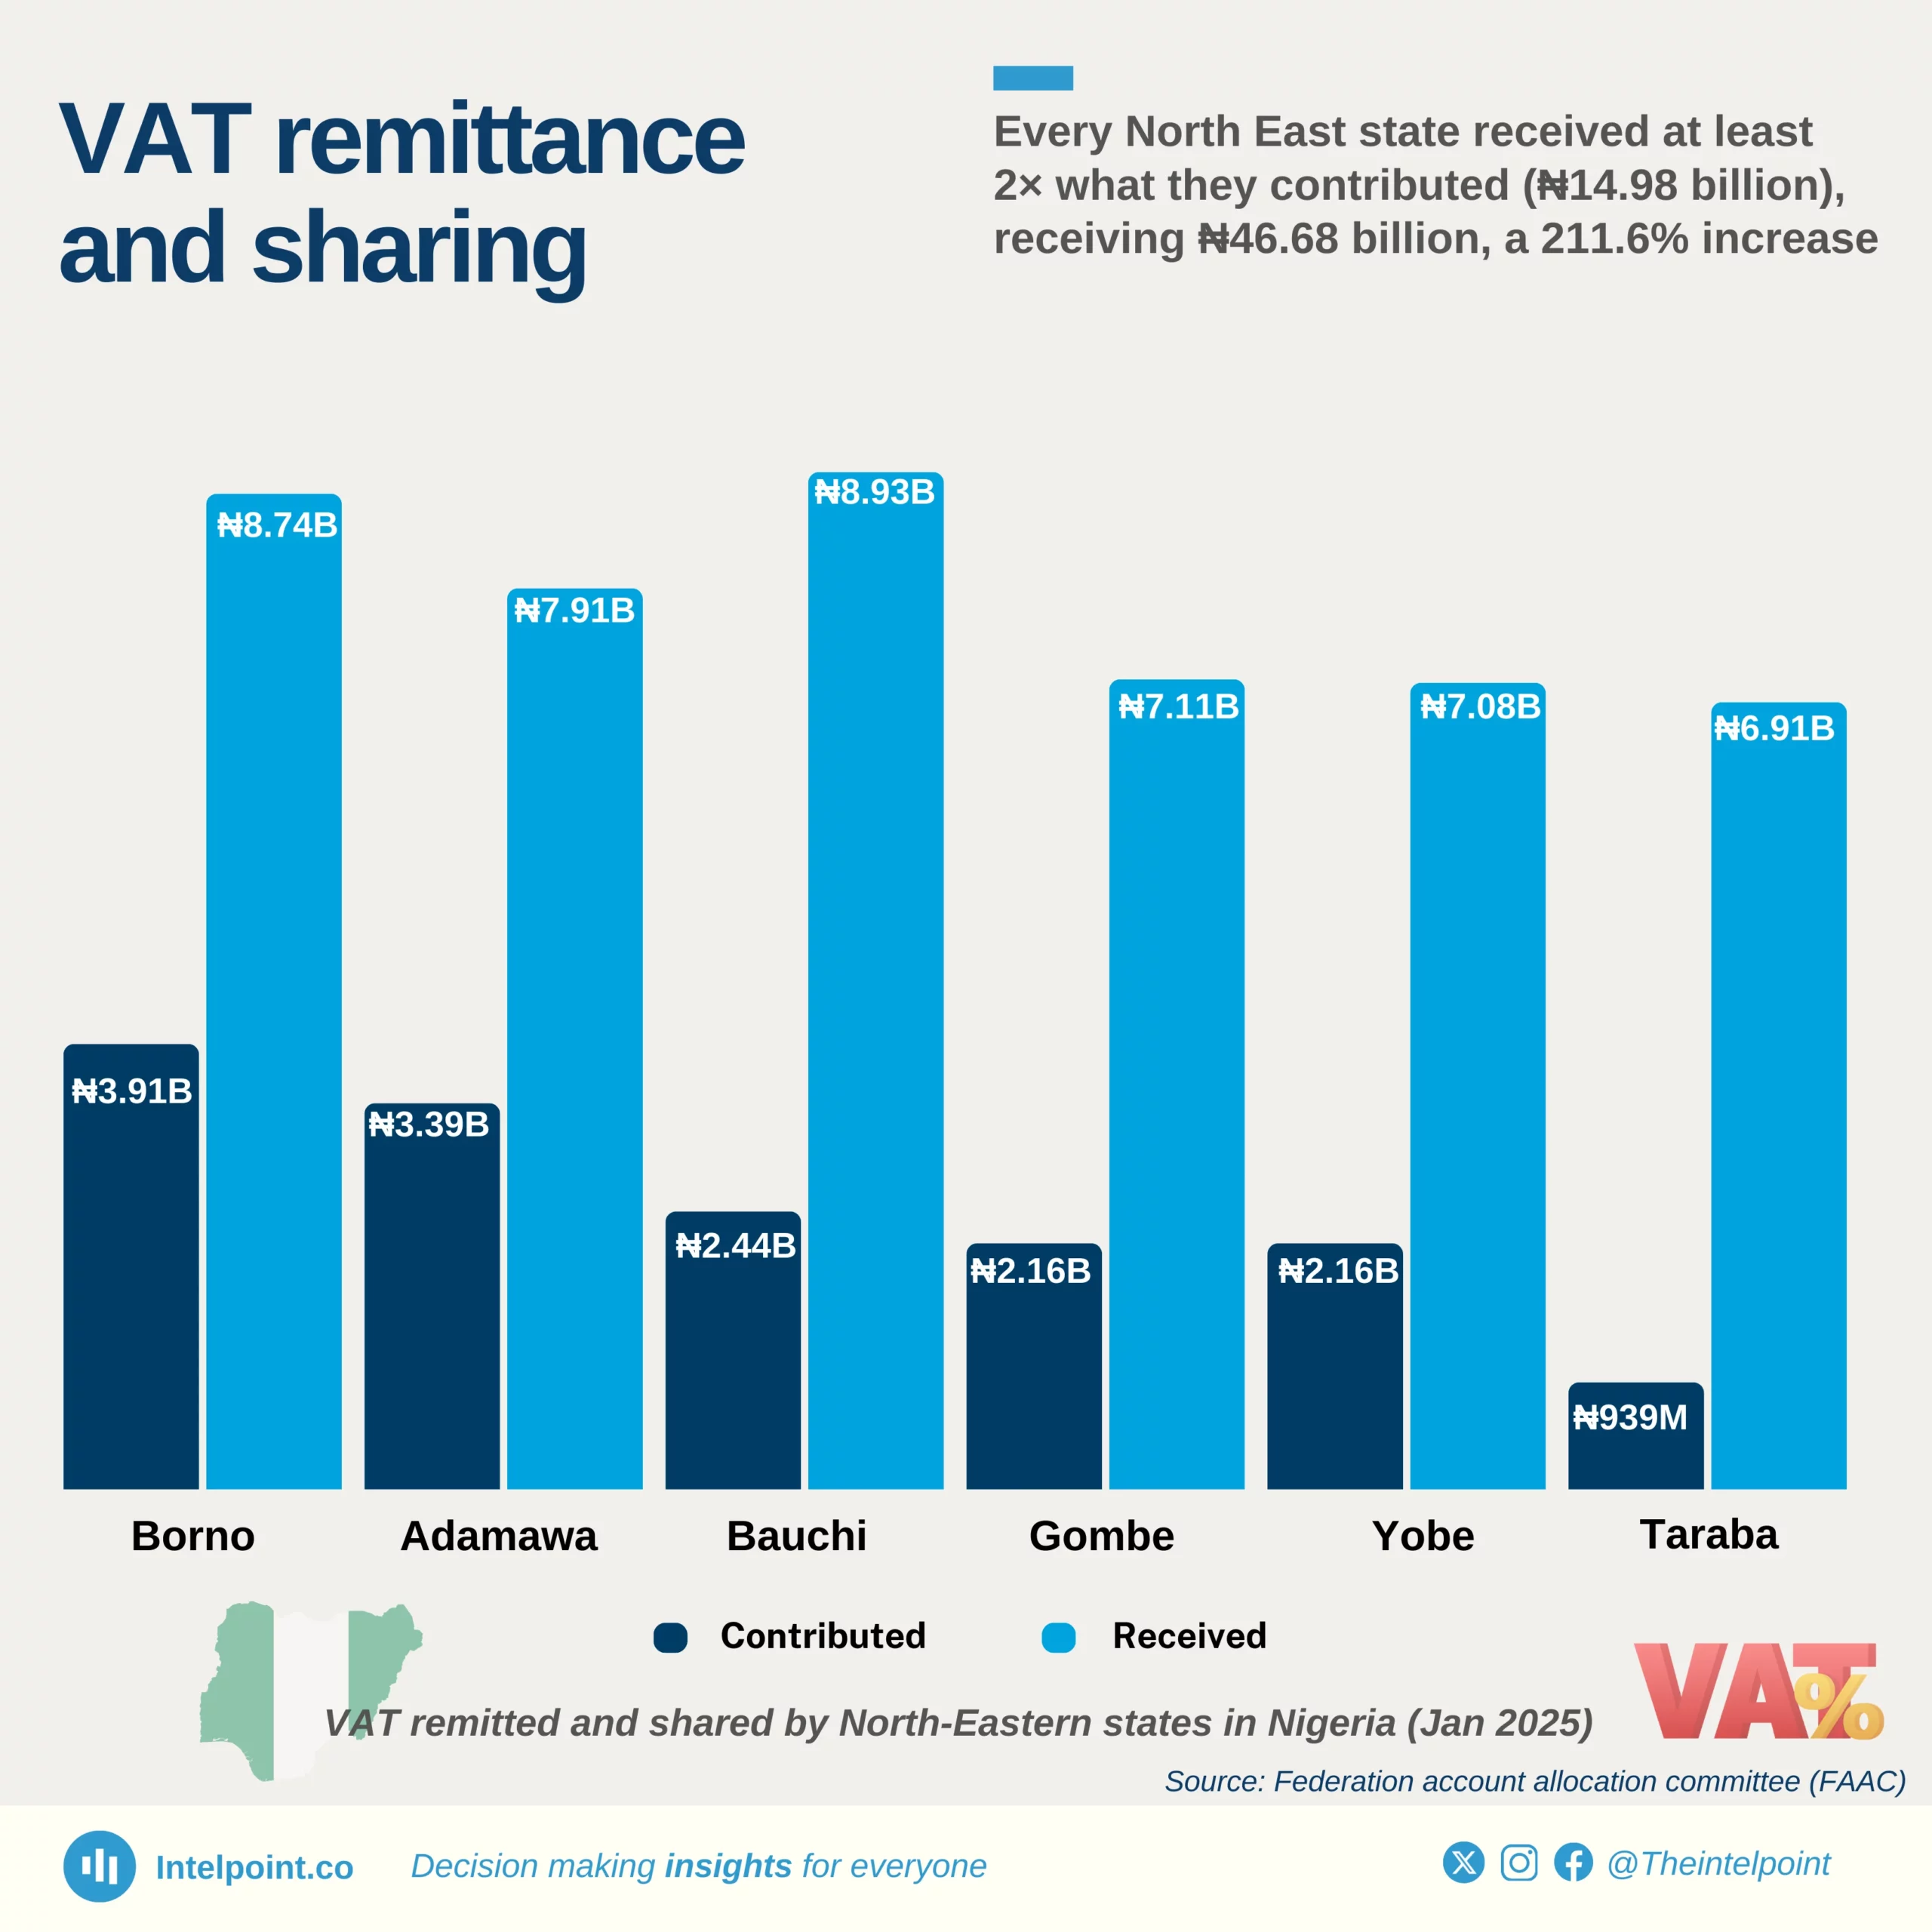
The VAT remittance and sharing pattern in the North-East geopolitical zone of Nigeria reveals a significant reliance on the federal VAT sharing system. The six states collectively remitted ₦14.98 billion but received an allocation of ₦46.68 billion, representing a 211.6% increase in revenue through federal allocation. This trend showcases how the VAT sharing formula, which prioritises equality and population over direct revenue generation, disproportionately benefits states with lower economic activity.

Borno led remittance with ₦3.91 billion (26.1% of the zone’s total VAT), yet it received ₦8.74 billion, a 123% gain. However, the biggest beneficiary in terms of percentage increase was Taraba, which remitted the least (₦0.94 billion, just 6.3% of the total) but received ₦6.91 billion, a massive 635% increase. Bauchi, despite contributing only ₦2.44 billion, received the highest allocation in the region at ₦8.93 billion, a 266% boost, further confirming that VAT allocation is based on sharing metrics beyond just remittance levels.

With every state in the North-East receiving at least double their remittance, this shows a significant fiscal imbalance that continues to drive ongoing discussions about VAT decentralisation. As high revenue states push for VAT retention at the source, states in regions like the North-East, which benefit significantly from sharing, may face economic pressure if the system is altered.

Source:

Federal account allocation committee (FAAC)

Period:

January 2025
HTML code to embed chart
Want a bespoke report?
Reach out
Tags
Related Insights

Road accidents in Nigeria (Q3 2020-Q3 2024)
  • Road accidents declined by 53% between Q3 2020 and Q3 2024.
  • Q4 2022 recorded the highest number of accidents, with 4,835 reported cases.
  • Q3 2024 had the lowest number, with just 1,945 accidents.
  • Speed violation remains the leading cause of road accidents in Nigeria.
  • Ogun, FCT, Kaduna, and Nasarawa consistently rank among the top four states with the highest accident occurrences.
  • Bayelsa, Borno, Imo, Rivers, and Akwa Ibom regularly report the lowest number of accidents each quarter.
  • Commercial vehicles are the most frequently involved vehicle category in accidents.
  • Cars account for the highest number of individual vehicle accidents.

Top 10 Nigerian states with the highest number of road accidents (Cumulative, Q3 2020-Q3 2024)
  • The Federal Capital territory (FCT) recorded the highest number of road accidents between Q3 2020 and Q3 2024, with a total of 8,133 accidents, accounting for 12.42% of total accidents.
  • FCT, Ogun, Nasarawa, and Kaduna consistently ranked among the top four states with the highest accident occurrences.
  • Bayelsa, Borno, Akwa Ibom, Rivers, and Imo were among the states with the lowest number of recorded accidents each quarter.

After its peak ($8.9b) in 2011, Nigeria's FDI declined almost every year to its lowest ($780m) in 2018, a 91% decline
  • FDI inflows peaked in 2011 at $8.91 billion, the highest in the 35-year period.
  • Between 2005 and 2012, Nigeria saw a sustained boom in FDI, with seven consecutive years above $4 billion.
  • In 2018, Nigeria recorded its lowest FDI inflow in decades at just $0.78 billion.
  • By 2024, FDI stood at $1.08 billion, down 88% from its 2011 peak, reflecting declining investor interest or changing investment climates.

The South West got ₦1 back for every ₦3.60 in VAT, while the North West received ₦2.60 for every ₦1 contributed
  • The South West generated ₦929.86B, over half of Nigeria’s total VAT, but received only ₦258.19B, amounting to ₦1 back for every ₦3.60 contributed.
  • The North West contributed just ₦68.05B but received ₦176.73B, meaning it got back ₦2.60 for every ₦1 generated.
  • The South South, the second-highest contributor at ₦364.99B, got back ₦171.18B, just ₦1 for every ₦2.13 generated.
  • The three southern zones together contributed ₦1.32 trillion in VAT, nearly 90% of the national total, but received less than half of it back.
  • Zones with the lowest generation (North East and South East) received 3 to 4 times their contributions.

Lagos generated ₦819.6 billion in VAT in Q1 2025, nearly triple Rivers and more than 10 times any other state
  • Lagos led the nation with ₦819.62B VAT, over 45% of the total generated by all 36 states combined.
  • Rivers followed distantly with ₦278.23B, around 34% of Lagos’s VAT haul.
  • Only five states (Lagos, Rivers, Oyo, Bayelsa, Kano) generated over ₦21B in Q1 2025.
  • 22 states generated below ₦10B, with 13 of them earning less than ₦6B in VAT.
  • Northern states like Katsina (₦5.96B), Yobe (₦5.81B), and Kebbi (₦5.13B) trail significantly in VAT contributions.
  • Abia, Cross River, Imo, and Taraba sit at the bottom, each with under ₦3B in VAT returns.

2025 sees unprecedented surge as 17,000 candidates score above 300 in JAMB; highest in 13 years
  • No candidate scored above 300 until 2015, with just 40 high scorers that year out of over 1.46 million candidates.
  • 2025 marked the highest ever with 17,025 candidates scoring above 300, nearly double the count in 2024 and more than triple 2023.
  • From 2022 to 2025, above-300 scorers consistently remained over 5,000 each year, showing a steady rise in top scores.
  • Despite the growth in numbers of JAMB candidates, high scorers still make up less than 1% annually.

POPULAR TOPICS
SIGN UP TO OUR NEWSLETTER
Get periodic updates about the African startup space, access to our reports, among others.
Subscribe Here
Subscription Form

A product of Techpoint Africa. All rights reserved