DR Congo has the lowest debt-to-GDP ratio in Africa (11.1%), significantly below the 63.2% average

  • DR Congo has the lowest debt-to-GDP ratio in Africa, at just 11.1%.
  • Africa’s average debt-to-GDP ratio stands at 63.2%, meaning most countries on the bottom 10 list are performing better than the continental average.
  • Nigeria, despite its size and challenges, still maintains a relatively moderate debt load of 41.3%.
  • Botswana’s debt ratio of 18.1% places it among Africa’s most fiscally conservative economies.
  • Ethiopia and Guinea, both undergoing major economic transitions, still keep debt levels below 32%.
  • The presence of both low-income and resource-rich countries on the list shows that low debt isn’t exclusive to one economic model.

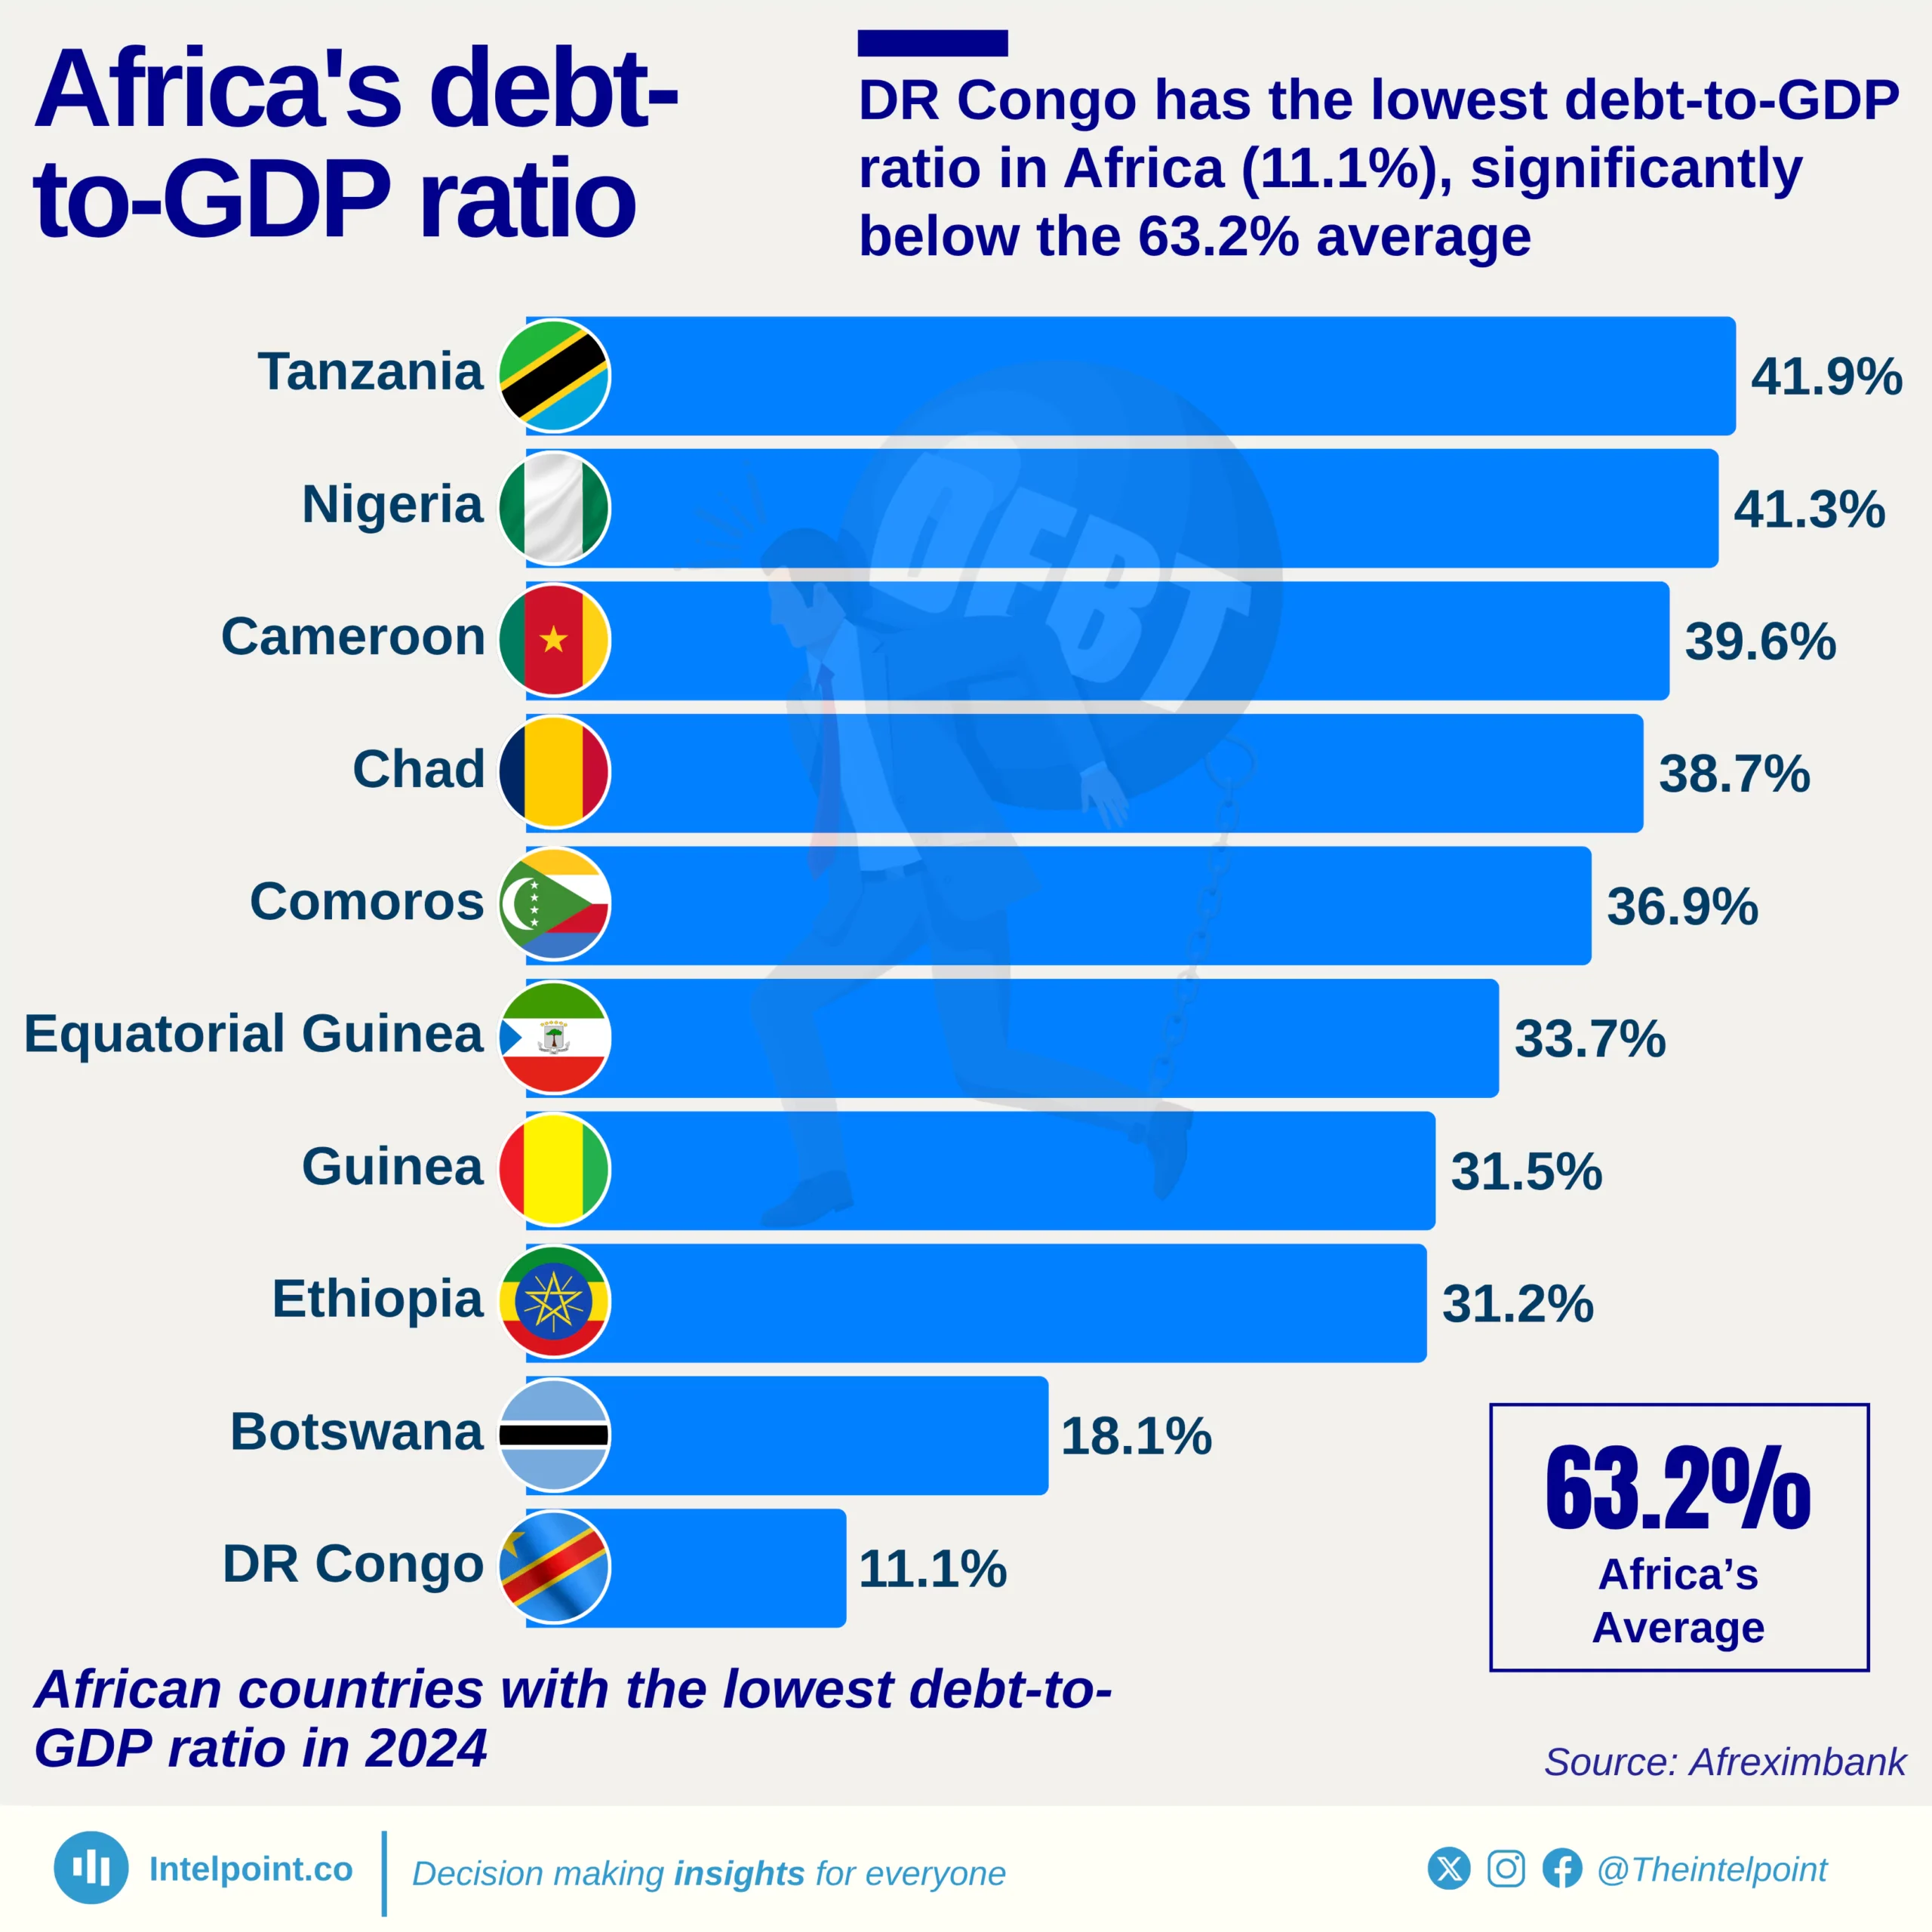
Africa’s debt profile varies widely across countries. Leading in low debt-to-GDP ratio is the Democratic Republic of Congo, with a strikingly low debt-to-GDP ratio of just 11.1%—far below the continental average of 63.2%. This implies that DR Congo’s public debt is relatively minimal compared to the size of its economy, giving it greater fiscal flexibility compared to its heavily indebted peers.

Other countries, such as Botswana (18.1%), Ethiopia (31.2%), and Guinea (31.5%), also maintain relatively low debt levels. While this doesn't automatically mean these economies are stronger, it suggests they may be under less pressure from debt servicing costs. Notably, Nigeria, despite being one of Africa’s largest economies, still maintains a modest debt-to-GDP ratio of 41.3%, slightly below Tanzania at 41.9%. These figures show that having a large economy doesn't necessarily mean having higher debt burdens.

Source:

Afreximbank

Period:

2024
HTML code to embed chart
Want a bespoke report?
Reach out
Tags
Related Insights

South Africa’s share of Africa’s GDP has averaged 20% since 1960, peaking in early 1990s
  • South Africa’s share of Africa’s GDP has averaged around 20% since 1960.
  • The country’s relative dominance peaked in the early 1990s at nearly 28% of continental GDP.
  • Nominal GDP grew steadily from $8.7 billion in 1960 to over $400 billion in 2024.
  • South Africa’s share of Africa’s GDP has generally declined in recent decades as other African economies expanded faster.
  • Despite the relative decline, South Africa remains one of Africa’s largest and most influential economies.

Nigeria’s slice of Africa’s economy since independence: From a peak of 31% to 7% in 2024
  • At independence in 1960, Nigeria contributed about 10% of Africa’s GDP, establishing itself early as one of the continent’s largest economies.
  • Nigeria’s share peaked at 31% in 1981 during the oil boom, highlighting the dramatic impact of natural resources on the economy.
  • Between the mid-1980s and 2000s, Nigeria’s share fluctuated significantly, dropping to 9.2% in 1999 due to political instability, economic mismanagement, and external shocks.
  • By 2024, Nigeria’s share fell to 7.1%, despite a GDP of $187.8 billion, showing slower relative growth compared to other African economies and the ongoing need for economic diversification.
  • This share reflects Nigeria’s relative position in Africa’s economy over time, showing how it moved in relation to the growth of the rest of the continent.

From 2013 to 2024, the Services sector has consistently dominated Ghana’s GDP, while Agriculture has remained the smallest sector
  • From 2013 to 2024, the services sector has consistently dominated Ghana’s GDP, while agriculture has remained the smallest sector.
  • A weak agriculture sector can make Ghana more dependent on food imports.
  • Agriculture’s stagnation reduces its role as a labour buffer.

Nigeria’s slice of Africa’s economy since independence: From a peak of 31% to 7% in 2024
  • At independence in 1960, Nigeria contributed about 10% of Africa’s GDP, establishing itself early as one of the continent’s largest economies.
  • Nigeria’s share peaked at 31% in 1981 during the oil boom, highlighting the dramatic impact of natural resources on the economy.
  • Between the mid-1980s and 2000s, Nigeria’s share fluctuated significantly, dropping to 9.2% in 1999 due to political instability, economic mismanagement, and external shocks.
  • By 2024, Nigeria’s share fell to 7.1%, despite a GDP of $187.8 billion, showing slower relative growth compared to other African economies and the ongoing need for economic diversification.
  • This share reflects Nigeria’s relative position in Africa’s economy over time, showing how it moved in relation to the growth of the rest of the continent.

Trade and agriculture led Nigeria’s ₦51.20 trillion economy in Q2 2025, as oil’s share remained modest
  • Trade contributed 18.28%, making it the largest sector in Q2 2025's GDP.
  • Crop production followed with 17.8%, underscoring agriculture’s central role.
  • Oil and gas added just 4.05%, highlighting its shrinking share compared to non-oil sectors.
  • Real estate and telecoms reinforced the growing strength of services in the Nigerian economy.

Nigeria has paid $57.67 billion in external debt interest in 54 years, with payments rising 1,140% since 2009
  • Nigeria spent $57.67B on external debt interest from 1970 to 2023.
  • Payments were low initially but rose steadily as borrowing increased.
  • In the 1990s, interest payments fluctuated due to debt rescheduling and restructuring agreements.
  • In 2005, payments jumped to $5.31B following a strategic debt buyback that accelerated obligations.
  • Annual payments climbed 1,139.6%, from $0.31B to $3.79B, showing rising debt service costs.

POPULAR TOPICS
SIGN UP TO OUR NEWSLETTER
Get periodic updates about the African startup space, access to our reports, among others.
Subscribe Here
Subscription Form

A product of Techpoint Africa. All rights reserved