Angola's debt burden reached a new peak in 2024, with its debt service hitting 68.3% of GDP

  • Debt service in Angola hit 68.3% of GDP in 2024.
  • Even with a projected fall to 67.7% in 2025, the debt burden remains high.
  • Between 2009 and 2025, the debt service ratio grew at a CAGR of 11.2%.
  • The ratio stayed below 15% from 2009 to 2014 before surging to 41.9% in 2016.
  • Angola has faced multiple spikes above 50% since 2019, showing recurring debt strain.
  • The sharp drop to 31.2% in 2022 was short-lived, followed by a steep increase.

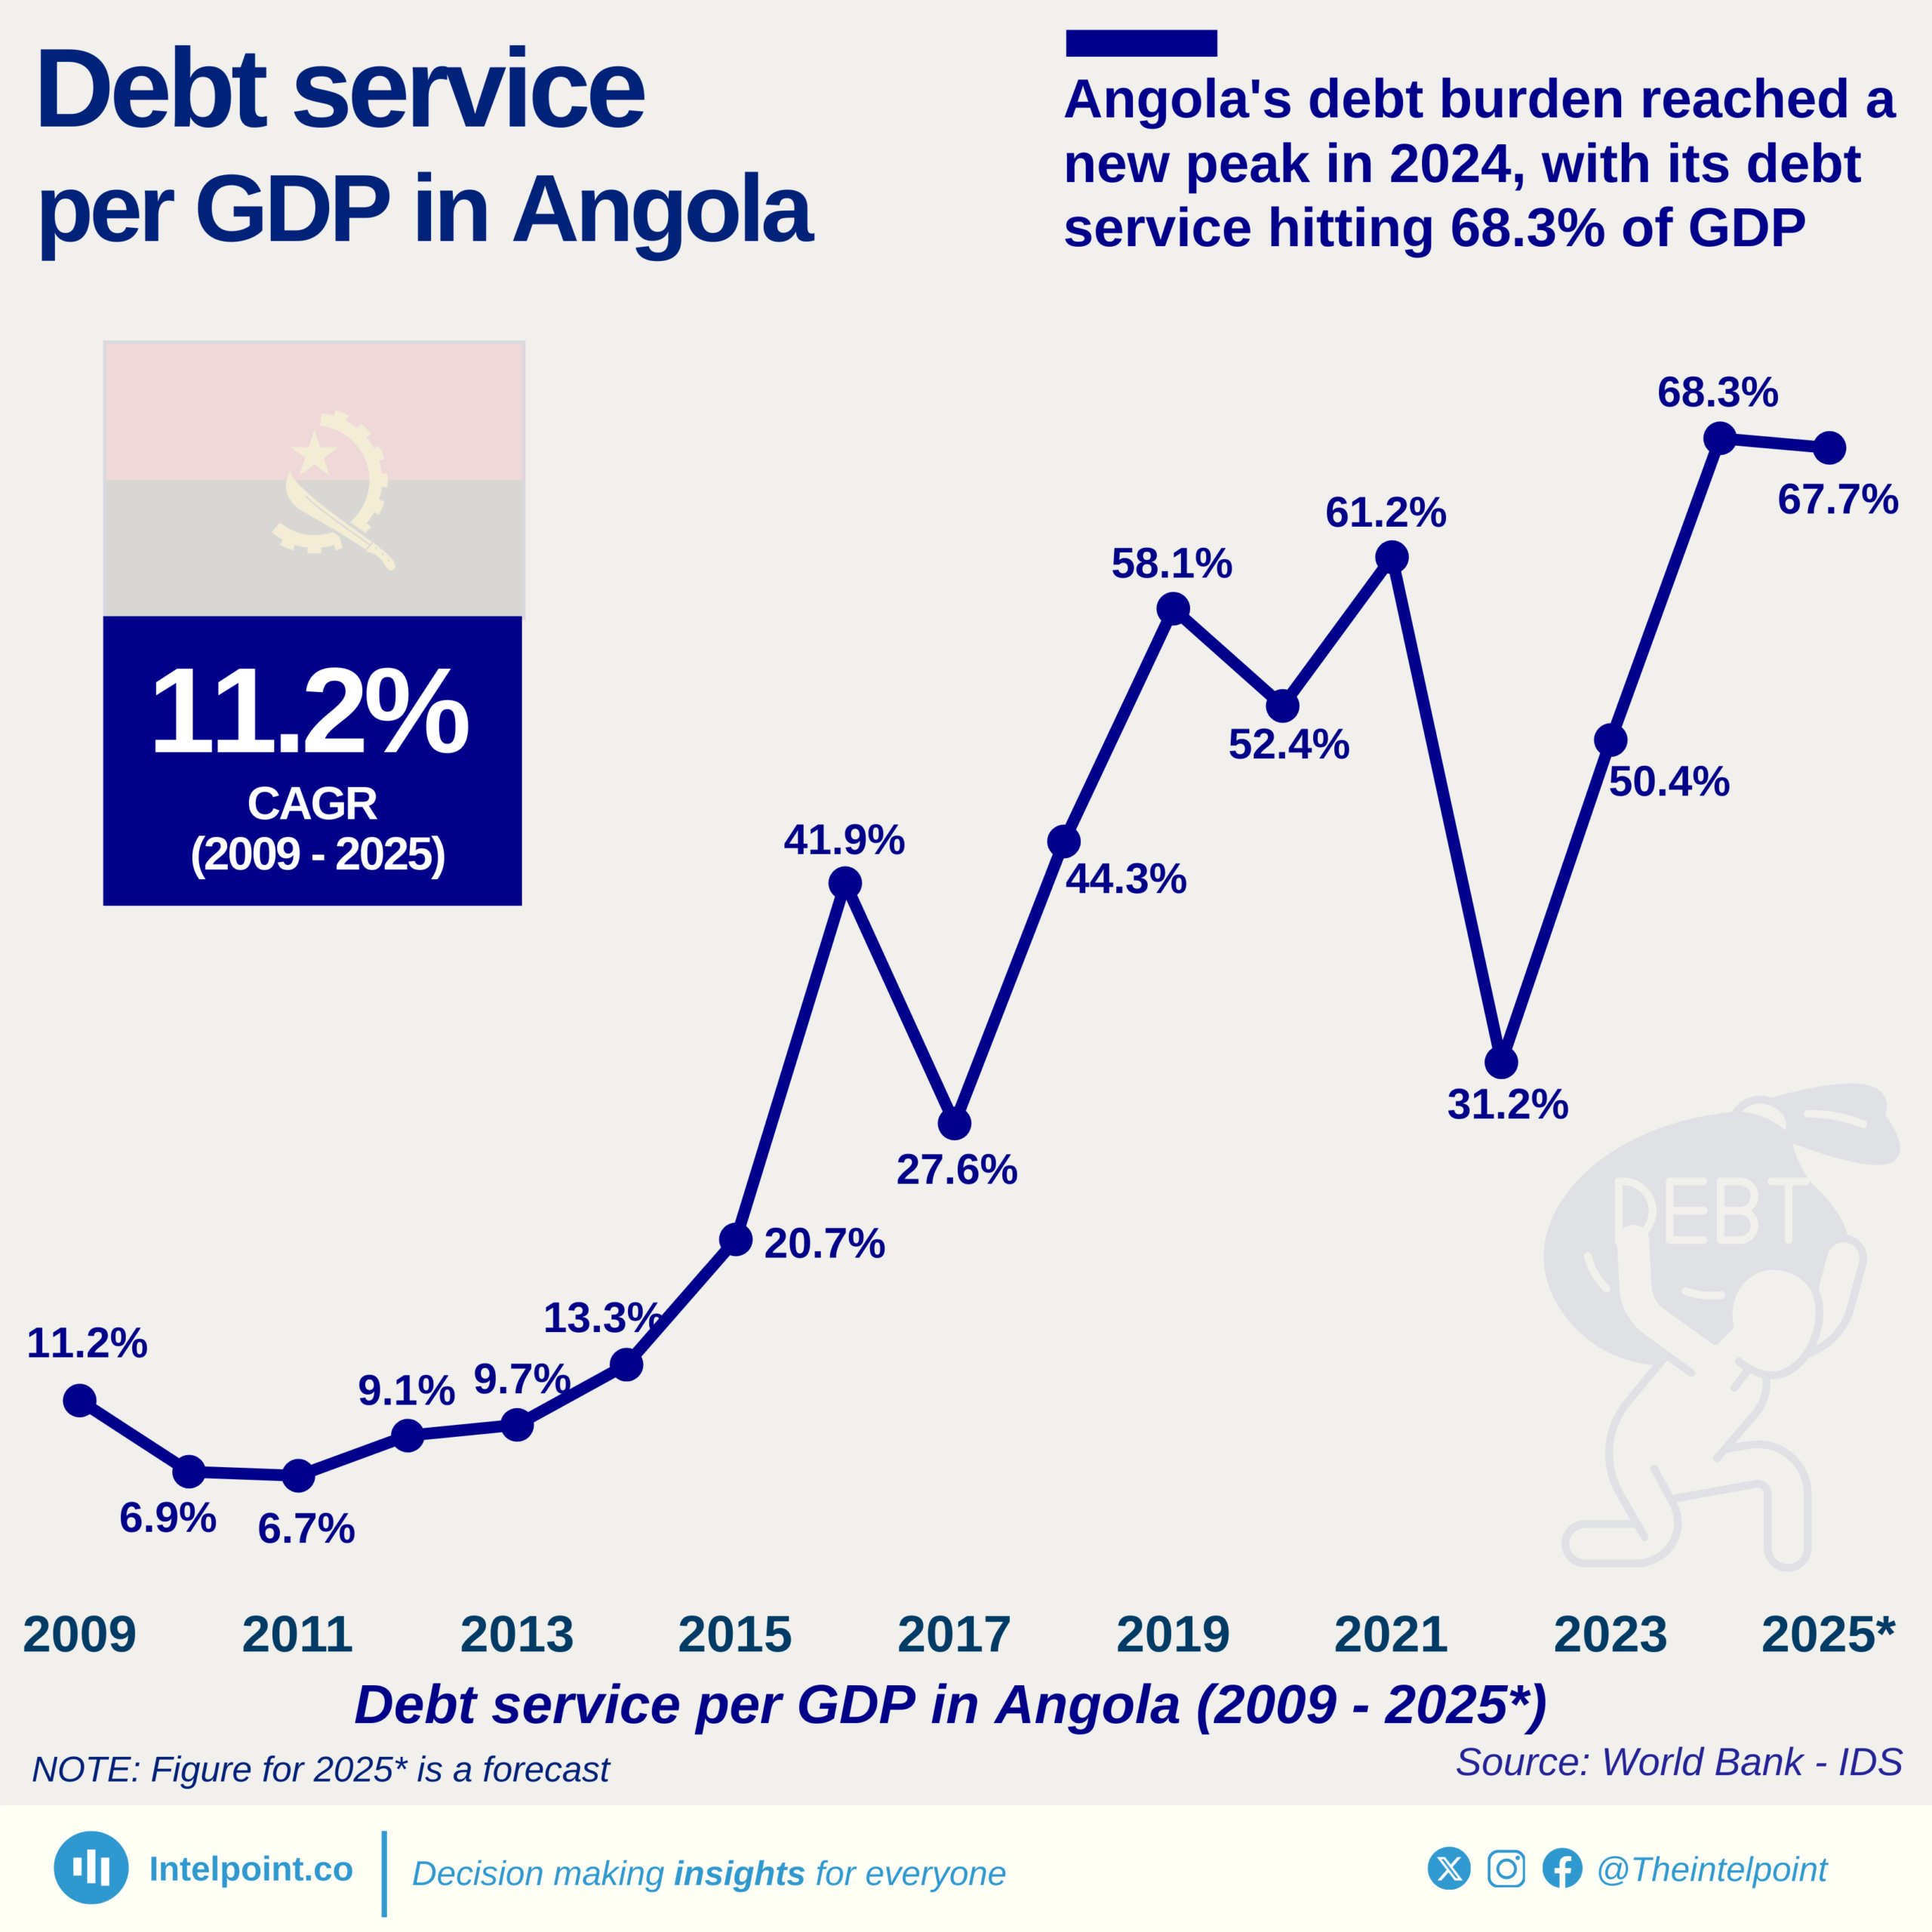
Angola’s debt reached an all-time high of 68.3% of GDP in 2024. Even with a slight projected dip to 67.7% in 2025, the country remains in a position where more than two-thirds of its GDP goes into servicing debt, the highest ratio in Africa.

The chart also shows that Angola’s debt service ratio has not been a steady climb, but rather a series of sharp spikes and drops. After years of moderate levels (under 15%) from 2009 to 2014, the figure more than tripled between 2014 and 2016, hitting 41.9% in 2016. The years since then have been marked by volatility, with multiple jumps above 50%.

Source:

World Bank - IDS

Period:

2009-2025
HTML code to embed chart
Want a bespoke report?
Reach out
Tags
Related Insights

Trade and agriculture led Nigeria’s ₦51.20 trillion economy in Q2 2025, as oil’s share remained modest
  • Trade contributed 18.28%, making it the largest sector in Q2 2025's GDP.
  • Crop production followed with 17.8%, underscoring agriculture’s central role.
  • Oil and gas added just 4.05%, highlighting its shrinking share compared to non-oil sectors.
  • Real estate and telecoms reinforced the growing strength of services in the Nigerian economy.

Nigeria has paid $57.67 billion in external debt interest in 54 years, with payments rising 1,140% since 2009
  • Nigeria spent $57.67B on external debt interest from 1970 to 2023.
  • Payments were low initially but rose steadily as borrowing increased.
  • In the 1990s, interest payments fluctuated due to debt rescheduling and restructuring agreements.
  • In 2005, payments jumped to $5.31B following a strategic debt buyback that accelerated obligations.
  • Annual payments climbed 1,139.6%, from $0.31B to $3.79B, showing rising debt service costs.

Morocco’s GDP per capita has more than doubled since 2000, reaching a new high ($3,993) in 2024
  • Morocco’s GDP per capita has shown a fluctuating pattern in the last 25 years, with periods of steady growth and also fall.
  • The years 2003–2008 stand out as a high-growth phase, with GDP per capita rising rapidly from $1,941.9 to $3,183.2.
  • In 2021, a dramatic 15.9% rebound took GDP per capita up to $3,785.9.
  • In 2024, nominal GDP per capita stood at $3,993.4.
  • The last 25 years depict a more than twofold increase in Morocco’s GDP per capita, moving from $1,499.1 to $3,993.4.

South Africa’s GDP per capita has grown in 21 of the past 24 years, climbing to a record high in 2024
  • South Africa’s GDP per capita rose from $440 in 2000 to an all-time high of $2,692 in 2024.
  • Growth was relatively steady in the 2000s, with notable jumps after 2006 and again in the post-pandemic years.
  • Despite dips in 2008 (global financial crisis) and 2020 (COVID-19 shock), the economy showed resilience with quick rebounds.
  • By 2024, South Africa achieved its strongest per capita GDP on record, cementing its role as one of Africa’s leading middle-income economies.
  • The country recorded growth in 21 of the past 24 years.

Algeria’s GDP per capita has risen four straight years since 2020, edging closer to its 2014 oil-driven peak
  • Algeria’s GDP per capita more than tripled in 25 years, rising from $1,772.9 in 2000 to $5,631.2 in 2024.
  • The 2000s boom saw rapid growth, peaking at $5,180.9 in 2008, fuelled by high oil and gas prices.
  • Between 2014 and 2016, GDP per capita fell from $6,094.7 to $4,425.0, reflecting oil price collapses and domestic fiscal strain.
  • After pandemic-era lows in 2020 ($3,743.5), Algeria rebounded to its second-highest level on record in 2024 ($5,631.2), regaining its regional standing.

Egypt’s GDP per capita has more than doubled since 2000, but has fallen sharply since its 2022 peak
  • Egypt’s GDP per capita grew from $1,366 in 2000 to $3,339 in 2024, a 144% increase over 25 years.
  • The economy peaked at $4,233 in 2022, marking the highest point in the series before a two-year decline.
  • Sustained growth was driven by the 2000s and 2010s, with resilience after the 2008 financial crisis and Arab Spring disruptions.
  • The dip after 2022 reflects external pressures, currency adjustments, and inflationary challenges, though per capita levels remain well above early 2000s baselines.

POPULAR TOPICS
SIGN UP TO OUR NEWSLETTER
Get periodic updates about the African startup space, access to our reports, among others.
Subscribe Here
Subscription Form

A product of Techpoint Africa. All rights reserved