African sesame seed oil production peaked in 2012, followed by the sharpest year-on-year decline in 2013 (38.6%) and a further 42.2% drop by 2022

Key Takeaways:

  • Africa’s sesame seed oil production grew from 23,706 tonnes in 1961 to 217,048 tonnes in 2022, an overall increase of 815%.
  • The highest production was recorded in 2012, with an output of 375,697 tonnes, which is more than 15 times the 1961 volume.
  • Between 1961 and 2012, production rose by 1,484.8%.
  • The largest single-year increase occurred between 1969 and 1970, when production jumped from 41,456 tonnes to 101,472 tonnes.
  • After reaching its peak in 2012, production experienced notable fluctuations, settling at 217,048 tonnes by 2022.
  • The sharpest annual decline occurred in 2013, with a 38.6% drop following the 2012 peak.

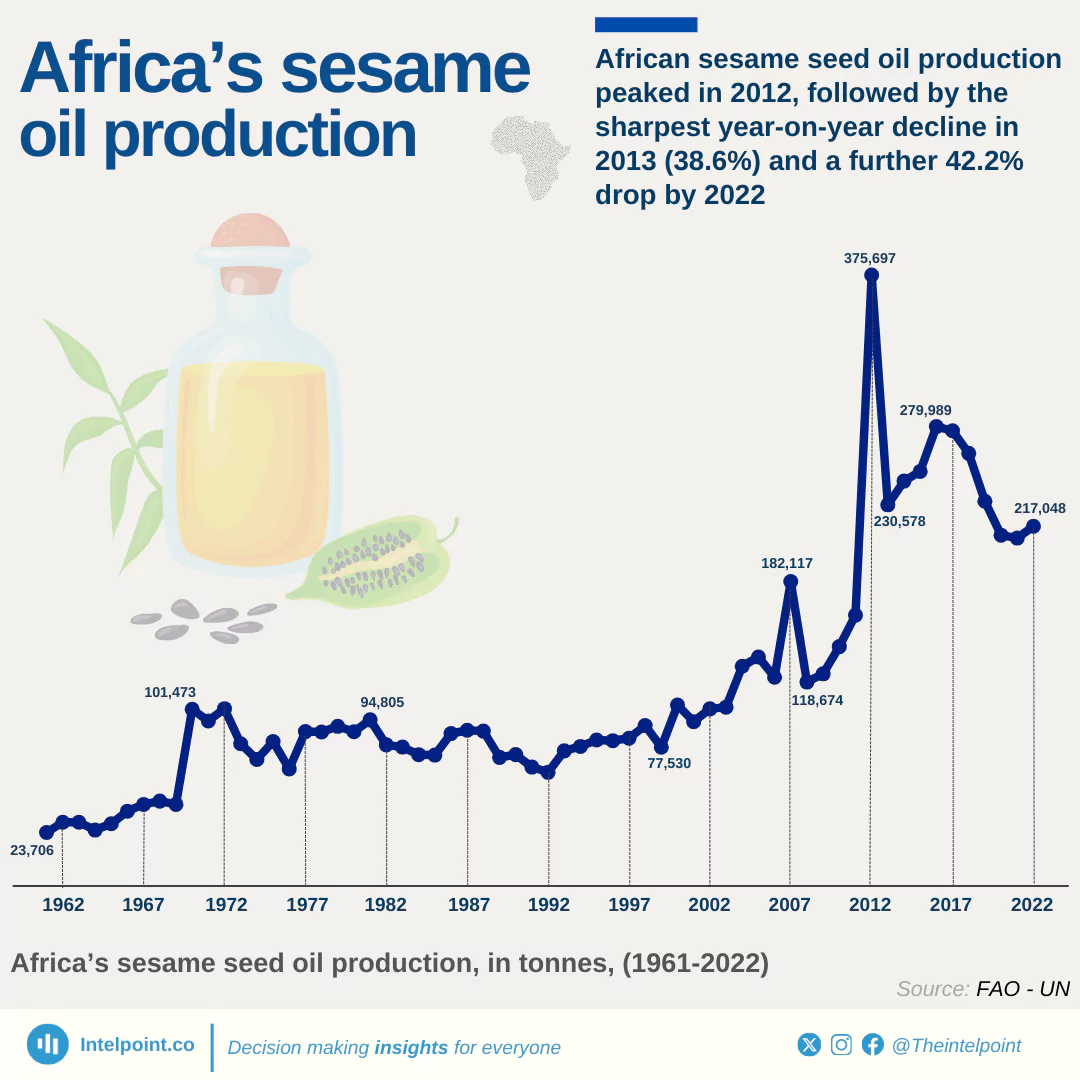
Between 1961 and 2022, Africa’s sesame seed oil production showed a remarkable growth trend. Beginning at approximately 23,706 tonnes in 1961, production more than doubled in just one year between 1969 and 1970, from 41,456 to 101,472 tonnes. This upward trend continued over the following decades, culminating in an all-time high of 375,697 tonnes in 2012.

However, this peak was followed by a sharp drop in 2013, which was most likely caused by a combination of environmental, agricultural, and economic factors, including adverse climatic conditions, pest infestations, declining soil fertility, and economic challenges. Production fell by 38.6% in 2013, the steepest year-on-year decline, with the volume of production output reaching 217,048 tonnes by 2022.

Source:

FAO-UN

Period:

1961-2022
HTML code to embed chart
Want a bespoke report?
Reach out
Tags
Related Insights

Despite volatility, Nigeria's kola nut production reached 188,700 tonnes in 2023, a 117.7% increase from the 1994-2006 average
Key Takeaways:
  • In 2023, Nigeria's kola nut production reached a peak of 188,703.54 tonnes.
  • Following a decline in production from 1994 to 2006, production rose dramatically from 2007 onwards.
  • Between 1997 and 2001, production was lowest, at only 82,000 tonnes.
  • The 2010s saw steady growth, fuelled by increased agricultural investment and possibly rising domestic or export demand.
  • The average production from 1994 to 2006 was 86,698.12 tonnes.

Western Africa produces the largest share of cashew nuts in Africa, growing by nearly 2,443% since 1990
Key Takeaways:
  • Africa’s total cashew nut (in shell) production increased from 172,050 tonnes in 1961 to over 2.25 million tonnes in 2023, a growth of approximately 1,209%.
  • Western Africa has been the primary driver of this growth since the 1990s and now produces the largest share of cashew nuts in Africa.
  • Western Africa accounted for 84% of Africa’s total cashew nut production by 2023.
  • Middle Africa has maintained a minimal but consistent level of production.
  • Eastern Africa led production from the 1960s through the 1980s before being overtaken by Western Africa.
  • The most significant growth in Africa’s cashew production began in the 1990s.
  • Despite overall growth, cashew production in Africa has experienced periodic fluctuations.
  • Mostly due to their climate conditions, Southern and Northern Africa regions are less favourable for cashew production than other African regions.

62 years of beer production: United States' 41-year rule and China’s overtake
  • The US led global barley beer output for 41 straight years (1961–2001).
  • China has topped production every year since 2002—21 years and counting.
  • The US produced 1.28 billion tonnes in 62 years—about 3.88 trillion bottles of 33cl beer.
  • Nigeria rose from 53rd place in 1961 to 13th in 2014, before sliding to 22nd by 2022.
  • Global beer leadership now reflects shifts in demand from Western to Asian markets.
  • Beer output trends mirror broader changes in economic power and population growth.

South Africa's wine production peaked at 1.15 million tonnes in 2014, while being Africa’s major wine producer for 48 years
Key Takeaways:
  • South Africa has been the leading wine producer in Africa from 1975 to 2022.
  • Algeria was the top producer from 1961 to 1974 but saw a significant decline in output in later years.
  • South Africa, Algeria, Morocco, and Tunisia have been the dominant wine-producing countries in Africa between 1961 and 2022.
  • On average, eight African countries have engaged in wine production annually during this period.
  • Sub-Saharan nations such as Zimbabwe, Ethiopia, and Tanzania have contributed small but steady wine to Africa’s production in recent decades.
  • Egypt has consistently ranked among Africa’s top wine producers, with its highest production recorded in 2008.

The former Sudan led Africa’s sesame seed oil production for 48 years, with the largest volume of 69,300 tonnes produced in 2009
Key Takeaways:
  • The former Sudan was the leading sesame seed oil producer in Africa for 48 years, from 1961 to 2011.
  • Nigeria topped Africa’s production rankings between 2012–2014 and 2016–2018.
  • The Central African Republic led sesame oil production in Africa for five years in a recent period.
  • East African countries, particularly Tanzania and Uganda, have seen significant growth in sesame oil production since the 1990s.
  • Six countries—Former Sudan, Somalia, Ethiopia, Tanzania, Mozambique, and the Central African Republic—have consistently played leading roles in Africa’s sesame seed oil production from 1961 to 1981 before the inclusion of some other African countries.
  • Following their separation, both Sudan and South Sudan have remained among the top sesame oil producers in Africa.
  • The top producers of sesame seed oil in Africa are mainly from Sub-Sahara African countries.
  • In SSA, sesame is often grown by small-scale farmers for export purposes.

Just 10 countries got over 75% of public sector funding for agriculture since 1991 — the US alone took nearly 23%
  • Global public agriculture funding between 1991 and 2023 totaled $878 trillion.
  • The U.S. alone received $199 trillion, averaging $6.2 trillion per year — the highest of any country.
  • Japan and China followed with $166 trillion and $122 trillion respectively.
  • Just 10 countries accounted for over 75% of the total.
  • Nigeria ranked 41st out of 145 countries, with only $1 trillion in 32 years — about $32 billion per year.
  • For a country with over 200 million people, that low level of investment tracks closely with rising food prices, low yields, and import dependence.

POPULAR TOPICS
SIGN UP TO OUR NEWSLETTER
Get periodic updates about the African startup space, access to our reports, among others.
Subscribe Here
Subscription Form

A product of Techpoint Africa. All rights reserved