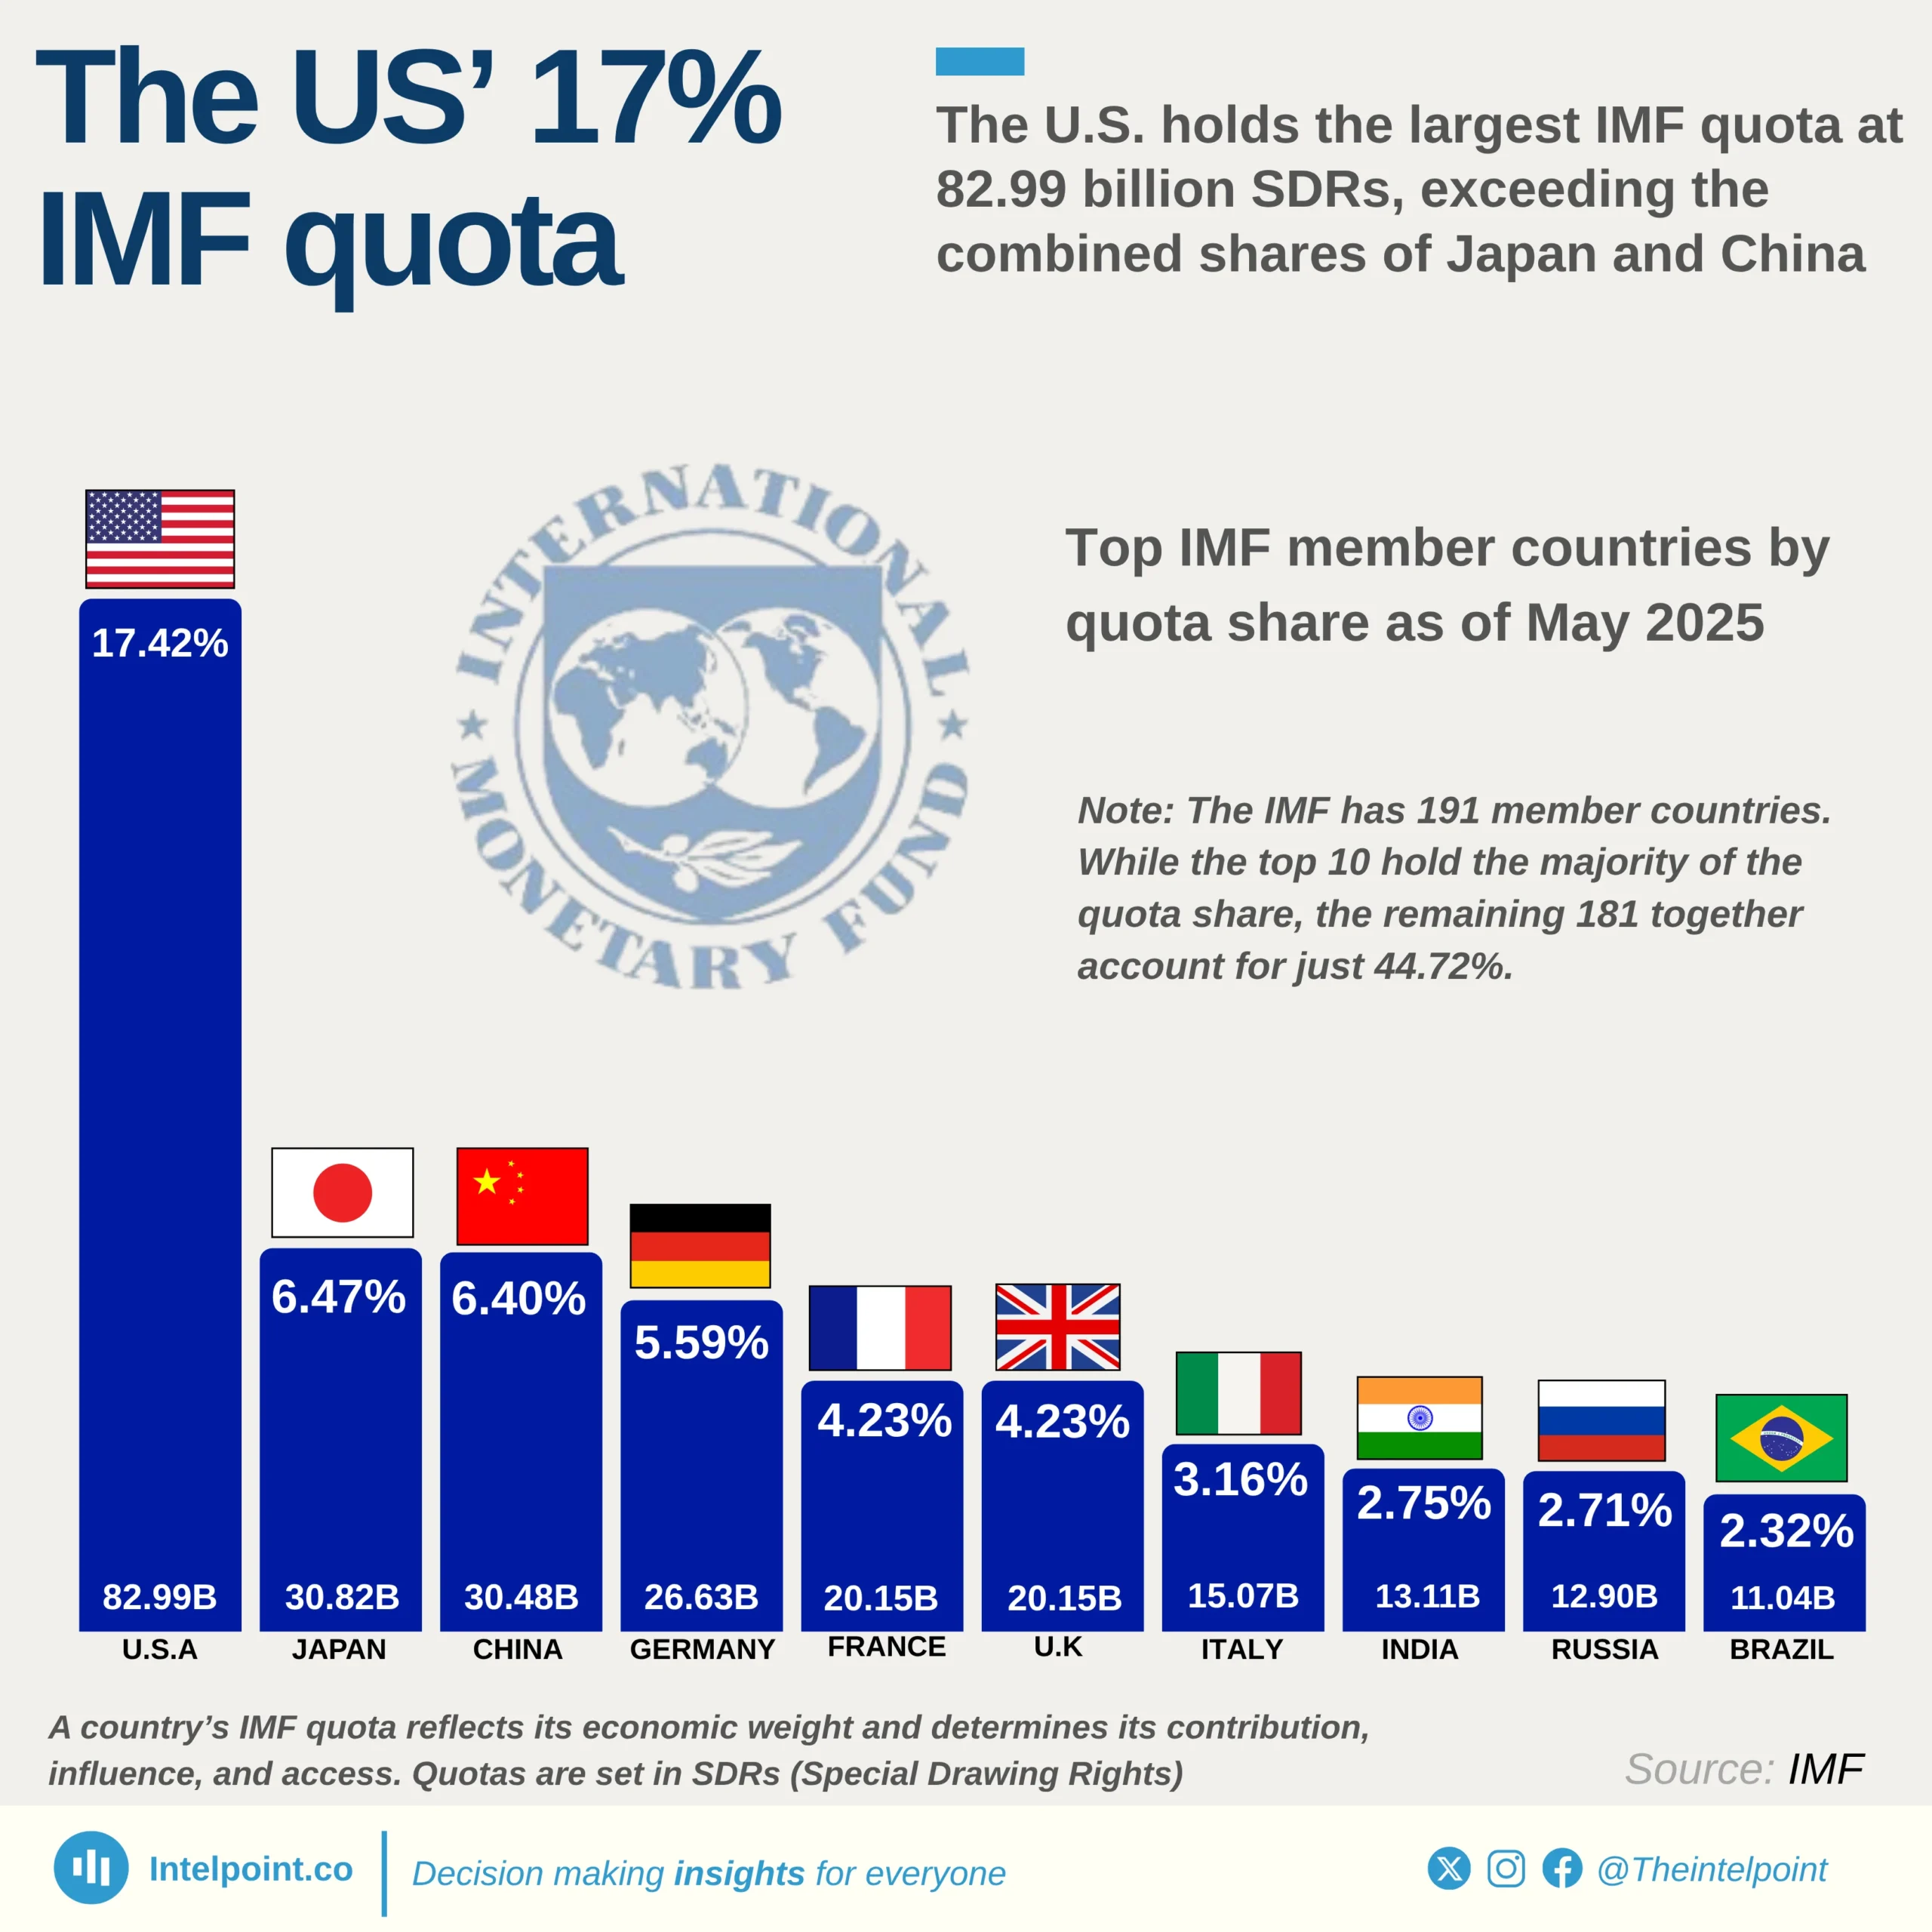
Bite-sized Insights about
 
Providing you with data-based insights about things happening around you.
Search results for
China tops the global reserves chart in 2024, holding nearly three times Japan’s reserves and having 5.53% of its total reserves as gold reserves
Key takeaways:
  • China leads all nations with total reserves of $3.46 trillion while holding 5.53% of its share in gold reserves.
  • The top 15 countries collectively hold a total reserve of $10.78 trillion.
  • Despite being the global leader in gold reserves, the United States ranks third in total reserves.
  • The largest share of the United States' total reserves is from its gold reserve holdings of 74.97%.
  • Countries in the top fifteen list hold at least $236.9 billion each in total reserves.
  • The United States, France, and Italy have more than 70% of their total reserve holdings in gold.

After the 2020 crash, US-Nigeria trade value climbed to $10B+ in 2024
Key Takeaways: 
  • The US' trade deficit with Nigeria narrowed significantly, shifting from a $5.14 billion deficit in 2017 to a $1.69 billion surplus in 2024.
  • US goods exports to Nigeria reached $4.2 billion in 2024, representing a 92% increase from the $2.2 billion recorded in 2017.
  • US goods imports from Nigeria totalled $5.9 billion in 2024, a 20% decrease from the $7.3 billion recorded in 2017.
  • The COVID-19 pandemic severely disrupted bilateral trade in 2020, but both imports and exports began recovering steadily from 2021 onwards.
  • By 2024, trade had rebounded substantially, with US imports from Nigeria reaching $5.87 billion and exports to Nigeria reaching $4.17 billion.
  • Despite experiencing persistent trade deficits from 2017 through most of the period, the US achieved trade surpluses with Nigeria in 2020 and 2021.
  • Total goods trade between the US and Nigeria ranged from $4 billion to approximately $10 billion.

Soybeans led the US' agricultural exports with $24.58 billion in 2024, accounting for 14% of the total export value
Key Takeaways:
  • Soybeans topped the US' agricultural exports in 2024, followed by corn and beef.
  • The top 10 agricultural commodities made up 56.6% of the total value of the US' agricultural exports.
  • Plant-based exports (soybeans, corn, tree nuts, soybean meal, wheat) contributed over 34% of the total agricultural export value.
  • The combined value of the top 10 exports exceeded $99.73 billion.
  • Animal proteins (beef, pork, and poultry) together represented 13.9% of total US agricultural exports.

The United States imported over $5.7 billion in goods from Nigeria in 2024, with mineral fuels and oils accounting for 93%
Key Takeaways:
  • Mineral fuels and oils dominated the US' imports from Nigeria, totalling $5.28 billion.
  • Total US imports from Nigeria reached $5.70 billion in 2024.
  • Non-oil sectors contributed approximately $423 million to the total US imports from Nigeria.
  • US imports from Nigeria cut across 70 distinct product categories.
  • The average value across all import categories was $81.4 million.
  • The top 10 imported goods made up 99.1% of the total imported value.

Mineral fuels, oils, and distillation products accounted for 43.65% of the US' total export to Nigeria
Key Takeaways:
  • Mineral fuels and oils led the US' exports to Nigeria at $1.82B, making up over 43% of the total.
  • Vehicles and automotive parts followed at $677.65 million, with machinery and nuclear reactors contributing $487.23 million.
  • Total US exports to Nigeria reached $4.17 billion in 2024.
  • The top 10 export categories made up 90.7% of the total export value.
  • The top three US export categories to Nigeria accounted for nearly 72% of total exports.

The top 3 countries accounted for nearly half of the US' agricultural exports in 2024, valued at $83.35 billion
Key takeaways:
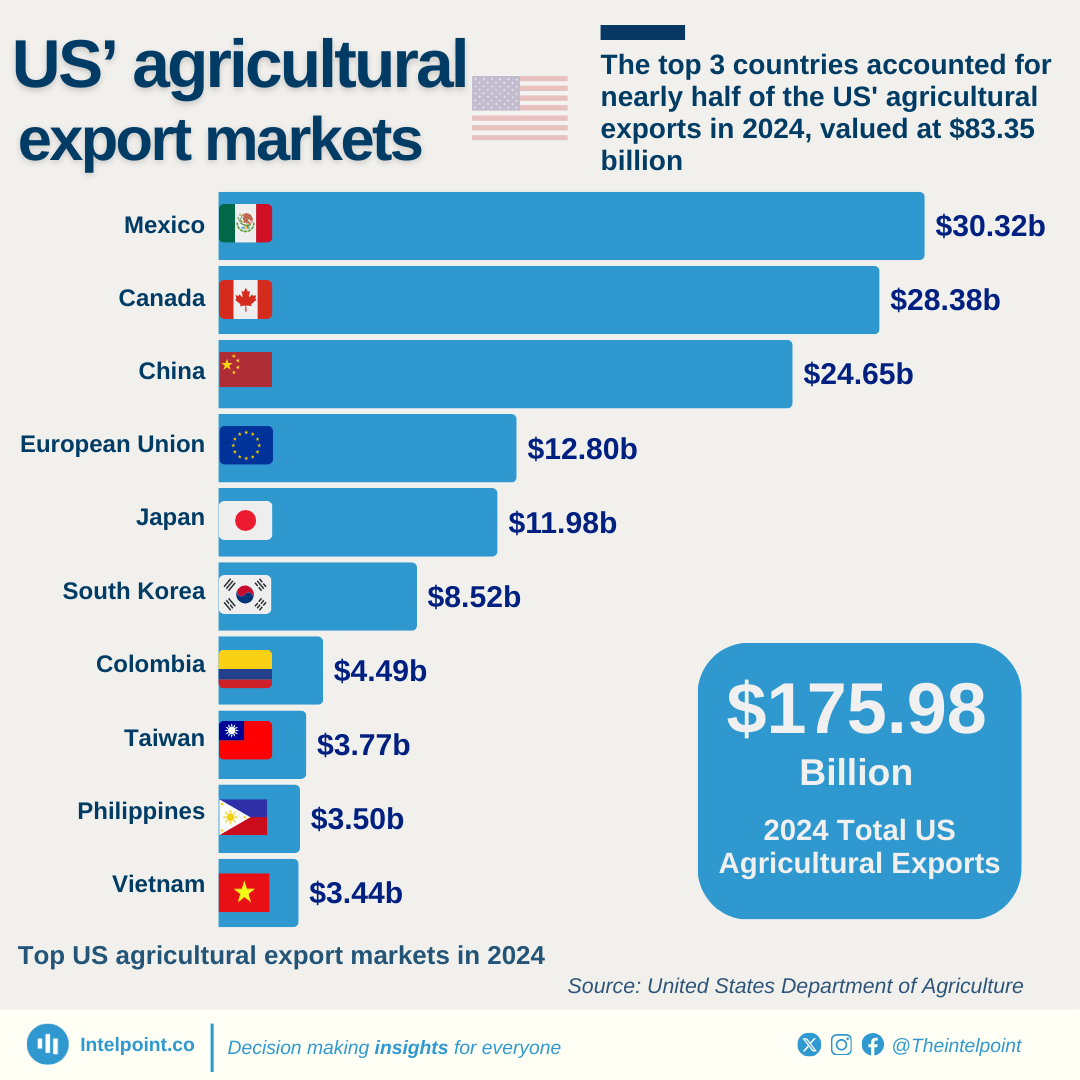
  • Mexico ranked as the leading destination for the US' agricultural exports in 2024, with a total value of $30.32 billion (17.2% of total agricultural exports).
  • North American neighbours, Mexico and Canada, collectively accounted for 33.3% of total US agricultural exports.
  • China was the third-largest market, importing $24.65 billion (14%) of the US' agricultural products.
  • Asian markets, including China, Japan, South Korea, Taiwan, the Philippines, and Vietnam, collectively absorbed 31.7% of the US' agricultural exports.
  • The top three markets (Mexico, Canada, and China) made up 47.3% of the US' total agricultural export value.
  • The top 10 markets accounted for 74.8% of the US' agricultural exports, totalling $131.85 billion.

Wheat accounted for 46.43% of the United States’ agricultural exports to Nigeria in 2024
Key Takeaways:
  • The United States exported $318.7 million worth of agricultural products to Nigeria in 2024.
  • Wheat accounted for nearly half of the US' agricultural exports to Nigeria, valued at $148 million.
  • The trade balance substantially favours the United States, with exports to Nigeria ($318.7 million) nearly double imports ($114.7 million).
  • The top three products account for 74.49% of all agricultural exports to Nigeria.

Top 10 Countries with the Most Number of U.S. Troops
 
  • Japan, South Korea, and Germany collectively host approximately 75% of all U.S. troops stationed abroad.
  • Japan leads with 53K U.S. troops, followed by Germany (35K) and South Korea (24K).
  • The Indo-Pacific (77K) edges out Europe (58K), while the Middle East (5K) holds minimal footholds in regional priorities.

Top 10 Countries With The Most Number of U.S. Military Bases
  • Japan leads with 14 bases. It hosts the most U.S. bases globally, exceeding individual counts in the Philippines (9) and South Korea (8).
  • Asia-Pacific Dominance: The region (Japan, Philippines, South Korea, Australia, and Papua New Guinea) accounts for 41 bases, nearly 1/3 of the global total.
  • The Asia-Pacific region hosts 41 U.S. bases, while Europe (Italy, Germany, Poland, UK) has 23. This indicates a growing strategic pivot towards the Pacific compared to traditional European deployments.
  •  Kuwait (5 bases) stands out as the primary hub for U.S. military operations in the Middle East, highlighting its role as a key staging ground for regional security.
  • The top 10 host countries account for 69 of the 128 total bases (over 53%), meaning nearly half of U.S. overseas bases are spread across the remaining 39 countries.

The dynamic trend of refugee admission in the United States (2012 to 2024)
Key takeaways:
  • From 2012 to 2024, the refugee population in the United States increased by approximately 66%, growing from 262,006 to 435,333.
  • The overall trend indicates steady growth in the number of refugees in America, despite a brief period of stabilisation during 2020-2021.
  • The years from 2022 to 2024 demonstrate a significant rise, with annual totals increasing by more than 72,000 refugees during this time frame.
  • The figure for 2024, at 435,333 refugees, represents the highest number of refugees recorded from 2012 to 2024.

1 2 3 4

Can’t find what you’re looking for? Please fill the form below
Contact Form Demo
SIGN UP TO OUR NEWSLETTER
Get periodic updates about the African startup space, access to our reports, among others.
Subscribe Here
Subscription Form

A product of Techpoint Africa. All rights reserved