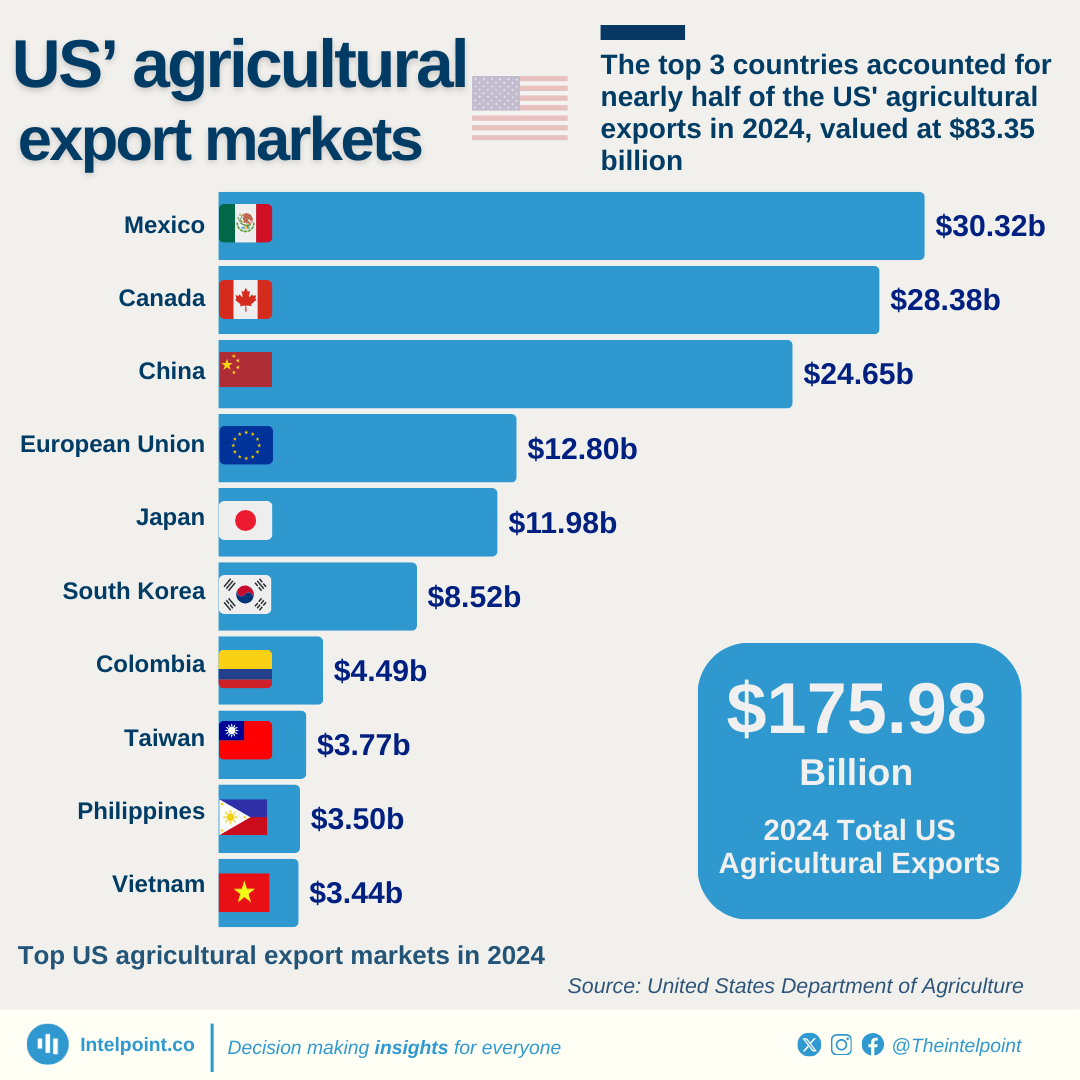
Mexico ranked as the leading destination for the US' agricultural exports in 2024, with a total value of $30.32 billion (17.2% of total agricultural exports).
North American neighbours, Mexico and Canada, collectively accounted for 33.3% of total US agricultural exports.
China was the third-largest market, importing $24.65 billion (14%) of the US' agricultural products.
Asian markets, including China, Japan, South Korea, Taiwan, the Philippines, and Vietnam, collectively absorbed 31.7% of the US' agricultural exports.
The top three markets (Mexico, Canada, and China) made up 47.3% of the US' total agricultural export value.
The top 10 markets accounted for 74.8% of the US' agricultural exports, totalling $131.85 billion.
In 2023, the global mobile phone export market totalled $271.42 billion, with China dominating by accounting for $137 billion (50.5%) of total exports.
Vietnam, Hong Kong, and India complete the top four, accounting for 11.8%, 9.7%, and 5.3% of the total, respectively.
Six Asian countries and regions make up four-fifths of global mobile phone export value in 2023, showcasing the region's dominance in the industry.
Since the 1950s, the top sources of international students in the US have changed, with Canada initially leading, followed by Iran in the 1970s, Taiwan and Japan in the 1980s and 90s, and China and India taking the lead from the 2000s onward.
China and India account for a combined 54% of the total international students in the US as of the 2023/2024 academic year.
By 2021, Nigeria entered the top ten, reaching 7th place by 2024.
In 2023, global vehicle production surged, led by China with over 30 million vehicles — a 12% increase from 2022.
The US and Japan followed, holding 11% and 10% shares, respectively.
Global output rose 10%, reaching 93.55 million vehicles, up from 85.02 million in 2022.
Only two African countries — South Africa and Morocco — made the top 25, highlighting the continent's developing automotive sector.
With Chinese platforms like Alibaba and AliExpress serving customers across the globe, China's eCommerce sales in 2021 ($2.78 trillion) are larger than the sales in the USA, the UK, and other countries of the top 10 eCommerce markets globally combined.
1990-2000: In this decade, China and India accounted for over 50% of the world's total output, with other dominant rice producers being Indonesia, Vietnam, and Bangladesh, with production figures falling between 20 and 30 million metric tons.
2001-2010: China and India remained the two top producers, with China producing 140 million metric tons annually and India 100 million metric tons annually.
2011-2020: China and India continue to lead at about 150 million and 105 million metric tons, respectively.
2021-2024: China and India continued to lead. China reached 144.62 million metric tons in 2023/2024, and India accounted for 137.83 million metric tons.
Can’t find what you’re looking for? Please fill the form below