Nominal spending surged, but inflation and naira depreciation eroded real gains. From ₦921 billion in 2012 to ₦6.57 trillion in 2025, the absolute figure may seem dramatic, but Nigeria's security challenges intensified over the same period.
Defence commanded over 21% of the budget in 2013. From 2024 to 2026, that figure has fallen below 14%, with 2026 hitting a historic low of 9.3%.
Boko Haram, banditry, and separatist tensions peaked in 2020, resulting in a cut that saw defence's share fall to just 9.2%, the lowest on record at that point.
The jump to ₦6.57trn (13.2%) in 2025 marks the sharpest year-on-year absolute increase in the dataset. But 2026 reversed this again, with the rate dropping to 9.3%.
Crude oil alone accounts for 55.7% of all exports. Remove it and Nigeria runs a ₦26.7tn trade deficit. The entire surplus rests on one commodity.
Nigeria imports ₦31.97tn in manufactured goods but exports only ₦2.50tn, a 12-to-1 ratio that reflects near-total dependence on foreign industrial output.
Nigeria exports ₦25.3tn in petroleum products yet imports ₦13.3tn of refined petroleum. Africa's top oil producer still can't fully process its own crude.
Despite Nigeria's vast farmland, agri-exports (₦5.07tn) barely exceed agri-imports (₦4.76tn). The sector earns almost nothing net.
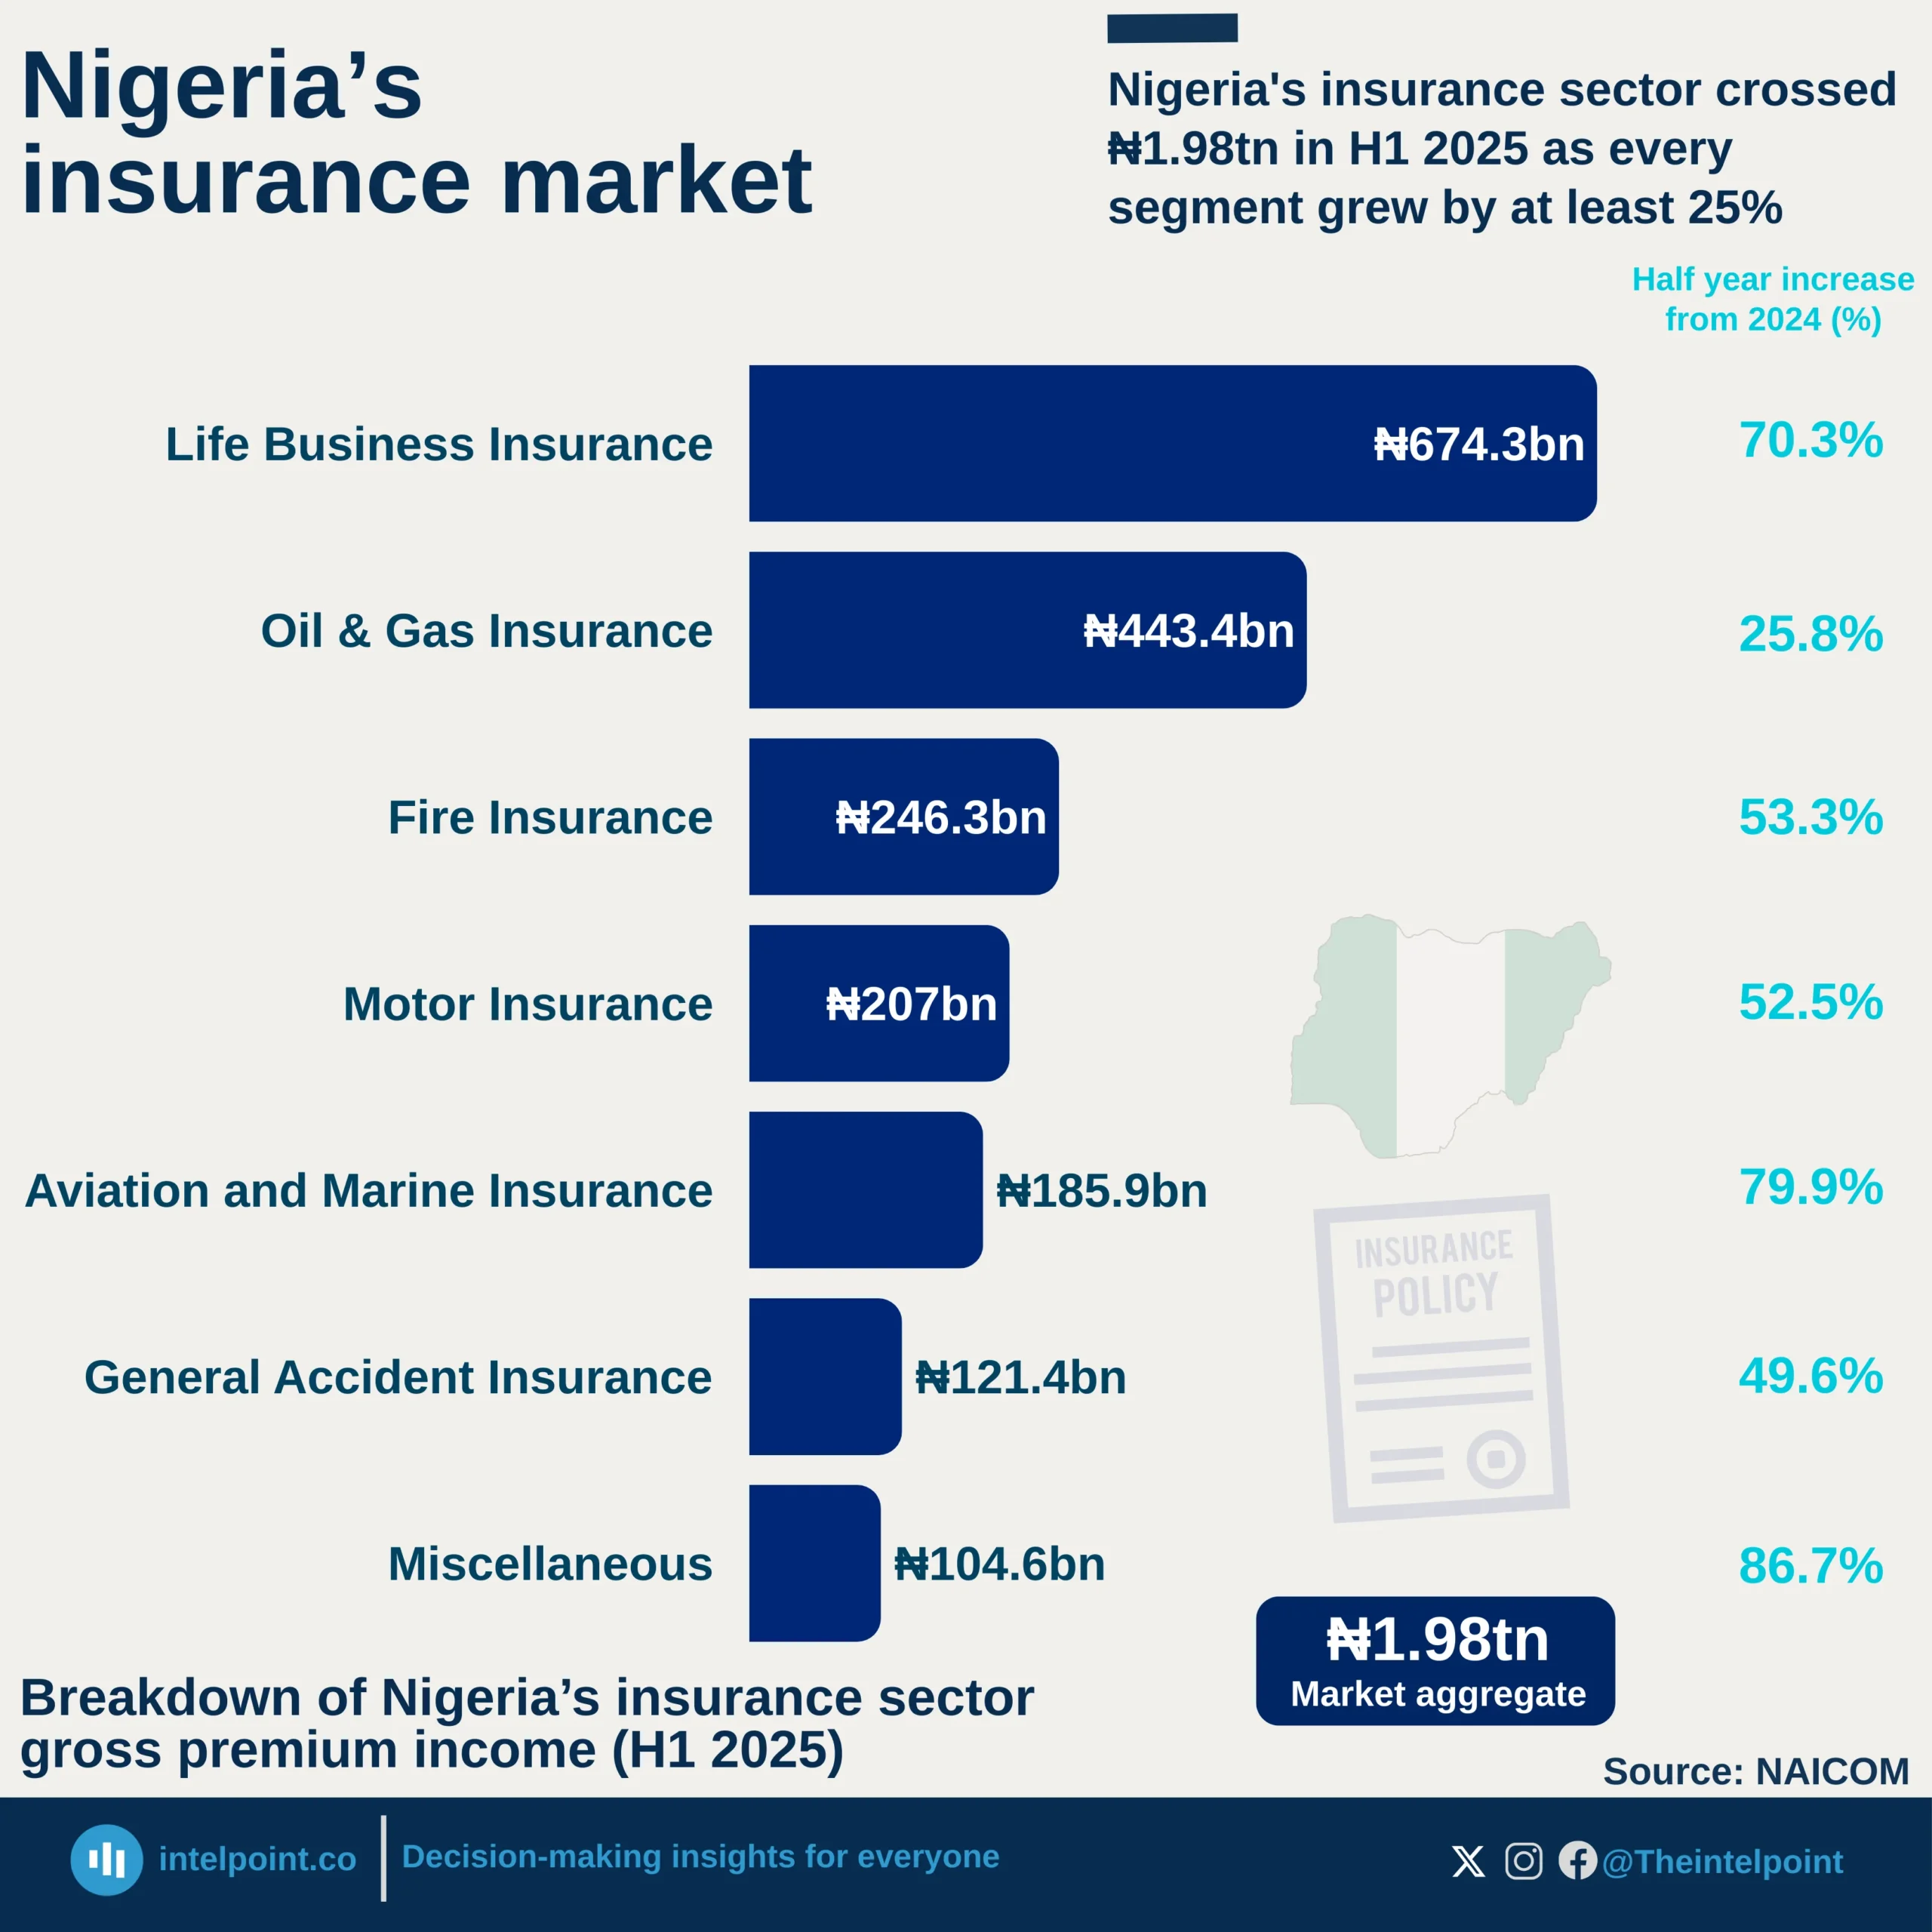
Life Business was the single largest segment, and its 70.3% jump signals that more Nigerians are thinking seriously about financial protection for their families.
Miscellaneous, the smallest segment, posted the biggest growth at 86.7%, suggesting new and unconventional insurance products are gaining serious traction.
Aviation & Marine nearly doubled, with 79.9% growth in a sector tied to trade and logistics, reflecting Nigeria's expanding import/export activity and the rising cost of cargo and aircraft risk coverage.
Motor (52.5%), Fire (53.3%), and General Accident (49.6%) grew by roughly half, indicating broad-based sector expansion rather than isolated pockets of growth.
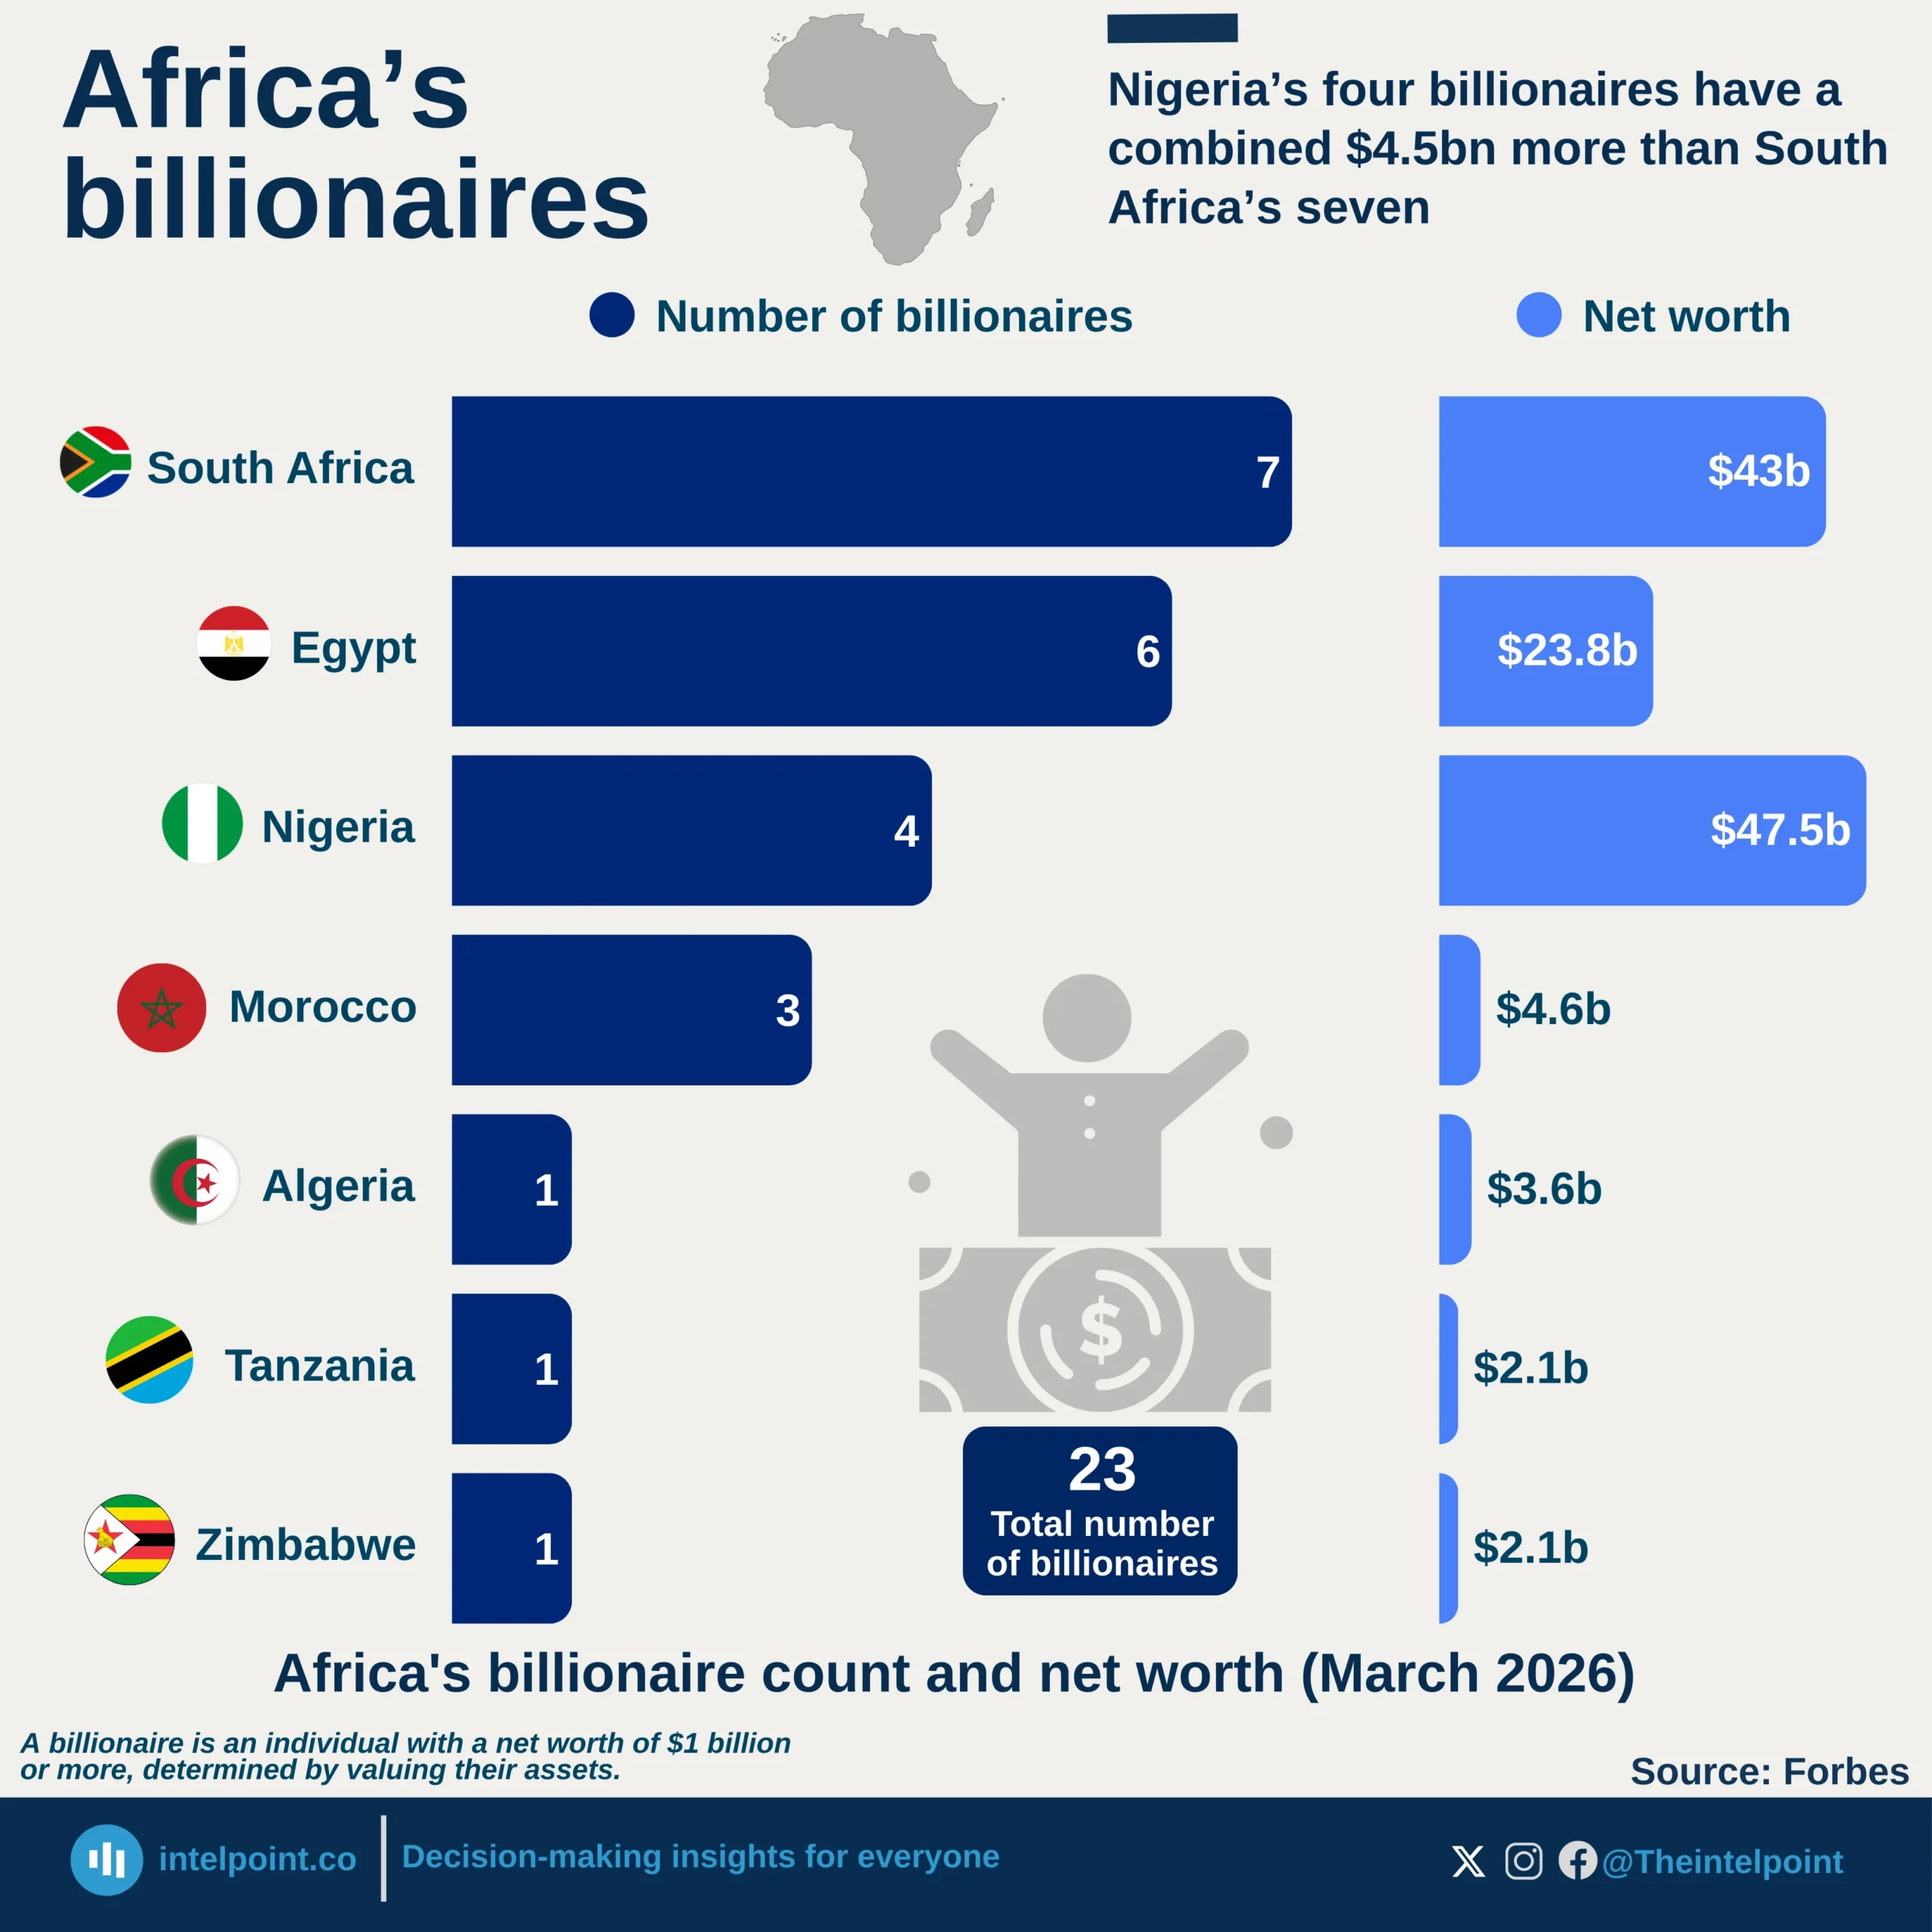
South Africa leads in headcount, with seven billionaires, more than other African countries.
Nigeria leads in wealth, with four billionaires worth $47.5 billion, $4.5 billion more than the combined $43 billion of South Africa's seven billionaires.
Nigeria's billionaires are richer individually, with an average net worth of $11.9 billion, compared with South Africa's $6.1 billion.
North Africa punches below its weight: Egypt, Morocco, and Algeria have ten billionaires combined but just $31.4 billion in total wealth.
East Africa barely registers: Tanzania and Zimbabwe each have just one billionaire, both worth $2.1 billion.
Life Business was the single largest segment, and its 70.3% jump signals that more Nigerians are thinking seriously about financial protection for their families.
Miscellaneous, the smallest segment, posted the biggest growth at 86.7%, suggesting new and unconventional insurance products are gaining serious traction.
Aviation & Marine nearly doubled, with 79.9% growth in a sector tied to trade and logistics, reflecting Nigeria's expanding import/export activity and the rising cost of cargo and aircraft risk coverage.
Motor (52.5%), Fire (53.3%), and General Accident (49.6%) grew by roughly half, indicating broad-based sector expansion rather than isolated pockets of growth.
Export values have grown over 400%, rising from ₦11.8 trillion in 2013 to a peak of ₦55.3 trillion in 2024, a fivefold increase driven by rising oil prices and a weaker naira.
2015 and 2016 were the hardest years, with export values crashing as low as ₦6.8 trillion in 2015, reflecting the brutal impact of the global oil price collapse on Nigeria's most critical export.
The most explosive growth came from 2023 onwards, with values surging past ₦29 trillion in 2023 and peaking at ₦55.3 trillion in 2024, largely driven by the naira depreciation following Nigeria's 2023 foreign exchange reforms.
The first nine months of 2025 saw a slower pace than the previous year, with ₦37.7 trillion recorded between Q1 and Q3, lower than the ₦41.5 trillion recorded during the same period in 2024.