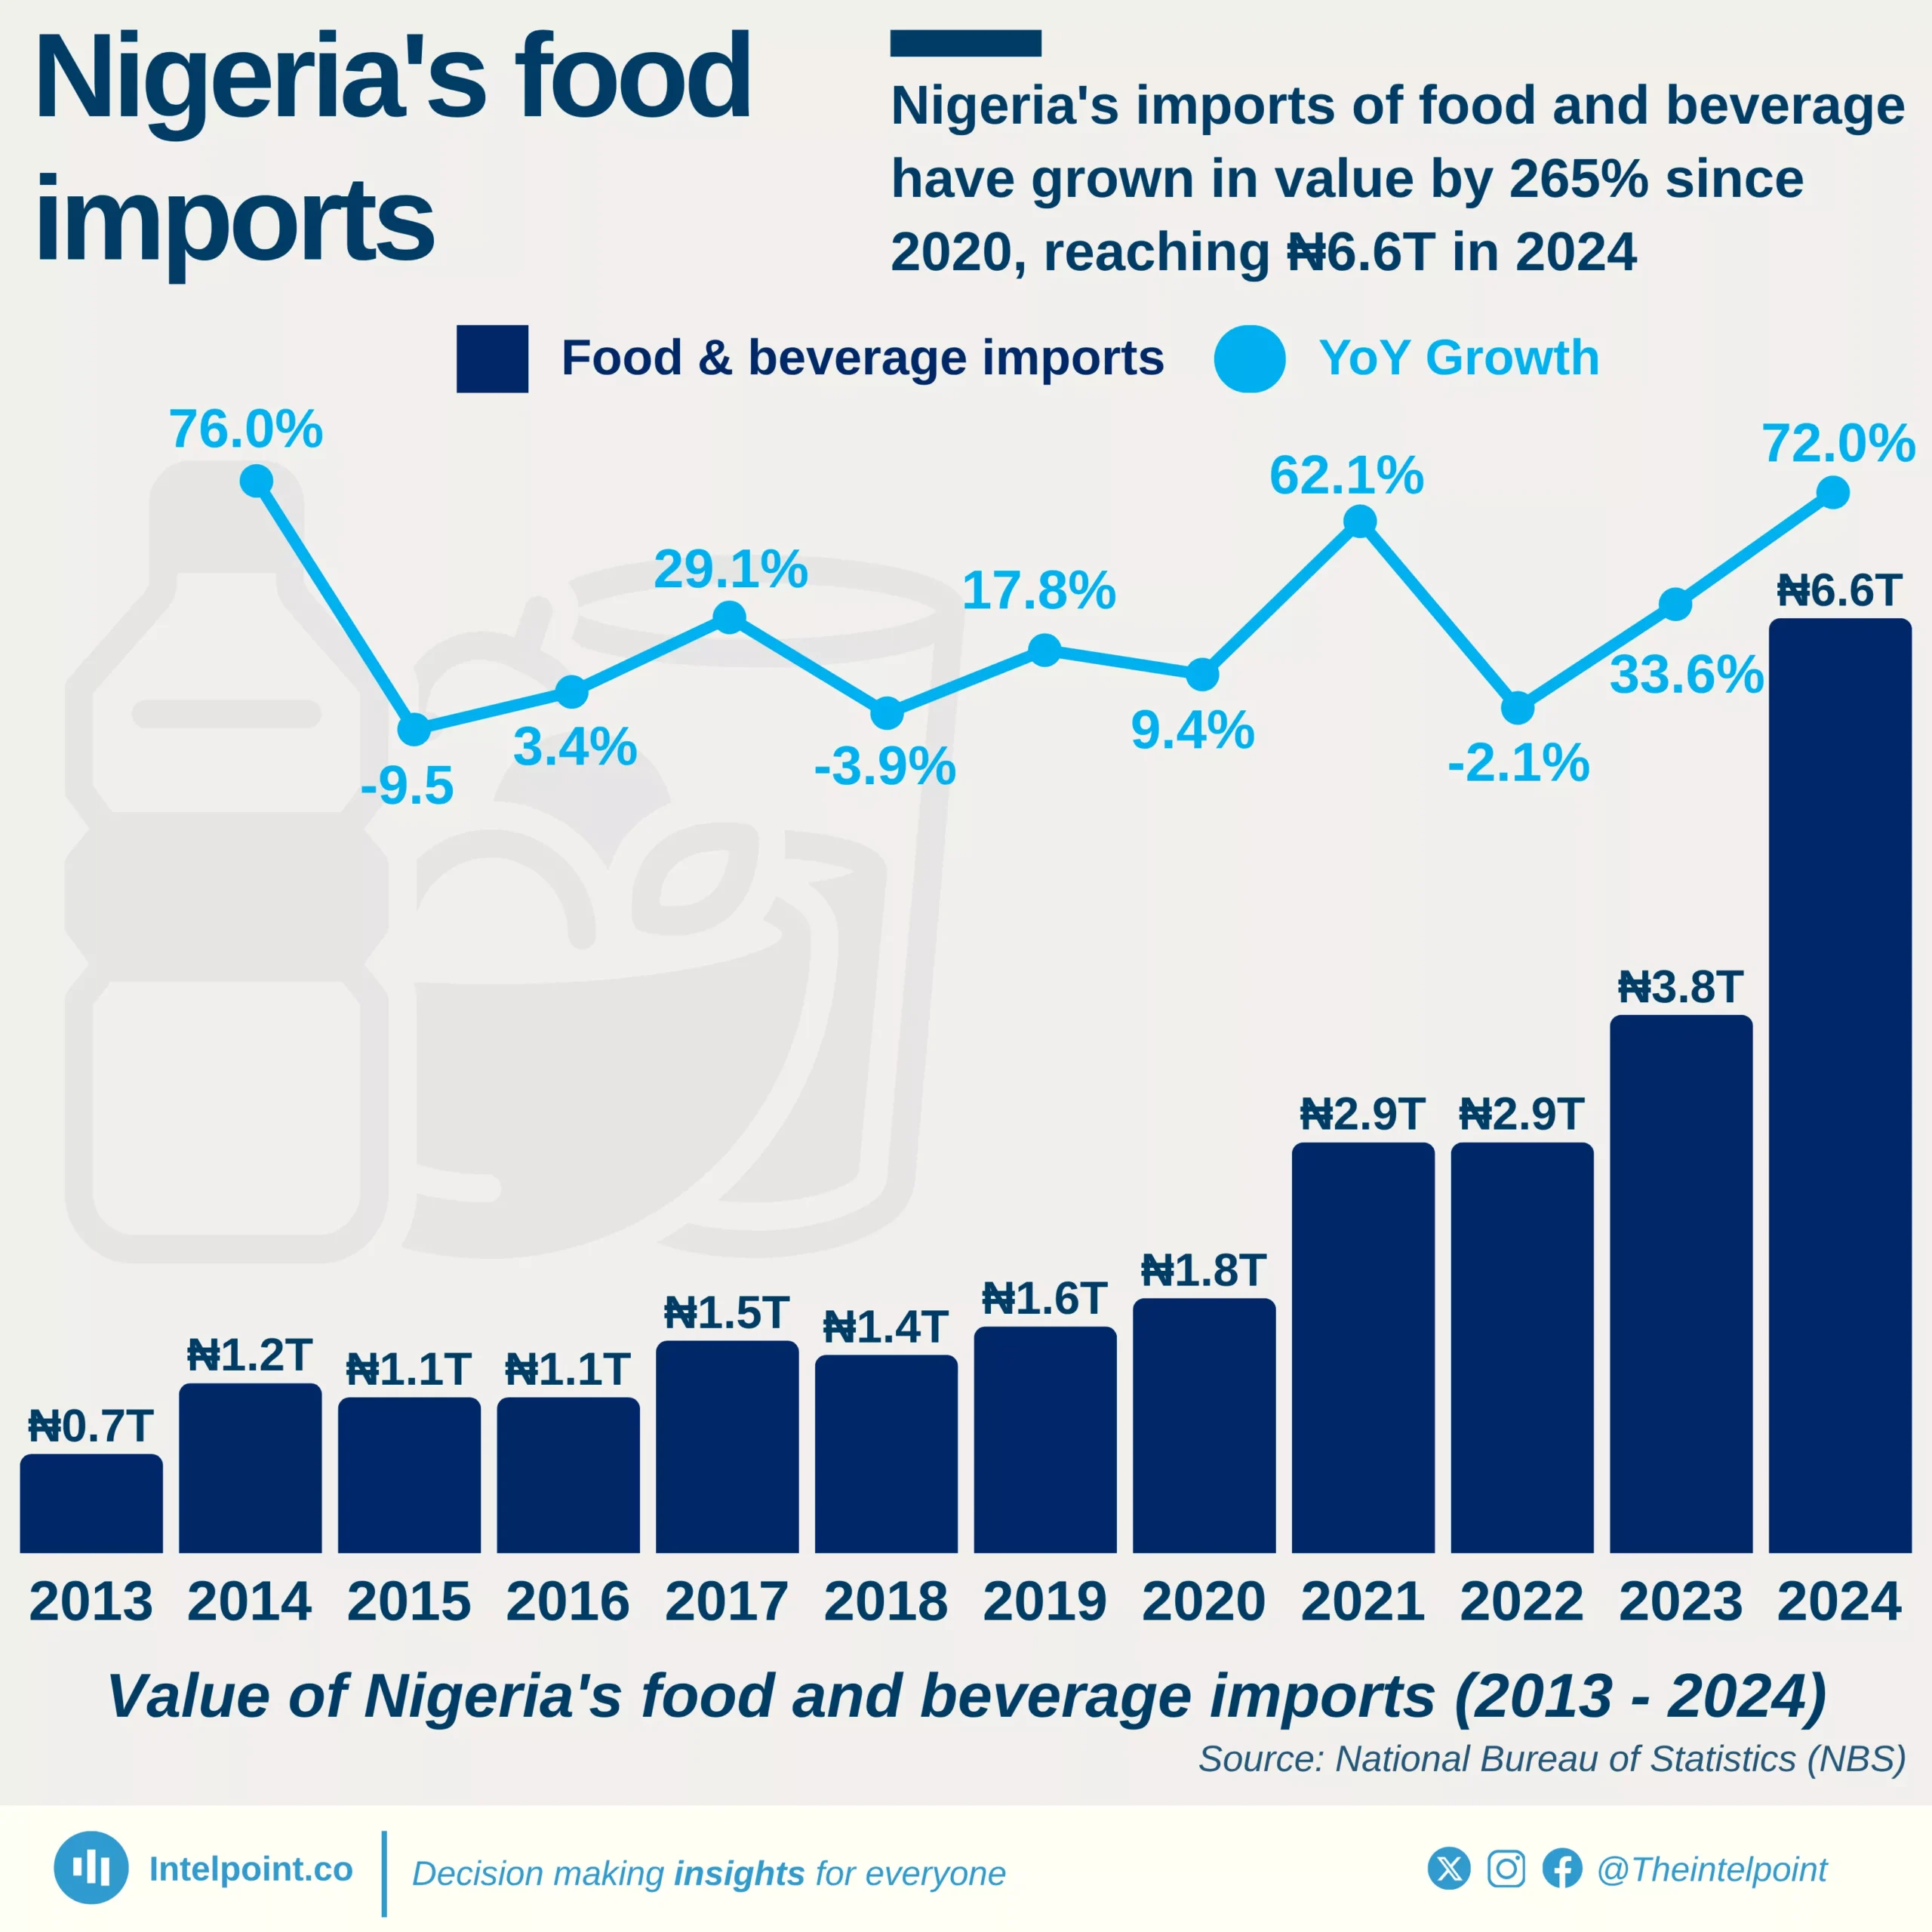
Bite-sized Insights about
 
Providing you with data-based insights about things happening around you.
Nigeria’s foreign trade hit ₦38 trillion in Q2 2025, driven by strong export growth
  • Total trade in Q2 2025 was valued at ₦38.04tn.
  • Imports accounted for ₦15.29tn, led by manufactured goods and petroleum products.
  • Exports reached ₦22.75tn, boosted mainly by crude oil.
  • The trade gap favoured Nigeria with a surplus of ₦7.46tn.

In ten years, Osun State’s IGR rose nearly fivefold to ₦54.7b in 2024, driven by a great 97% leap from 2023
  • Osun’s Internally Generated Revenue (IGR) grew from ₦11.78b in 2015 to ₦54.70b in 2024, marking a 364% increase.
  • The state maintained steady annual growth after 2017, with notable acceleration from 2020 onward.
  • The single biggest leap occurred between 2023 and 2024, with revenue nearly doubling from ₦27.72b to ₦54.70b.
  • The upward trend reflects improved tax collection, diversification of revenue sources, and stronger fiscal policies.

South Africa led Africa’s bond market with $328.8 billion [in] volume and nearly 3,000 issuances
  • South Africa is the clear leader, recording a bond market volume of $328.8 billion and 2,952 issuances, far ahead of all other African economies.
  • Egypt and Morocco follow as strong contenders with bond volumes of $188.8 billion and $116.4 billion, respectively, though both trail South Africa by wide margins.
  • Côte d’Ivoire, Algeria, and Nigeria represent the mid-tier, each exceeding $65 billion, showing notable regional financial activity.
  • Smaller markets like Tunisia and Angola feature relatively lower volumes ($16.9 billion and $28.4 billion) but maintain significant issuance activity.

South Africa has 1 in every 3 millionaires in Africa
  • South Africa dominates with 41,100 millionaires, accounting for more than 1 in 3 African millionaires, far ahead of any other nation.
  • Egypt (14,800) and Morocco (7,500) round out the top three, highlighting North Africa’s wealth concentration.
  • Nigeria (7,200) and Kenya (6,800) confirm West and East Africa’s growing wealth hubs, though still far below South Africa.
  • Mauritius (4,800) and Seychelles (500) rank surprisingly high relative to population size, showing their role as finance and wealth management hubs.

Morocco leads Africa in digital trade surpluses, with $26 billion 20-year cumulative gain
  • Morocco achieved the highest cumulative surplus in Africa’s digital trade at $26.4 billion between 2005 and 2024.
  • Mauritius and Tunisia followed distantly with surpluses of $8.7 billion and $4.4 billion, respectively.
  • Nigeria and Angola recorded the deepest deficits, each exceeding $90 billion cumulatively.
  • Africa’s overall digital trade balance remained negative, averaging a -$618 million deficit in 2024.
  • Smaller economies like Kenya and Togo managed modest but consistent surpluses over the years.

Nearly one in six of Africa’s goats are in Nigeria, the continent’s leader since 1998
  • Africa’s goat population grew from 94 million in 1961 to 522 million in 2023 — more than a fivefold increase.
  • The continent’s share of the world’s goats rose from 27% in 1961 to 46% in 2023.
  • Nigeria leads with nearly 89 million goats in 2023, holding the top spot since 1998.
  • Ethiopia, Chad, Sudan, Niger, and Mali consistently rank among the largest goat producers.
  • Around 70% of Africa’s goats are concentrated in the top ten countries each year.

In 2024, Asia and Europe together accounted for 63% of the world's copper export value
  • Asia leads global copper exports with 31.6% of total export value.
  • Europe follows closely at 31.4%, making the two regions nearly equal in contribution.
  • Combined, Asia and Europe control 63% of the global copper export market.
  • Africa ranks third globally, contributing 15.3% to copper exports.
  • Oceania plays the smallest role, with just 2% of the total export value.

Just 10 countries in Africa control 98% of the continent’s copper export value
  • The DR Congo is Africa’s copper giant, exporting $19.8 billion in 2024 (56.7% of the total).
  • Zambia follows with $7.6 billion, representing 21.7% of exports.
  • Together, the DR Congo and Zambia control almost 80% of Africa’s copper trade.
  • Tanzania is the third-largest exporter with $2.2 billion (6.3%).
  • Despite 52 African countries exporting copper, 42 of them collectively make up only 2% of the total value.

South Africa’s digital service imports still outweighed exports as of 2024, even after 300% growth since 2005
  • South Africa’s digital service imports consistently overshadowed export earnings, despite exports growing by over 300% since 2005.
  • South Africa exported $76.418 billion in digital services between 2005 and 2024.
  • Imports during the same period reached $113.67 billion.
  • The result was a trade deficit of $37.252 billion in over 20 years.
  • Exports rose from just $1.71 billion in 2005 to $7.05 billion in 2024.

Ghana recorded $53.00B in digital services imports against $49.1B in exports in 20 years
  • Ghana exported $49.11 billion in digital services between 2005 and 2024.
  • Digital services imports recorded during the same period was $53.00 billion.
  • Ghana recorded a $3.9 billion trade deficit across the two decades.
  • Exports grew from just $78 million in 2005 to $5.18 billion in 2024.

1 2 3 4 45

Can’t find what you’re looking for? Please fill the form below
Contact Form Demo
SIGN UP TO OUR NEWSLETTER
Get periodic updates about the African startup space, access to our reports, among others.
Subscribe Here
Subscription Form

A product of Techpoint Africa. All rights reserved