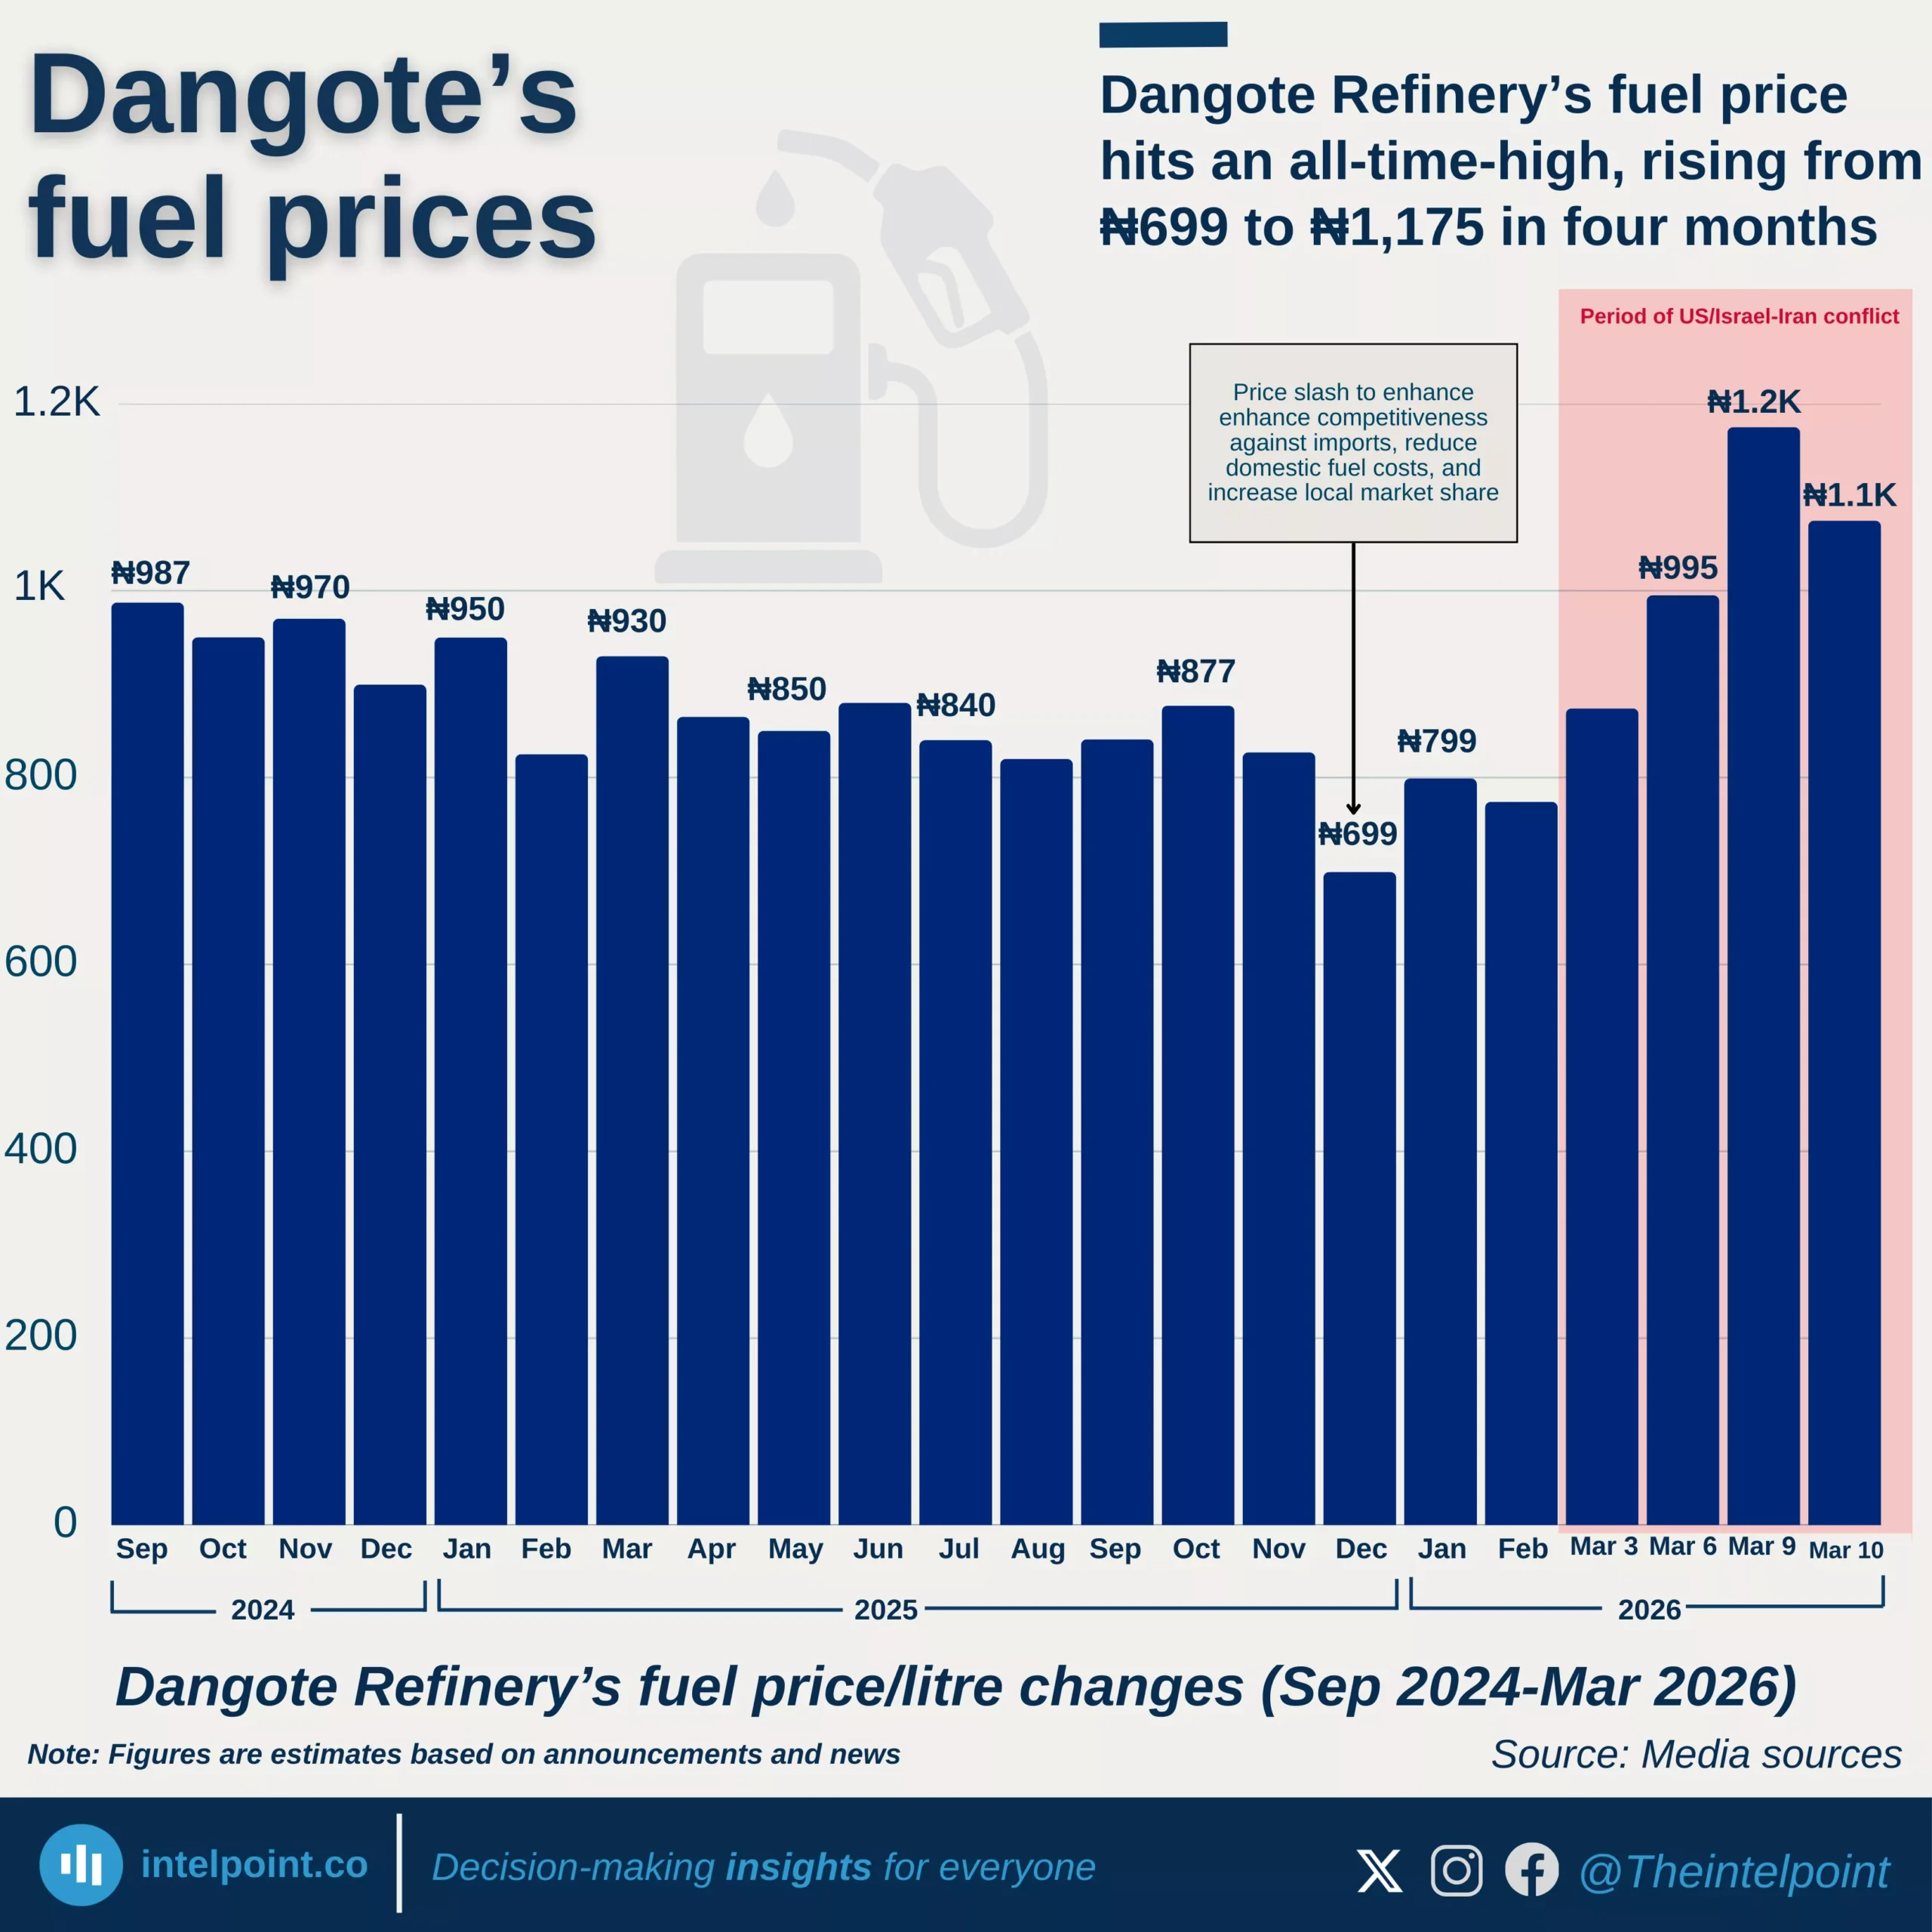
Fuel prices from Dangote Refinery reached an all-time high of ₦1,175 per litre in March 2026.
The lowest recorded price in the period was ₦699 per litre in December 2025, showing a wide price swing.
The jump from ₦699 to ₦1,175 happened in roughly four months.
Prices earlier in the timeline hovered mostly between ₦820 and ₦987 during late 2024 and much of 2025.
The December 2025 price cut was aimed at making locally refined fuel more competitive against imports.
After the price drop, fuel costs began rising again in early 2026, reaching ₦995 by early March before climbing further.
Global geopolitical tensions affecting oil markets contributed to the upward pressure on prices.
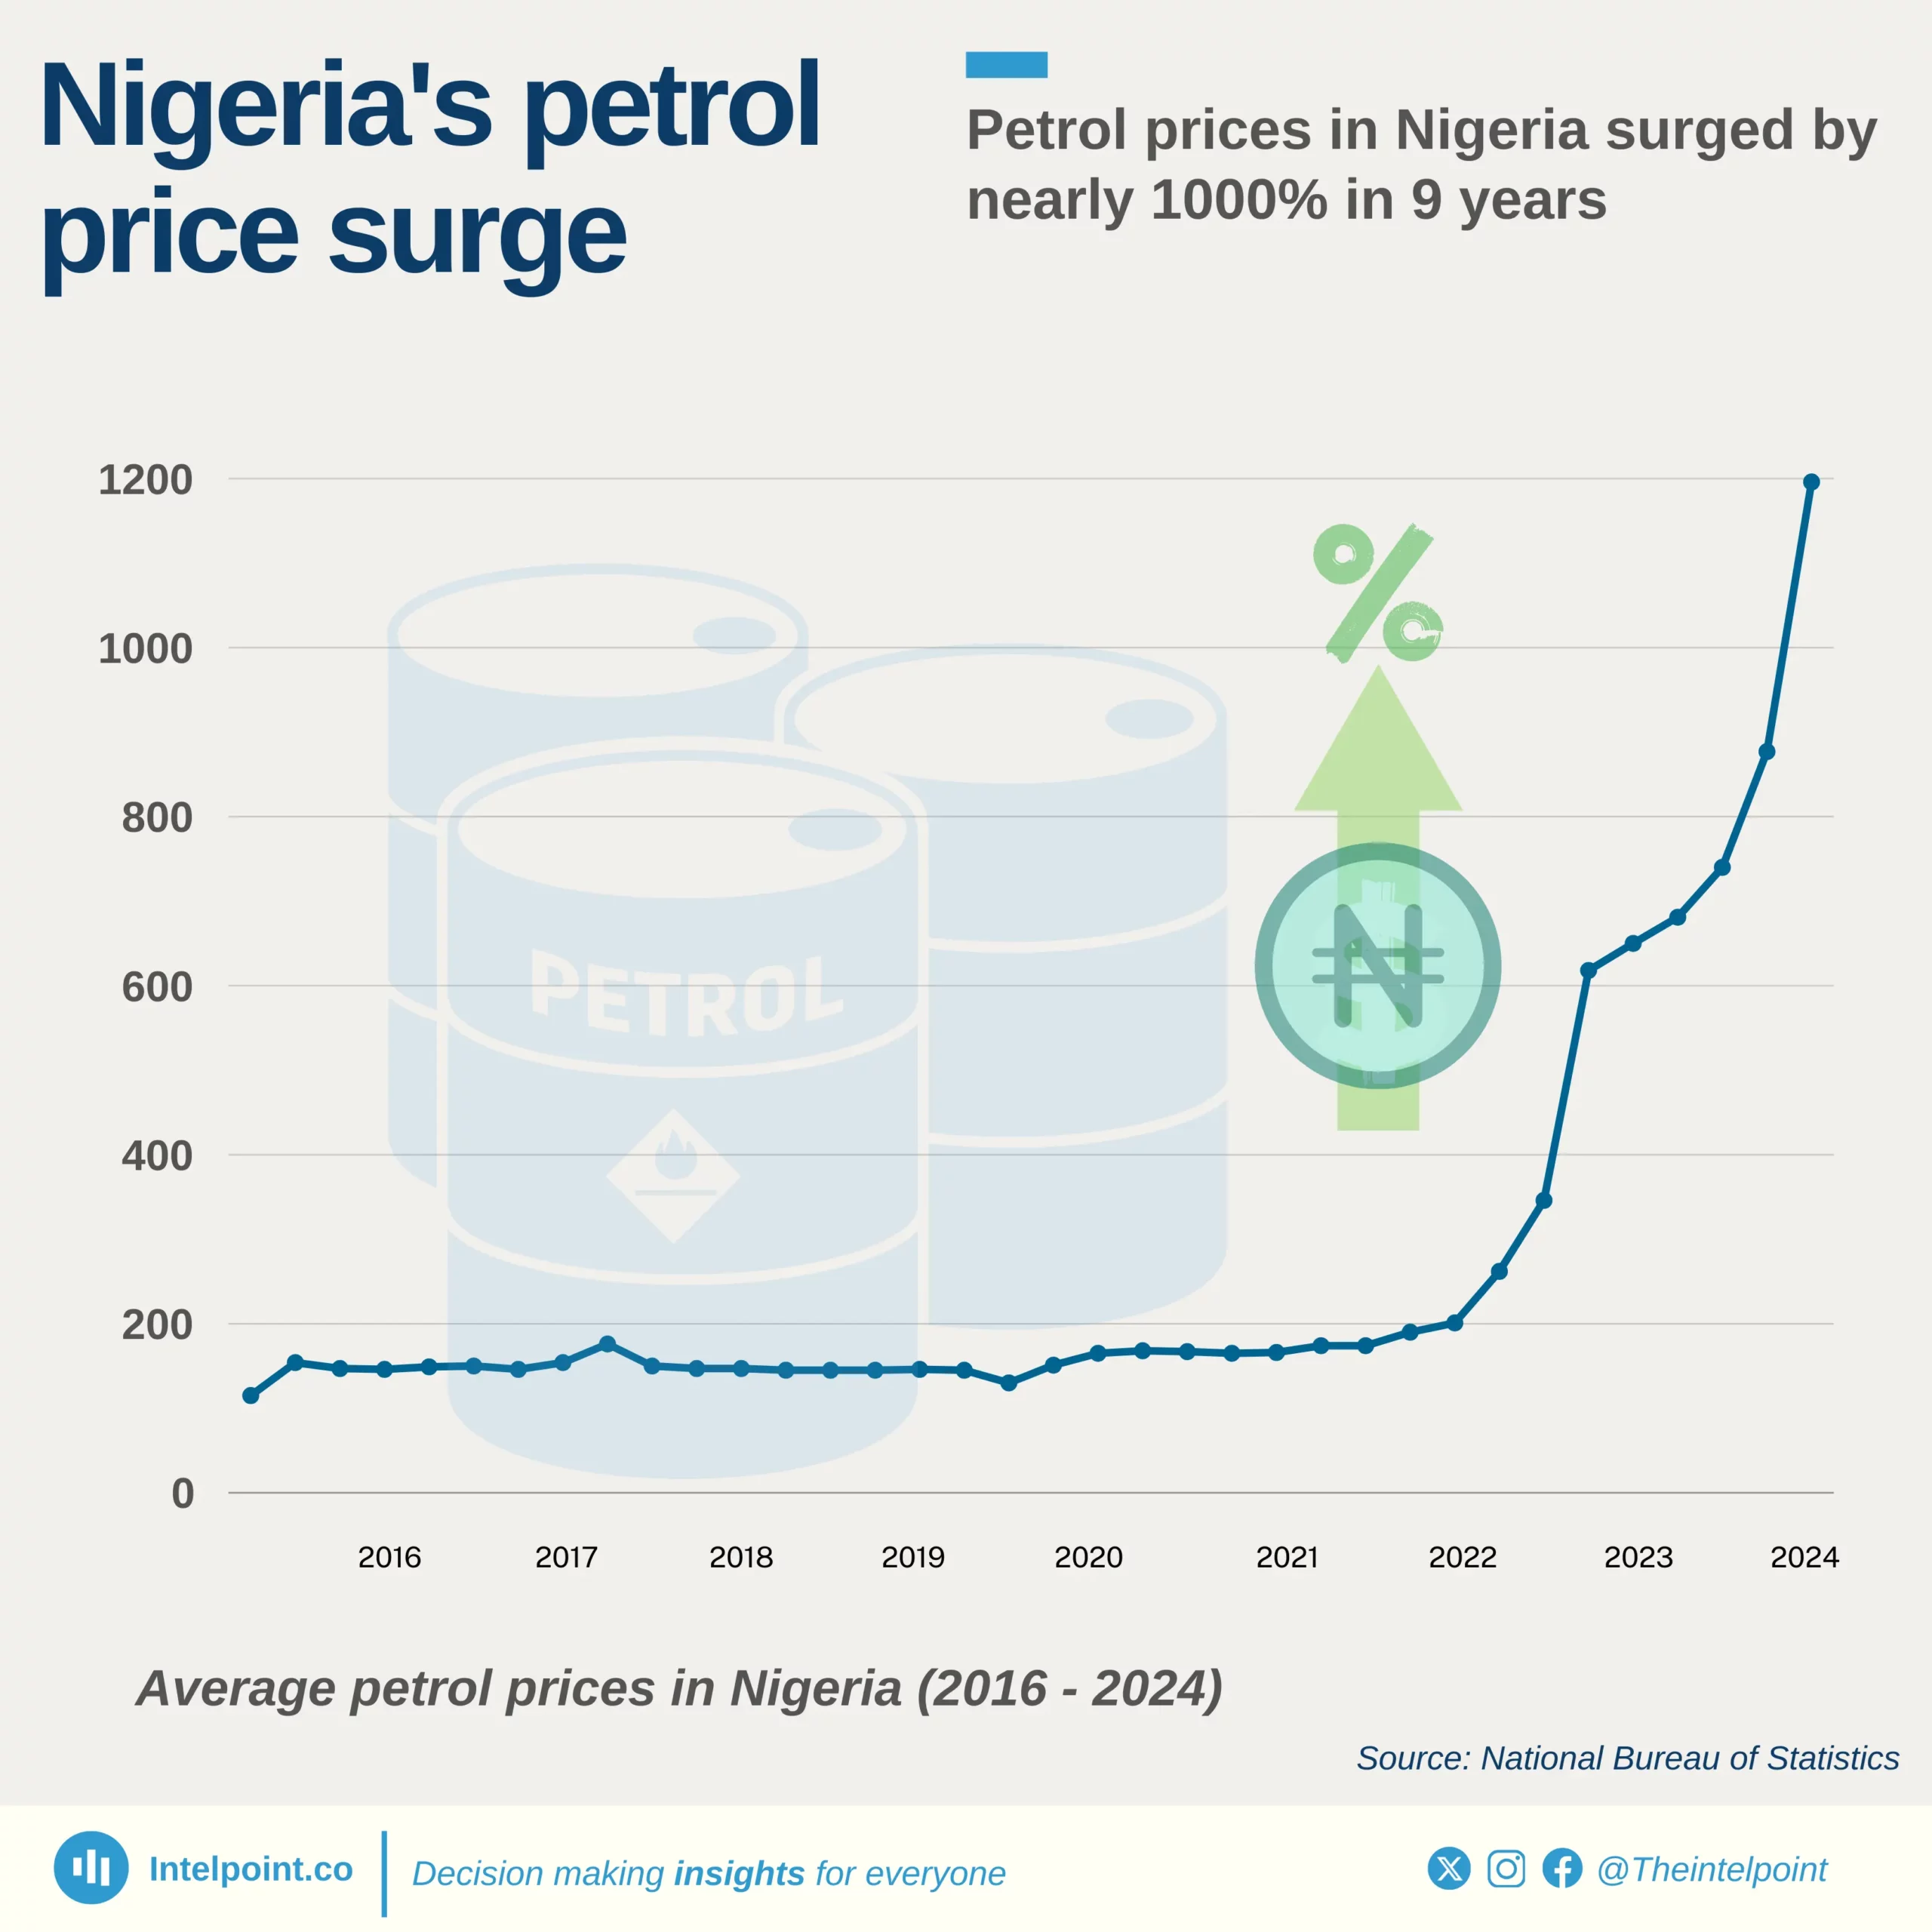
In February 2016, petrol was at its lowest price of₦99.80 per litre, marking the last time fuel prices remained below₦100.
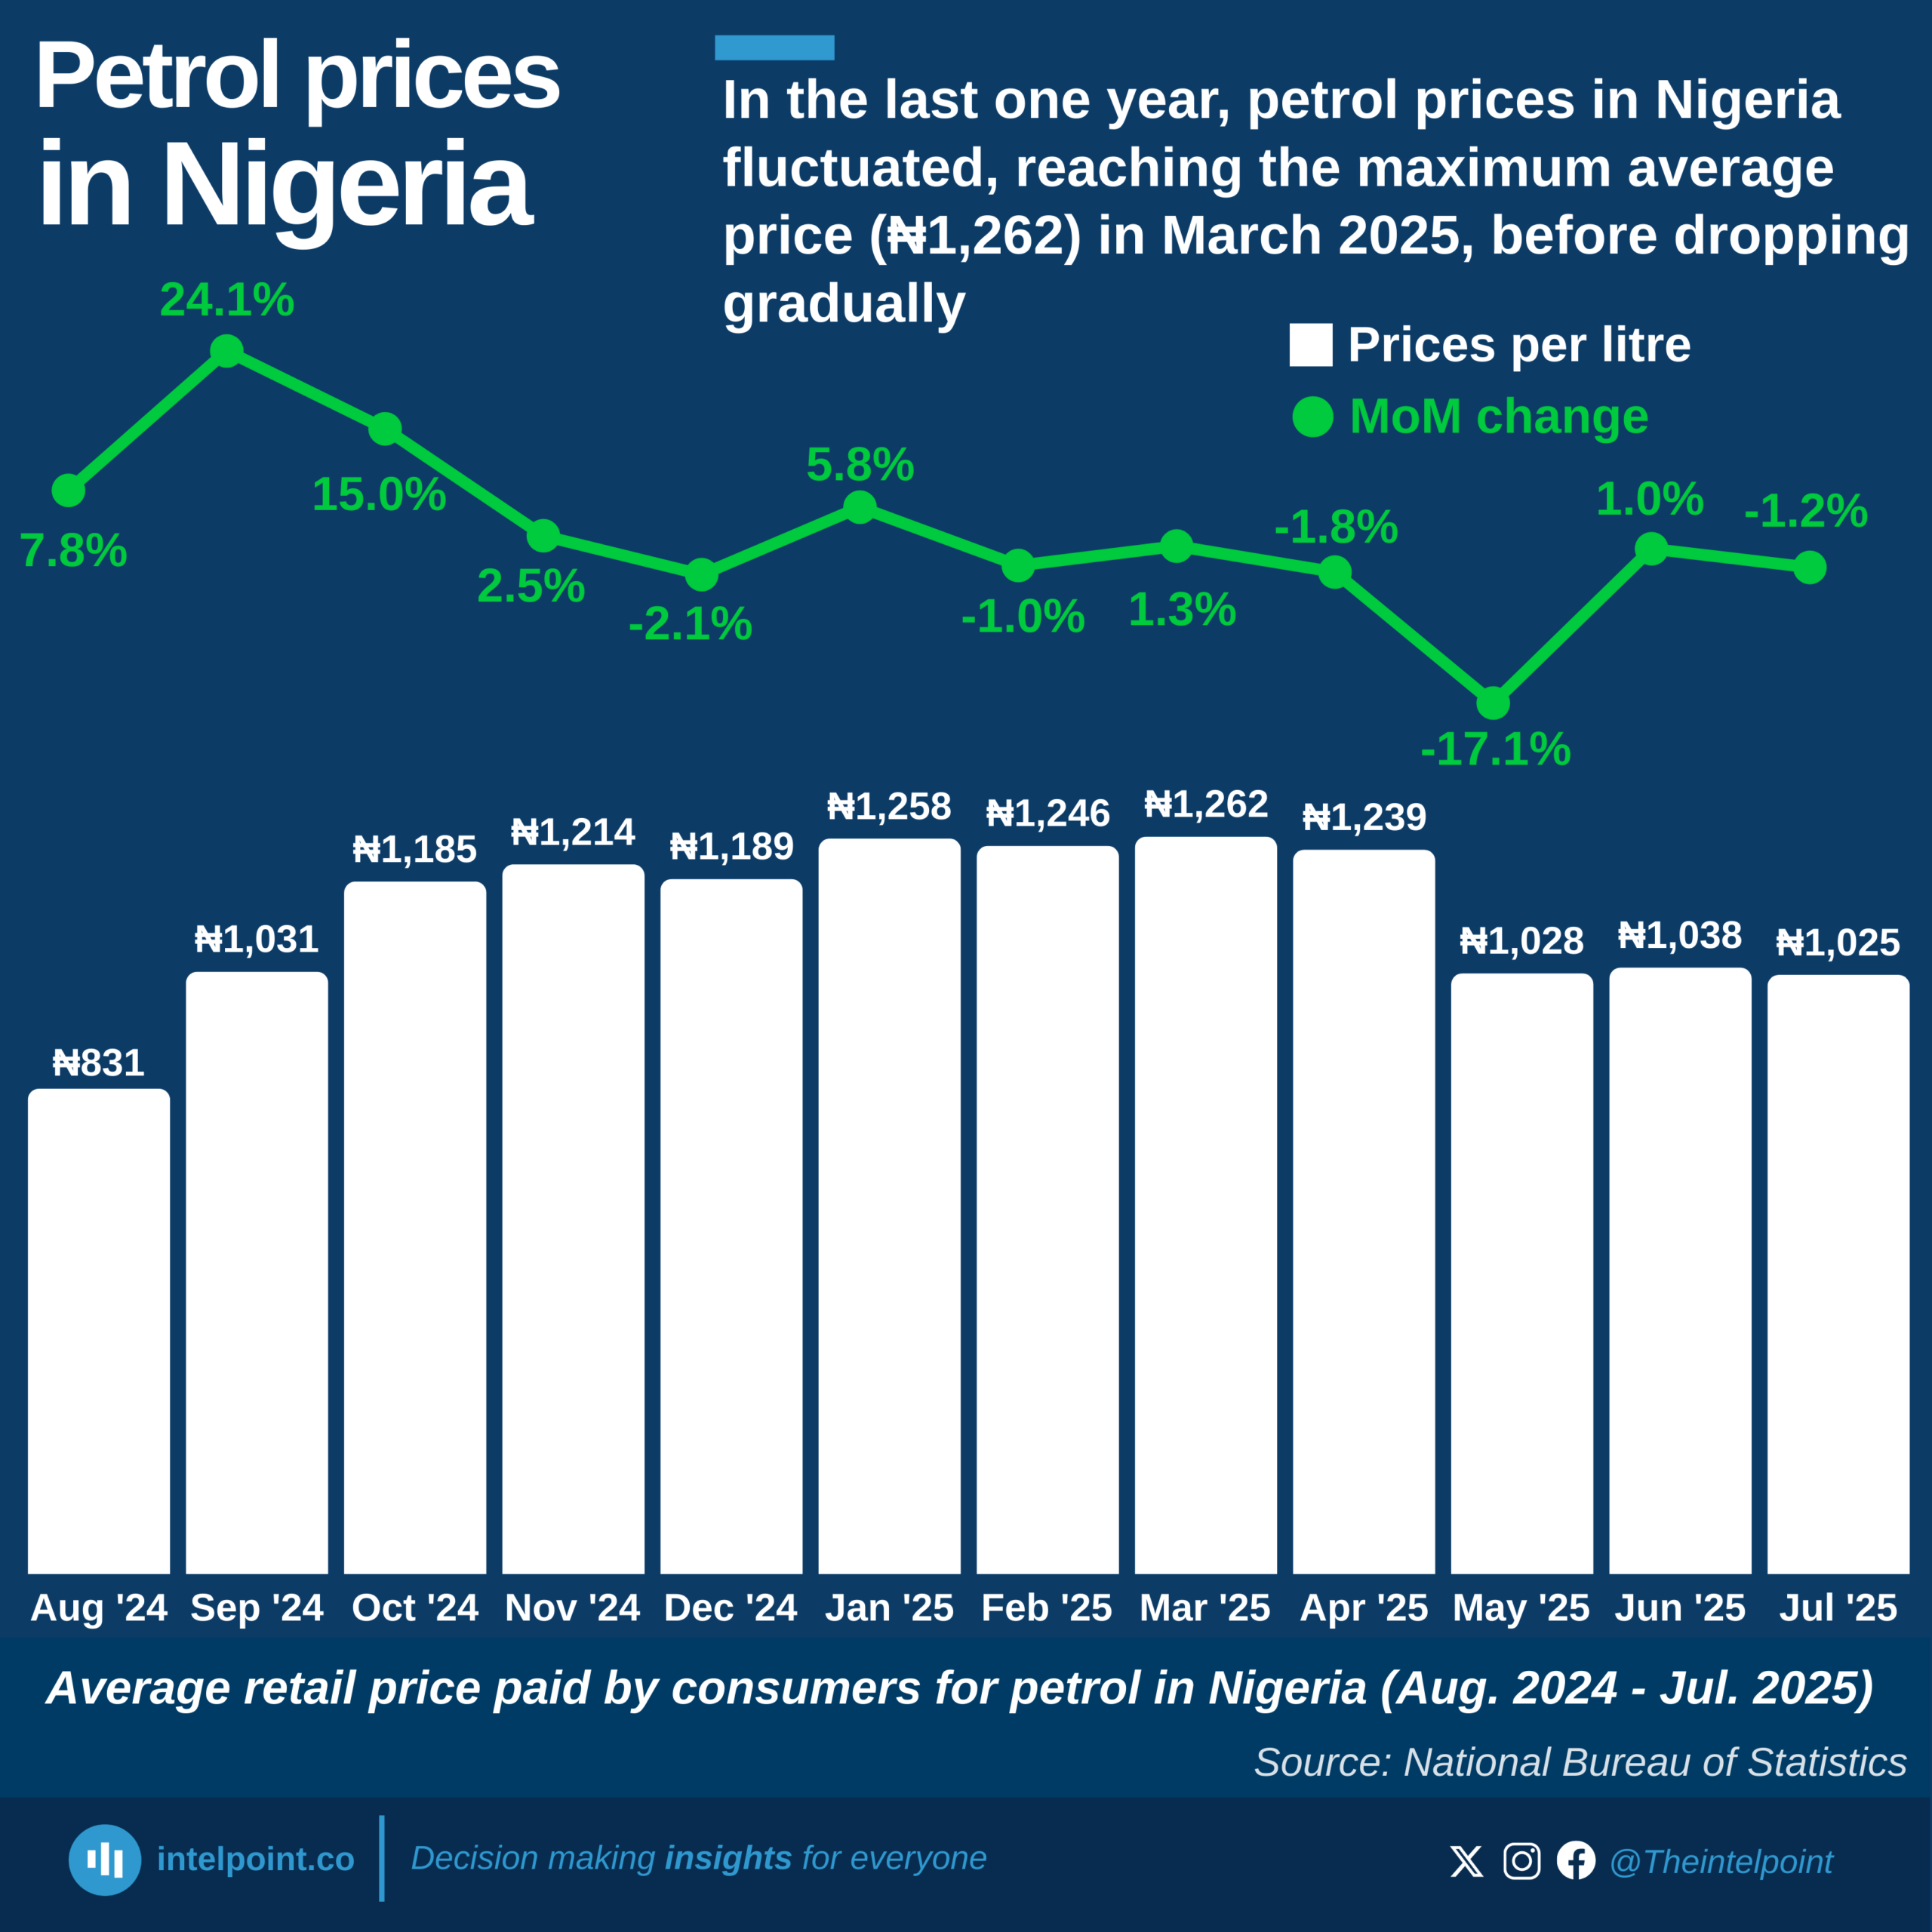
By November 2024, petrol prices soared to an all-time high of₦1,214.17 per litre, reflecting the compounded effects of inflation, currency depreciation, and global oil price volatility.
Over the nine-year period, the average petrol price stood at₦272.65 per litre.
Between January 2016 and December 2024, petrol prices increased by ₦1,079.52, a staggering 984.96% rise, emphasising the long-term upward trajectory influenced by economic challenges, subsidy removals, and fluctuating exchange rates.
The most volatile period recorded a month-to-month price surge of over 129.23%.
In 2023, Nigeria saw a 17% reduction in petrol supply as imports fell by nearly 14% from 23.5 billion litres in 2022 to 20.3 billion litres.
The removal of the fuel subsidy in May 2023 led to higher prices and lower demand, especially in the second half of the year.
The Dangote refinery’s rising output could shape future supply.
Since 2020, the Nigerian National Petroleum Company Limited (NNPC) has seen a 1,048% profit increase, totalling ₦6.8 trillion over four years.
From nearly eliminating losses in 2019, NNPC achieved a 16,982% profit surge in 2020. The growth persisted with 135% in 2021 and 278% in 2022.
Despite a steady 29% increase in 2023, rising debts and fuel scarcity cast doubt on the sustainability of this success.
In 2022, Egypt, South Africa, Nigeria, Algeria, and Morocco collectively consumed an average of 2.712 million barrels of oil per day (Mb/d), 61% of the continent's daily oil consumption (4.478 Mb/d). African countries consumed 4.7% of the global usage (99.8 Mb/d).
Egypt used the most (850.5 thousand barrels per day (Kb/d)), followed by South Africa (601.2 Kb/d) and Nigeria (514.5 Kb/d).
Can’t find what you’re looking for? Please fill the form below