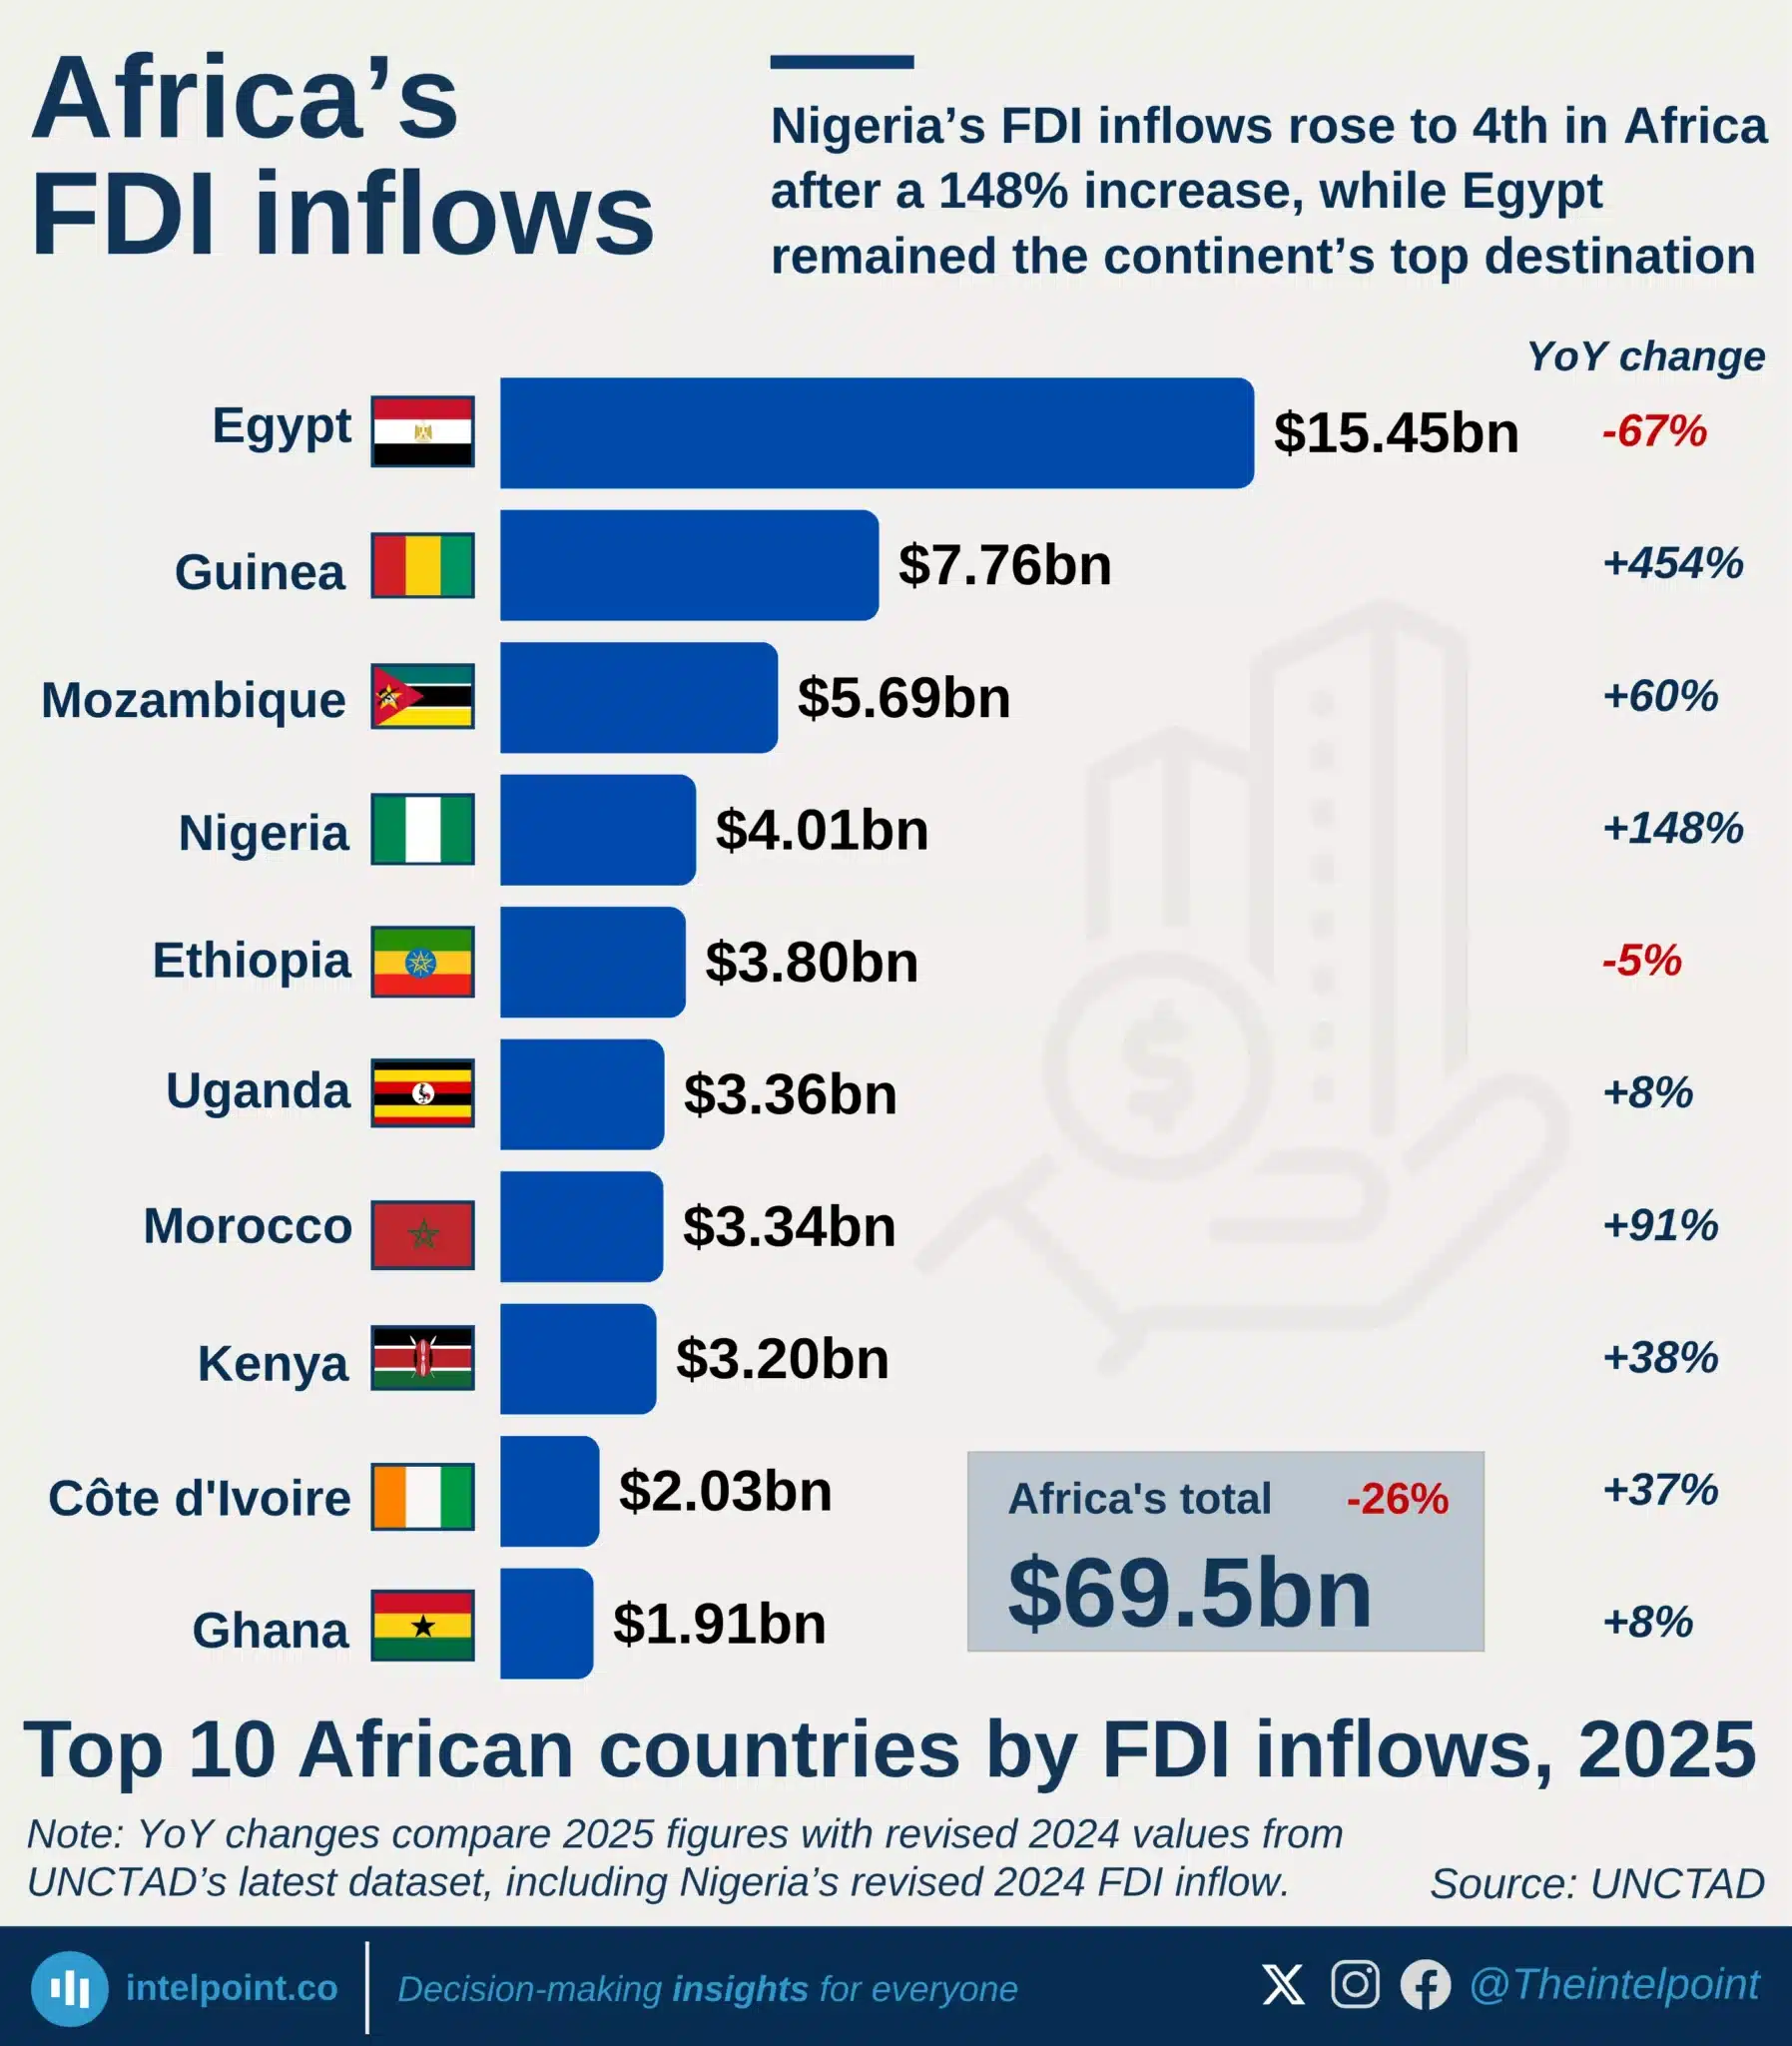
Egypt remained Africa’s top FDI destination with $15.45bn.
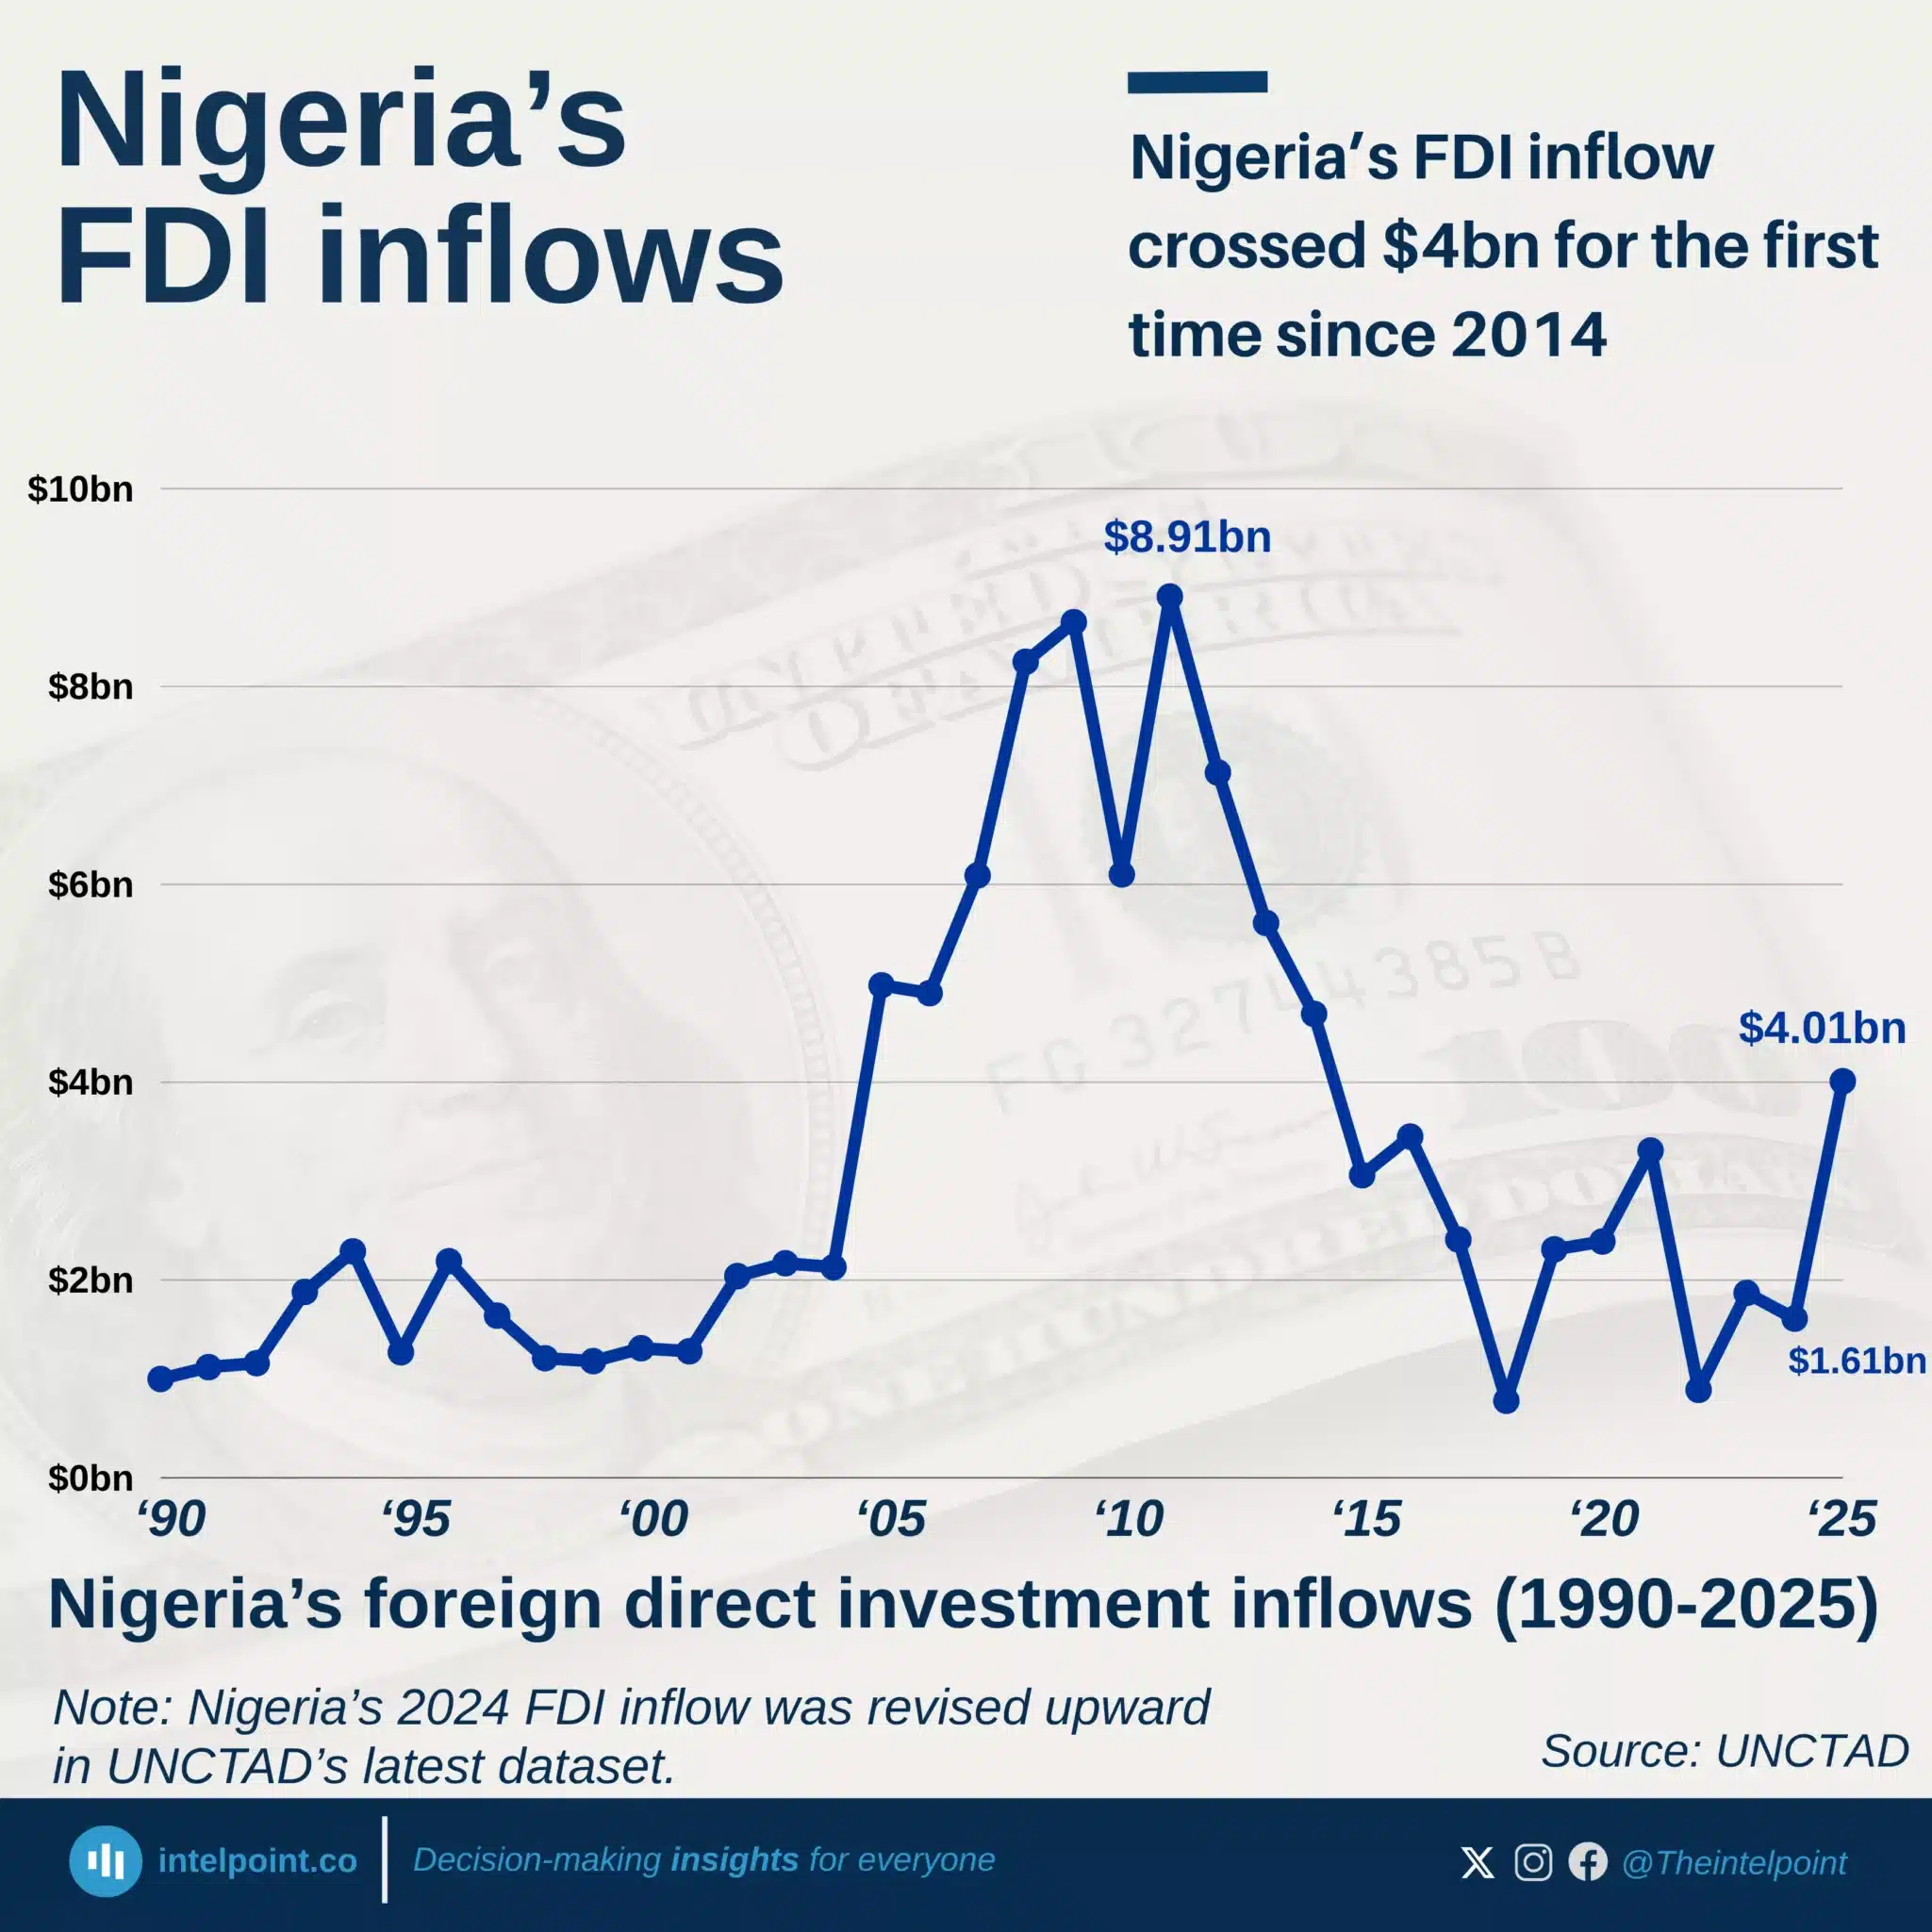
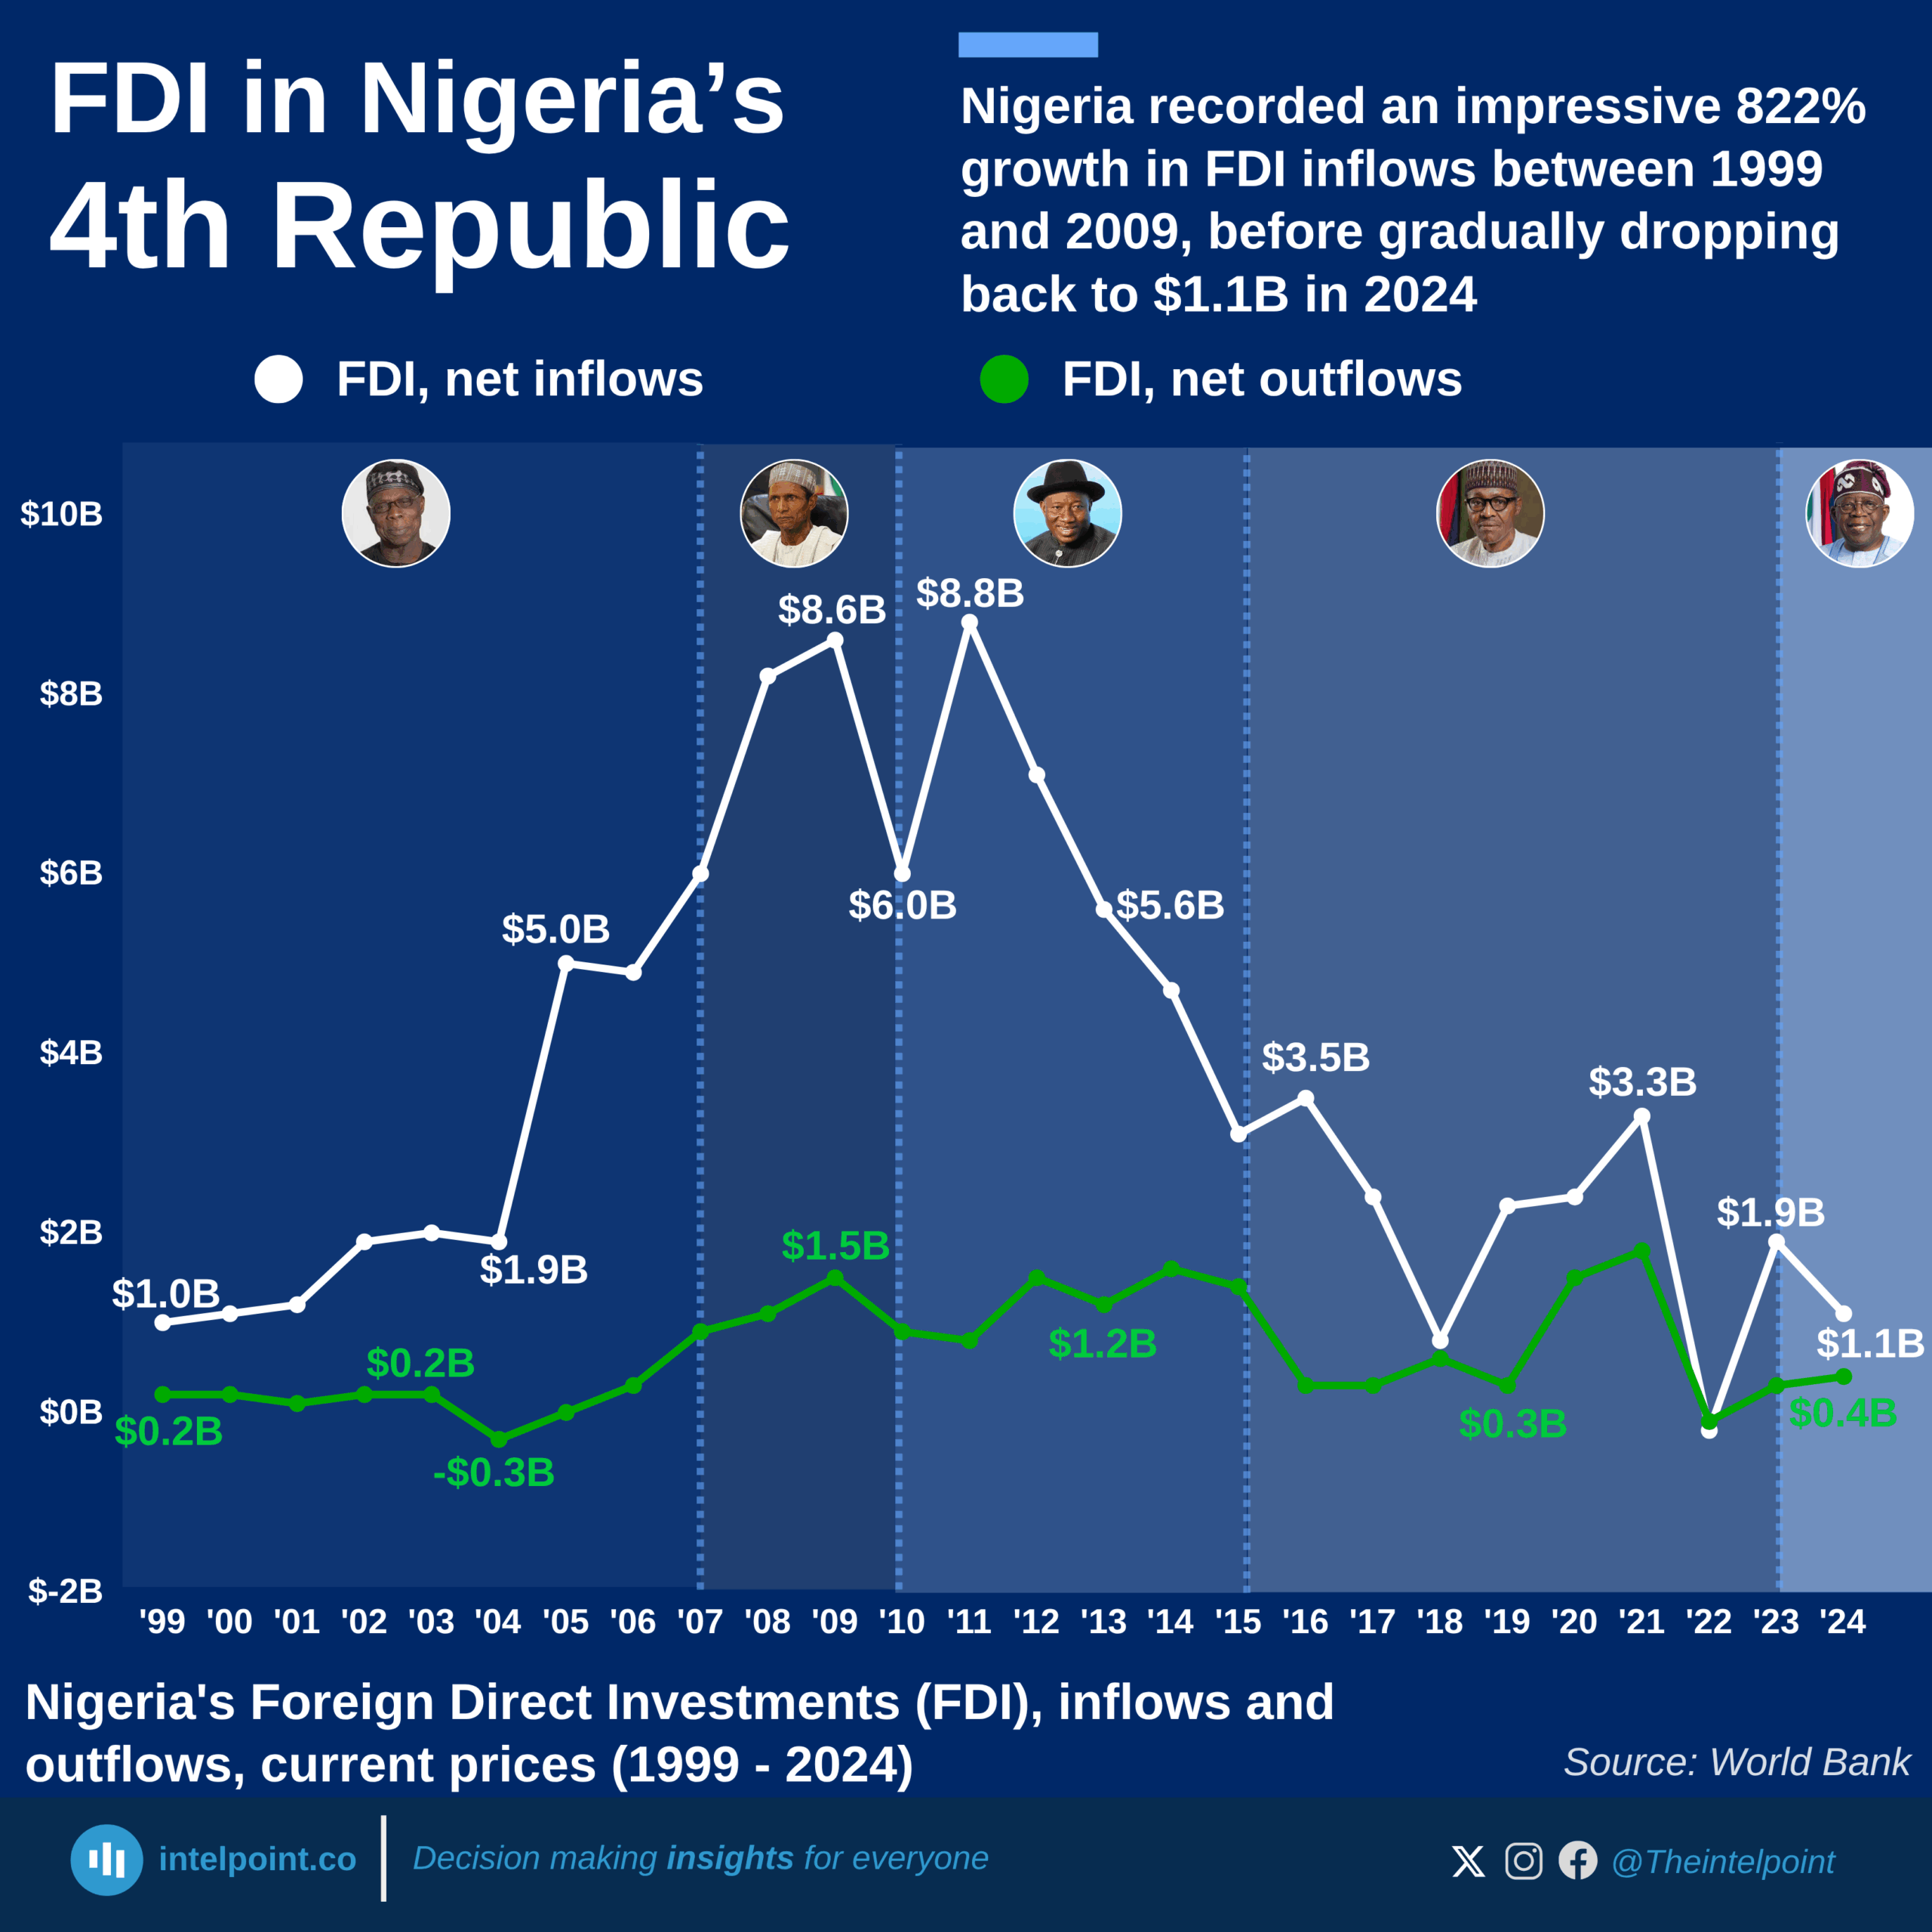
Nigeria ranked 4th after FDI inflows rose 148% to $4.01bn.
Guinea had the biggest top-10 jump, rising 454% to $7.76bn.
Africa’s top 10 accounted for 73% of total FDI inflows.
Europe ($12.58 trillion), Asia ($11.88 trillion), and the Americas ($11.49 trillion) are nearly tied after 35 years, each capturing roughly a third of global FDI
Asia grew from just $25 billion annually in 1990 to consistently attracting $600-700 billion per year, showing the most stable growth pattern
Major crises (2001, 2008-09, 2020, and 2022) caused dramatic swings, with Europe even recording negative flows in 2022
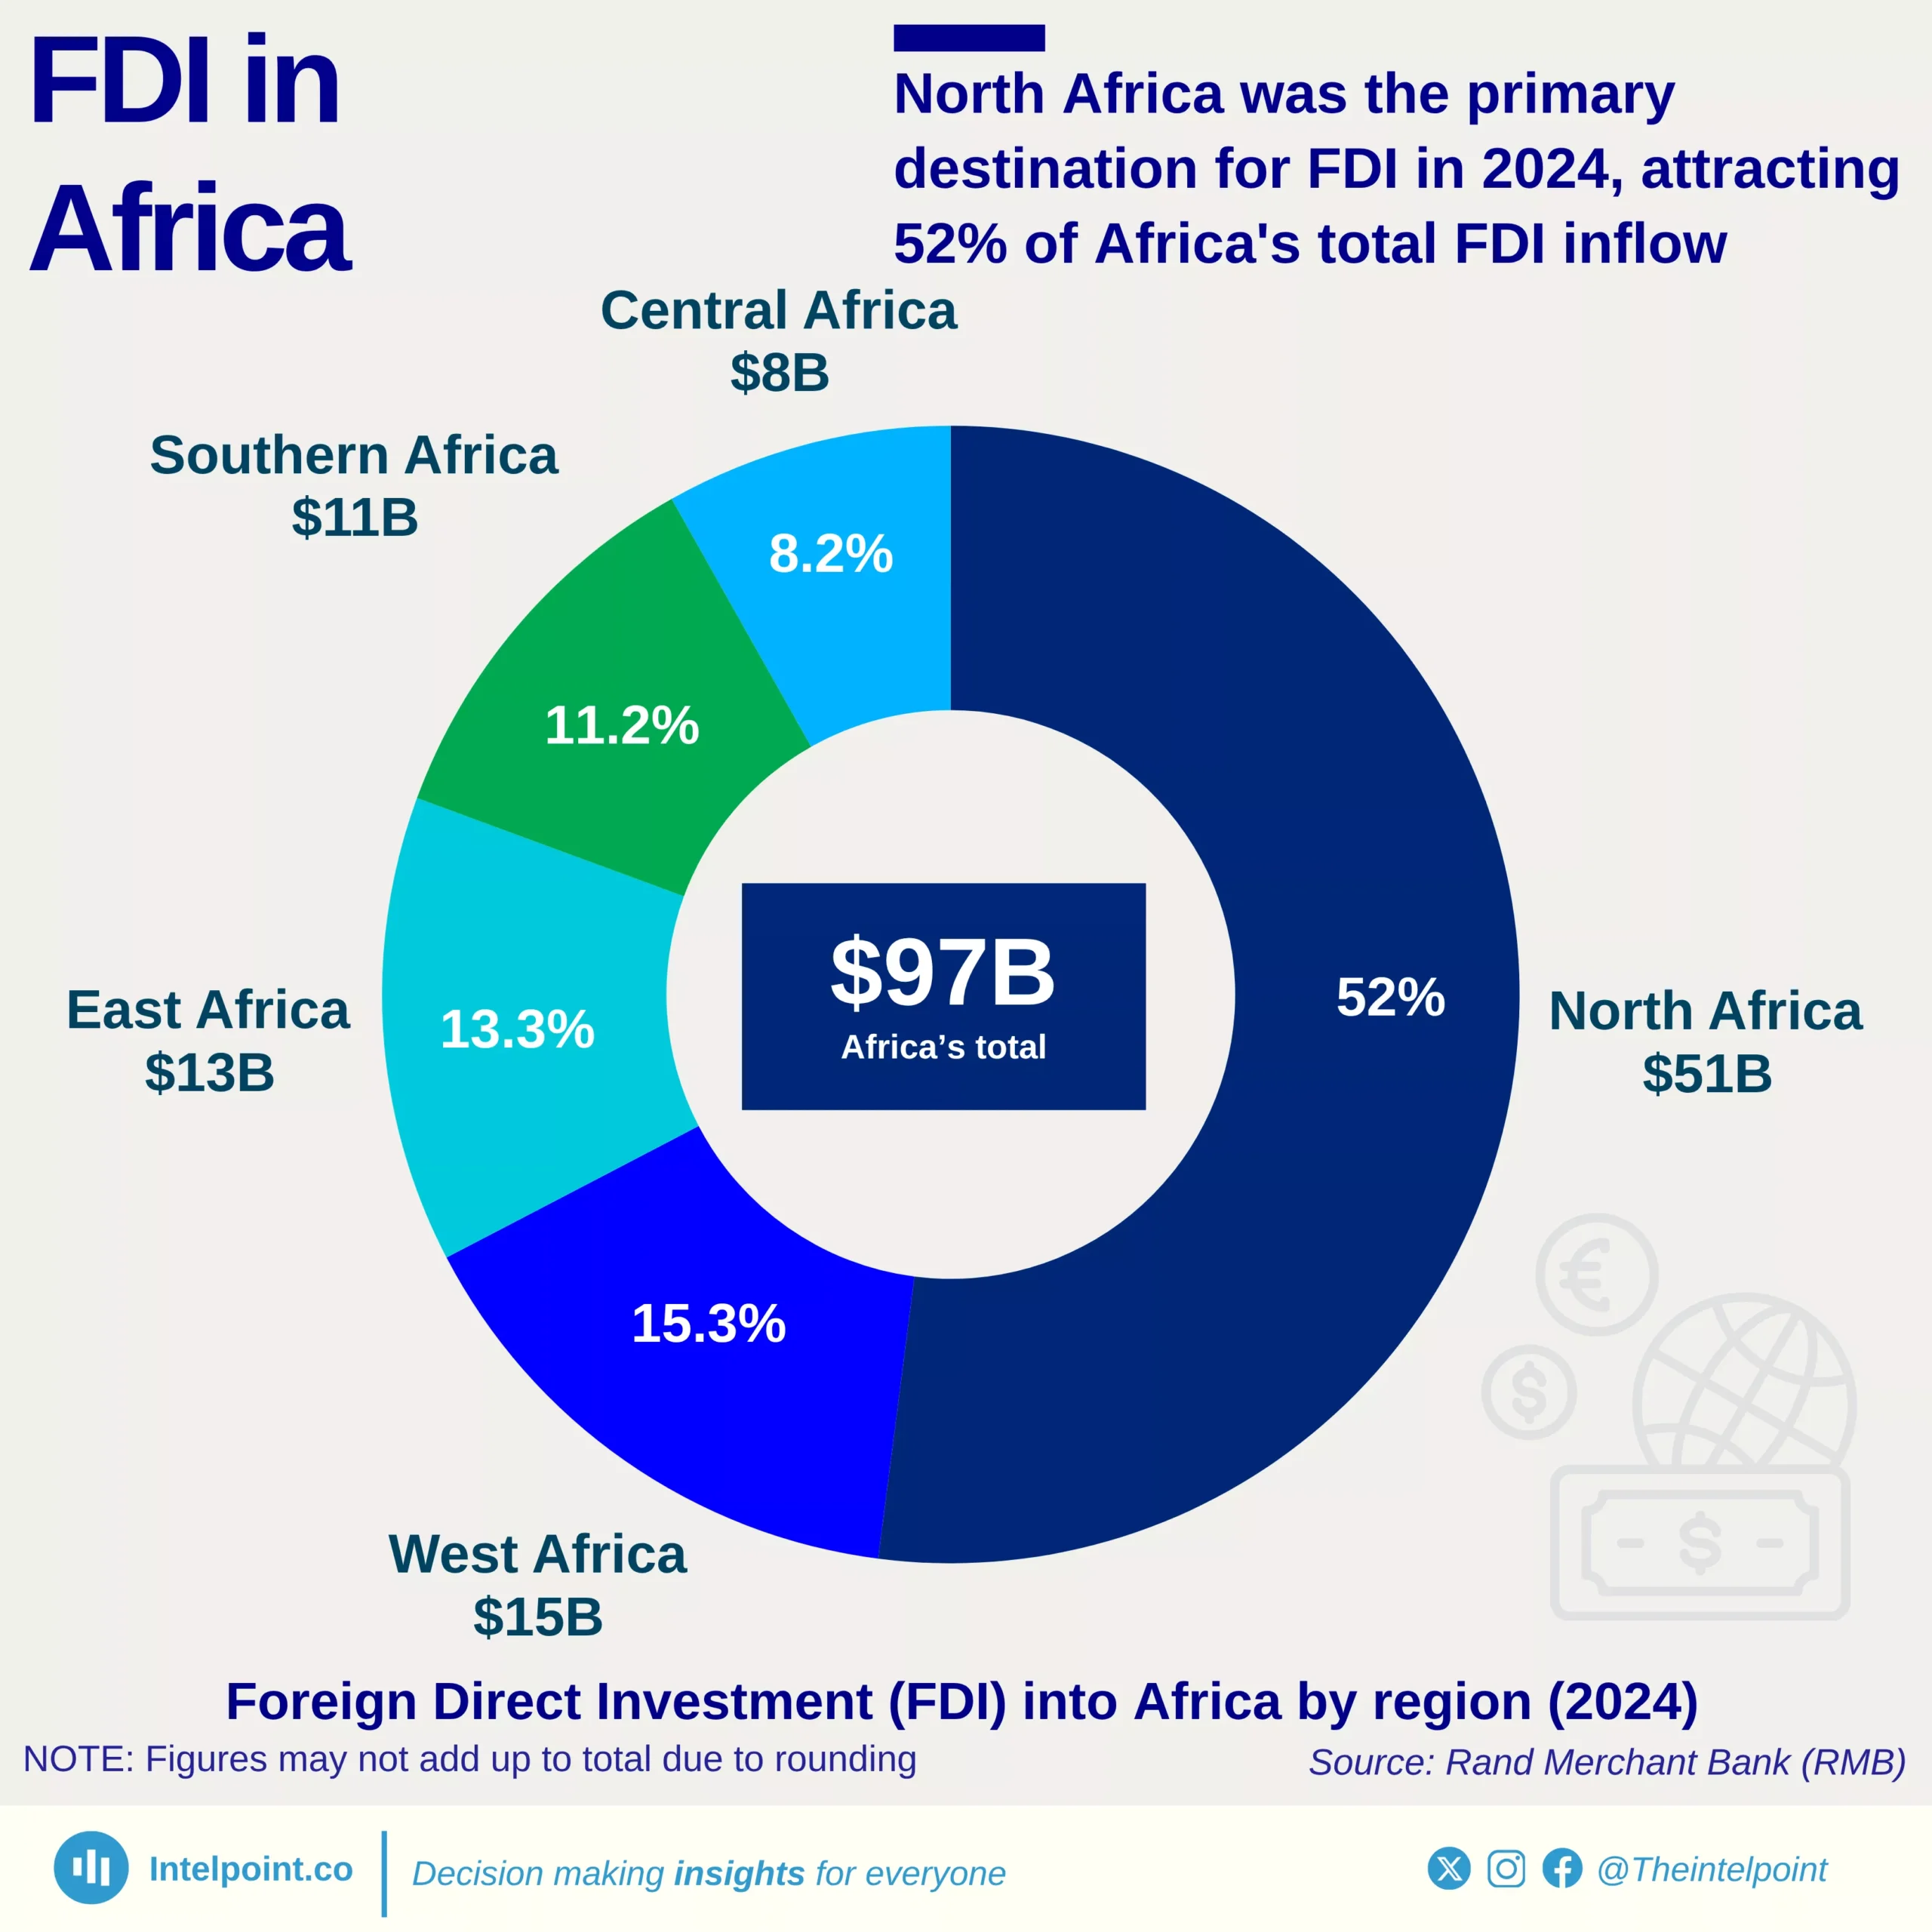
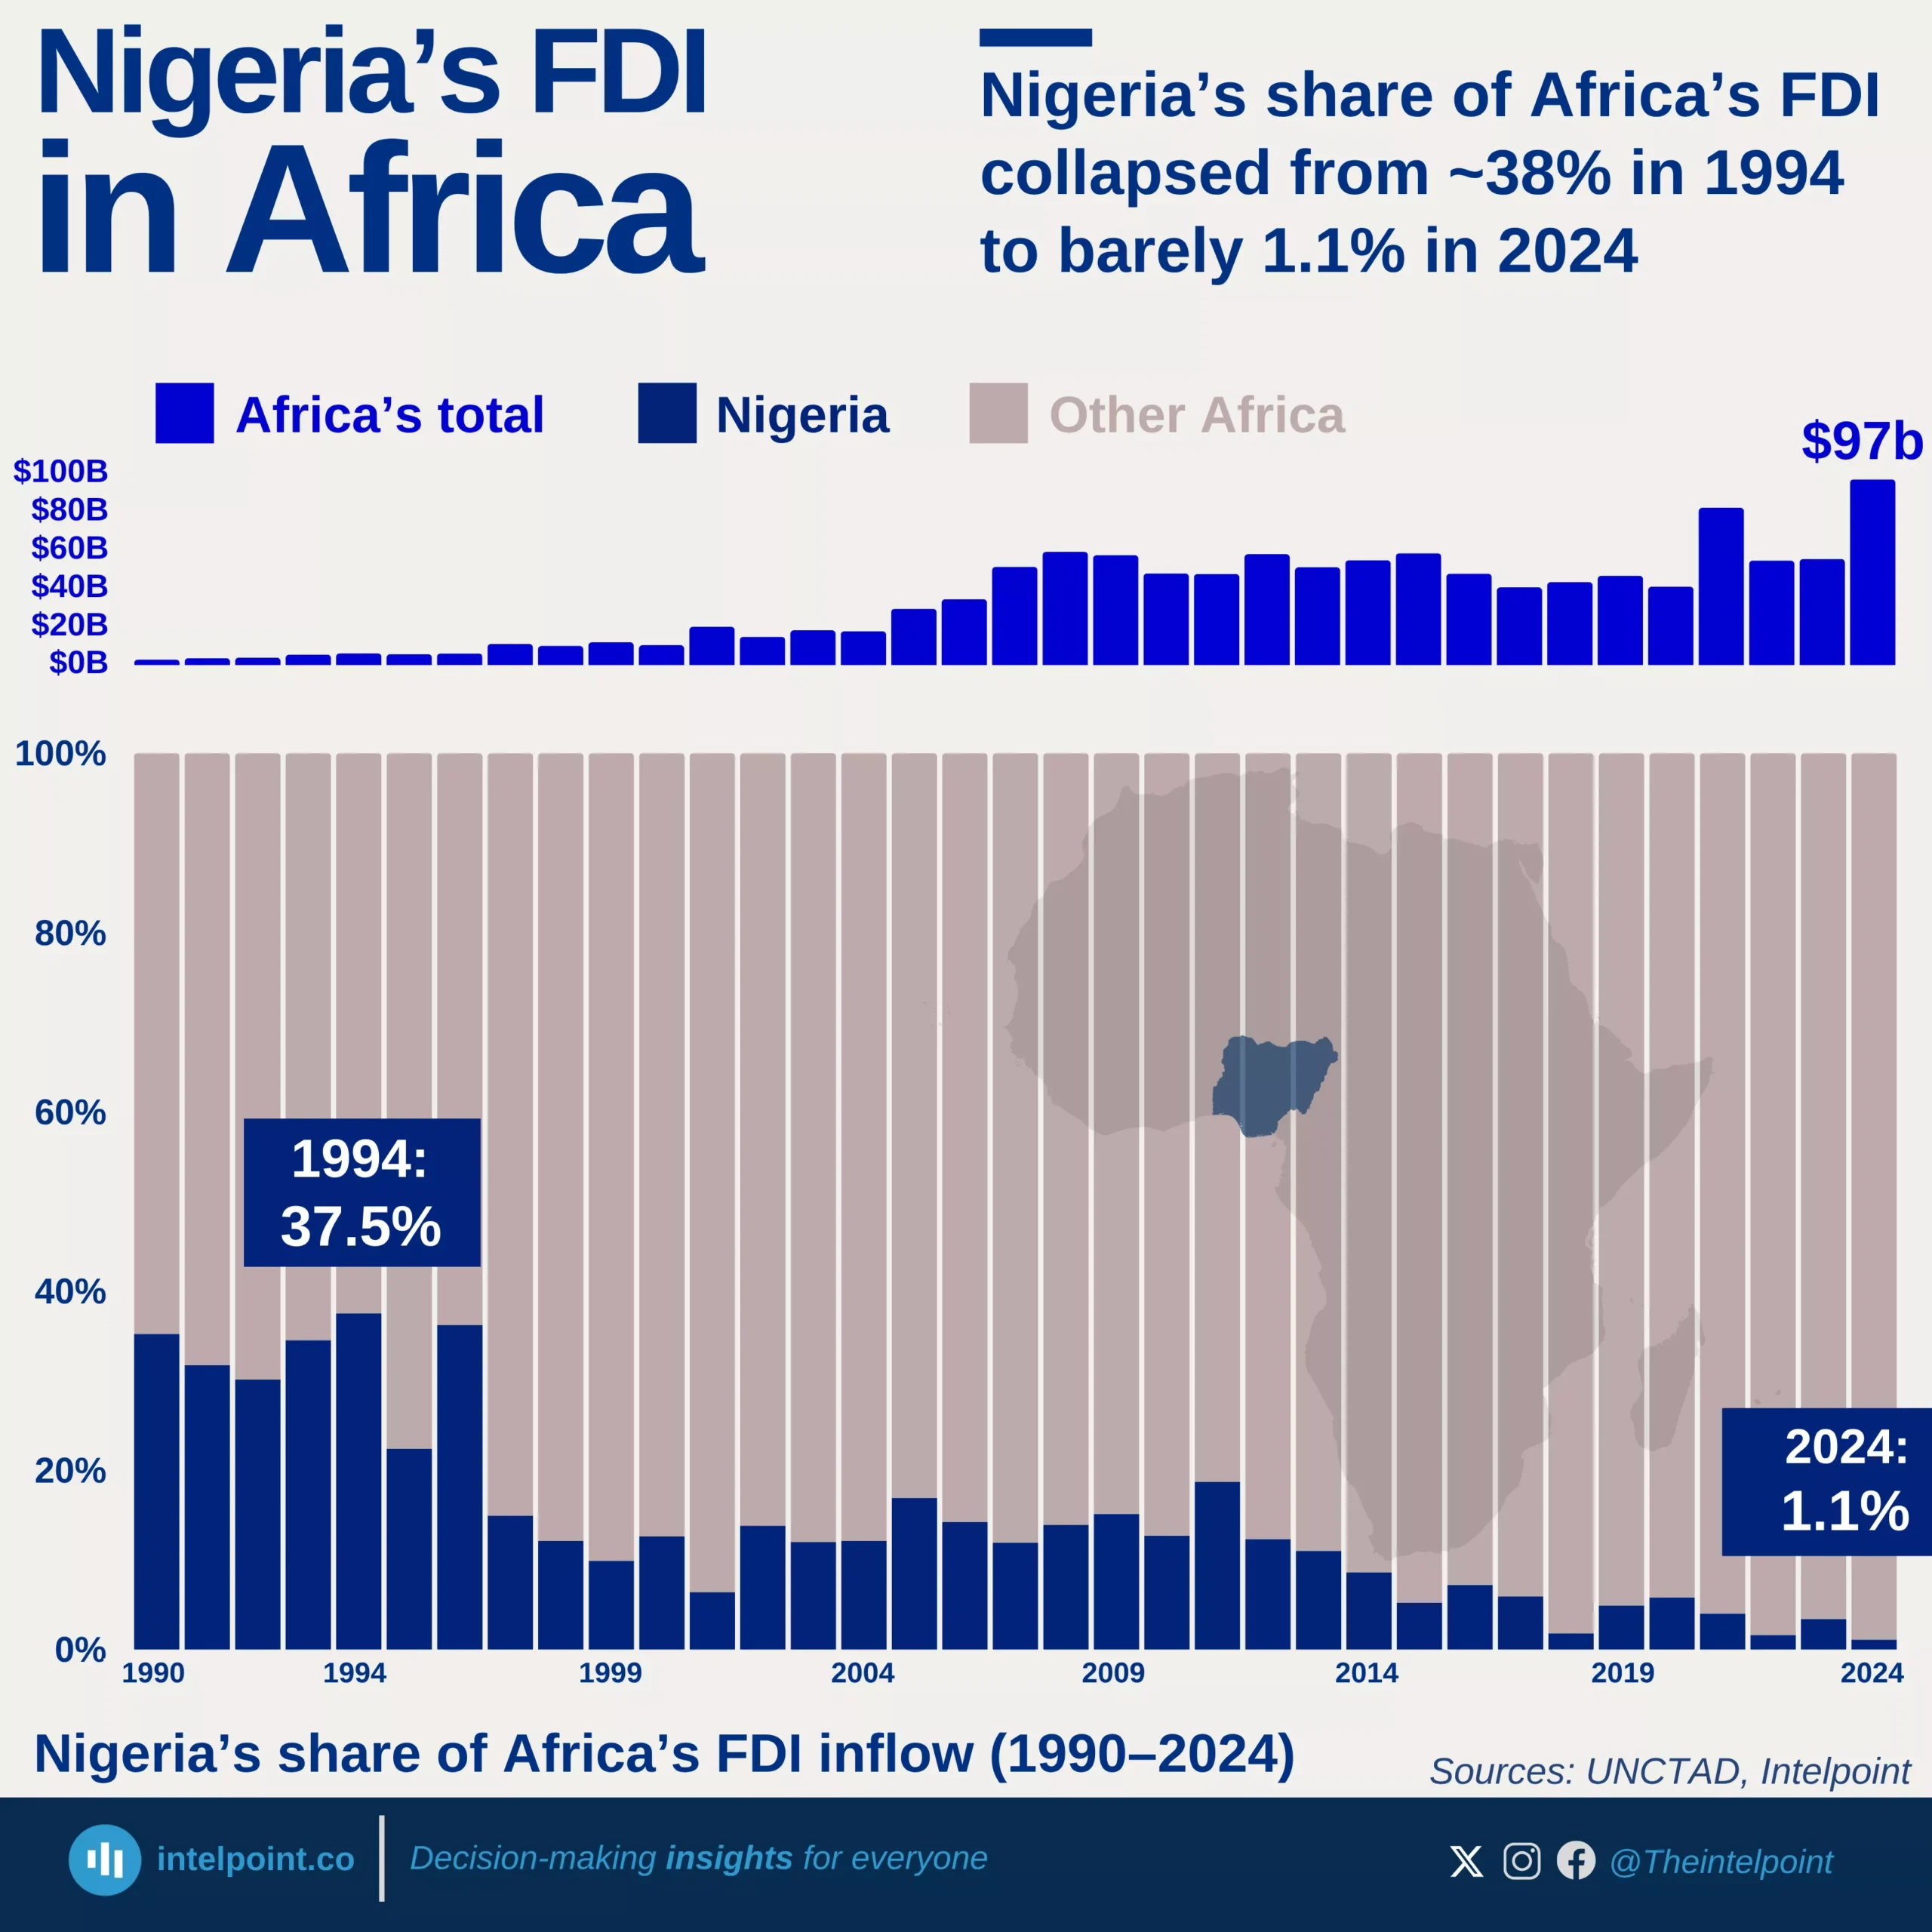
Africa and Oceania combined received just 6% of total FDI, remaining far behind despite Africa's recent acceleration to $97 billion in 2024