Three African countries have a debt-to-GDP ratio above 100%, with Sudan at 238.8%

  • Sudan’s debt-to-GDP ratio of 238.8% is the highest in Africa and over twice the size of its economy.
  • Three African countries—Sudan, Cabo Verde, and Zambia—have debt burdens exceeding 100% of their GDP.
  • Egypt, Mozambique, and the Congo Republic follow closely with ratios above 88% each, despite efforts at economic reform.
  • Ghana and Sierra Leone are also in the top 10, showing that West Africa isn’t exempt from debt pressure.
  • Nigeria, while not in the top 10, has a debt-to-GDP ratio of 41.3% and ranks 43rd in Africa.
  • A high debt-to-GDP ratio often limits a country’s ability to invest in growth-driving sectors, even if the economy is growing nominally.

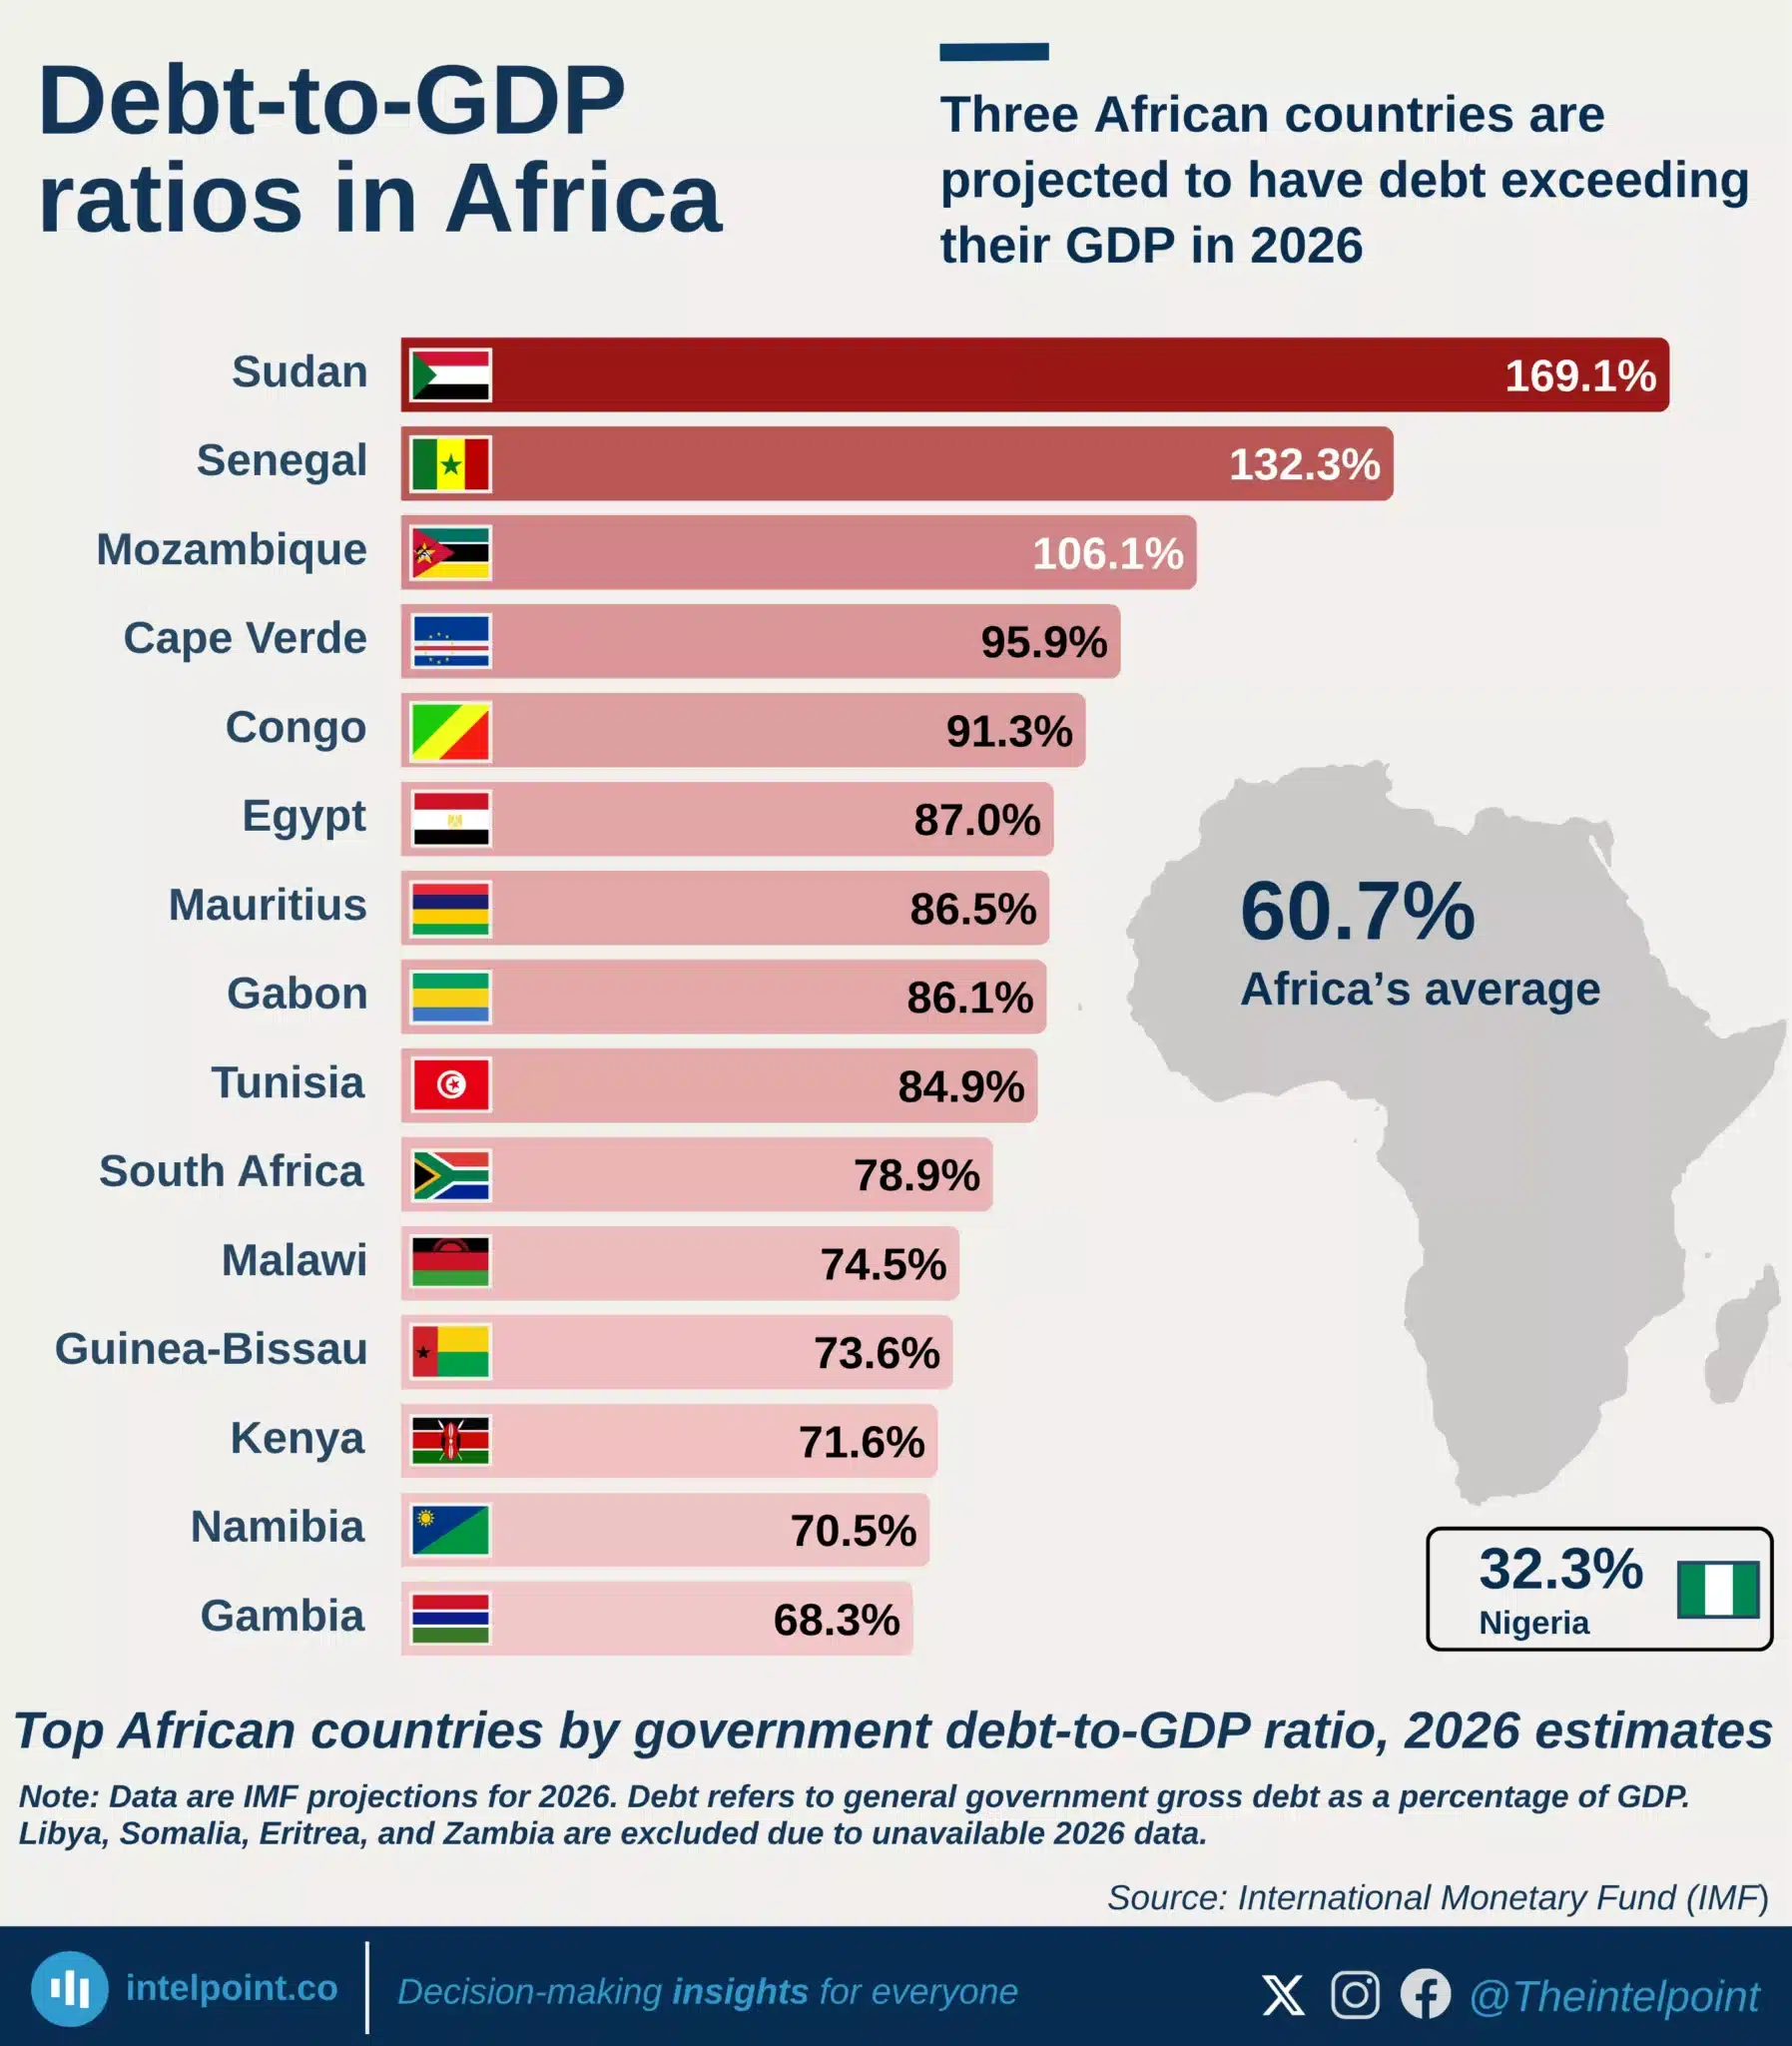
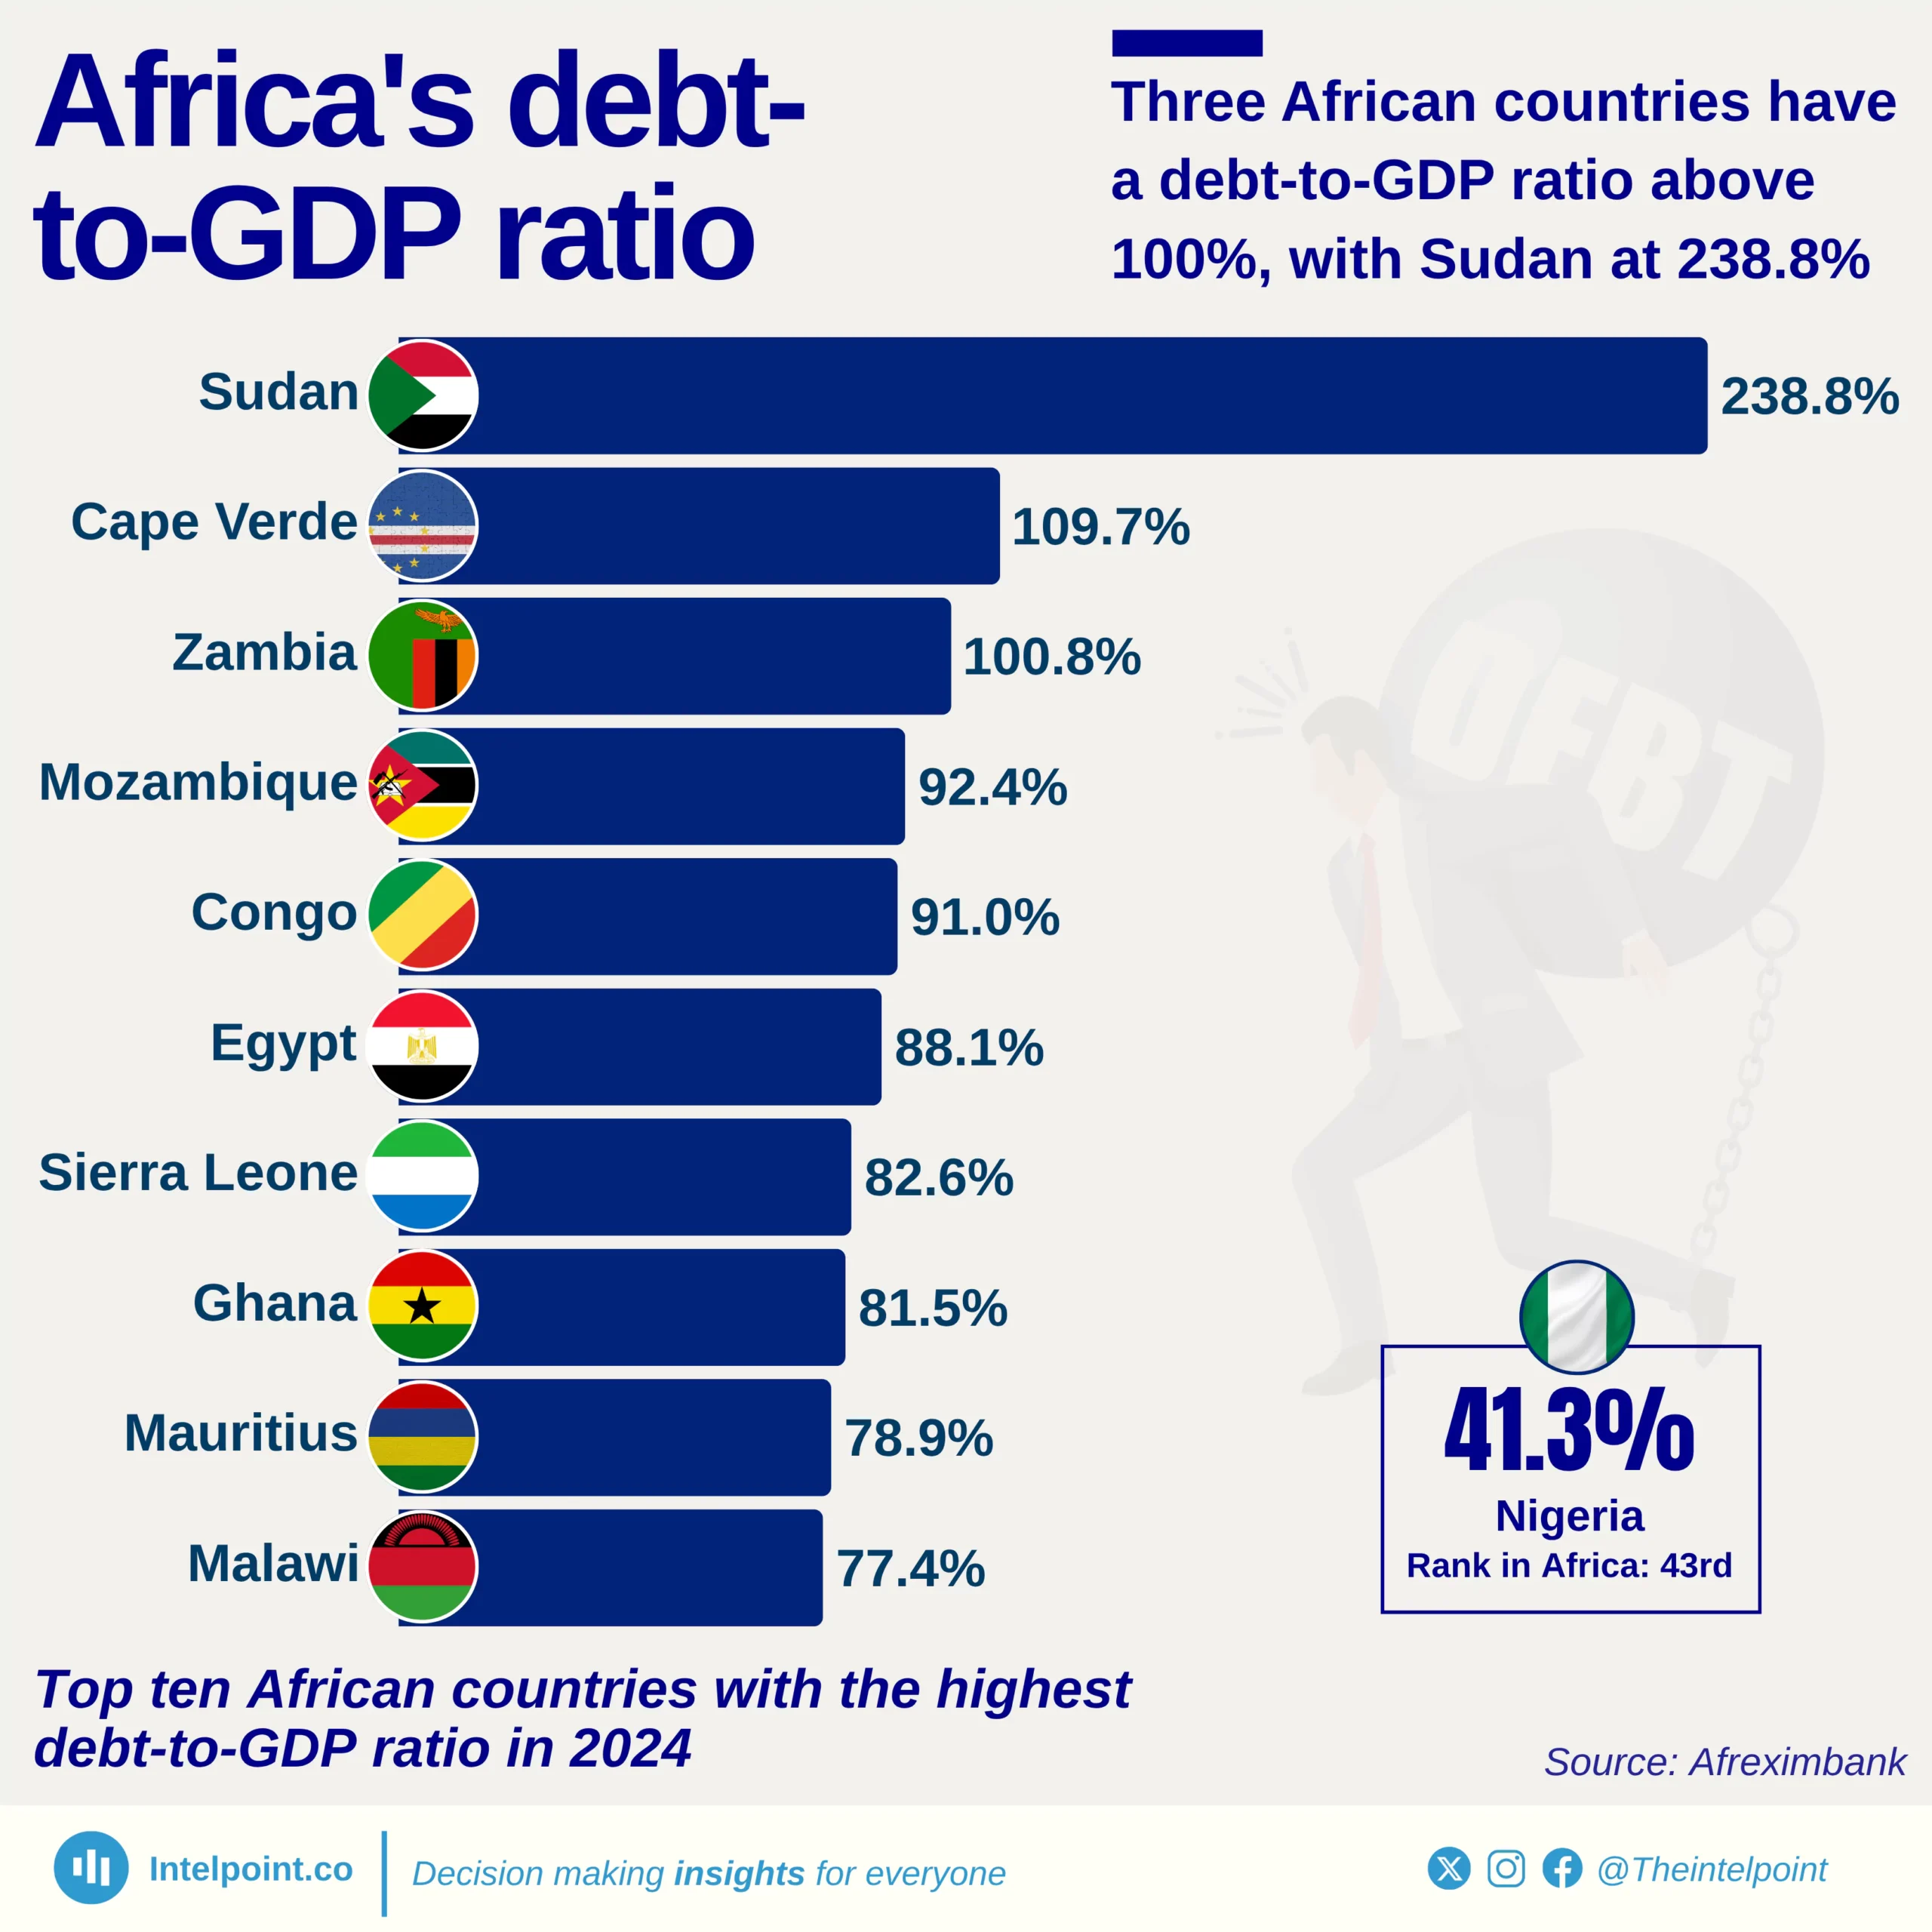
Africa's debt landscape remains a source of concern, with some countries now owing more than their economies produce in a year. As of 2024, Sudan leads the continent with a debt-to-GDP ratio of 238.8%, followed by Cabo Verde at 109.7% and Zambia at 100.8%. These figures suggest that while borrowing can be a tool for development, it can also signal deep fiscal imbalance, especially when not matched with productive investments or economic growth.

A closer look reveals that all of the top 10 most indebted African countries have debt levels exceeding 75% of their GDP. This high debt burden places pressure on public finances, leaving less room for spending on crucial sectors like health, education, and infrastructure. Even countries like Egypt and Mozambique, which have made strides in sectors like tourism and natural resource exports, still find themselves weighed down by heavy debts.

Interestingly, while some economies are struggling under high debt levels, others like Nigeria appear relatively stable in comparison, with a debt-to-GDP ratio of 41.3%. But this doesn’t tell the whole story, as it’s possible to have low debt ratios yet still struggle with revenue generation, debt servicing, or currency instability.

Source:

Afreximbank

Period:

2024
HTML code to embed chart
Want a bespoke report?
Reach out
Tags
Related Insights

Nigeria’s public debt rises to $99.7 billion (₦152.4 trillion) as of June 2025
  • Nigeria’s public debt rose to $99.7 billion, up from $91.3 billion in June 2024, marking a return to growth after a dollar-value decline in 2024.
  • The debt in local currency climbed to ₦152.4 trillion, reflecting both borrowing and continued naira depreciation.
  • The increase underscores ongoing domestic financing challenges and vulnerability to exchange-rate fluctuations.
  • The growth in dollar terms points to renewed external borrowing as the government manages debt obligations post-2024 volatility.

Nigeria’s GDP growth peaked at 14.6% in 2002 after years of expansion, now averaging around 3.3% annually
  • From recession to recovery, Nigeria’s GDP growth journey reveals three decades of economic volatility and slow transformation.
  • Nigeria's economy grew by 14.6% in 2002, which is still the highest in the country's history.
  • The country entered a recession in 2016, with the economy shrinking by -1.6%.
  • Nigeria enjoyed a long period of strong growth between 2003 and 2010: The economy grew between 7% and 11%, powered by high oil prices and booming sectors like telecoms and banking.

Debt service costs in South Africa surpassed health spending in 2020/21 and reached R426.3B in 2025
  • Debt service costs in South Africa overtook government health spending in 2020/21.
  • In South Africa's 2025 budget, debt service costs stand at R426.3B, compared to R296.1B for health.
  • Debt service costs grew at 11.3% CAGR (2017–2025), more than double the 5.0% CAGR of government health expenditure.
  • The gap between debt and health spending widened sharply after 2020/21, with debt consistently pulling ahead.

South Africa’s share of Africa’s GDP has averaged 20% since 1960, peaking in early 1990s
  • South Africa’s share of Africa’s GDP has averaged around 20% since 1960.
  • The country’s relative dominance peaked in the early 1990s at nearly 28% of continental GDP.
  • Nominal GDP grew steadily from $8.7 billion in 1960 to over $400 billion in 2024.
  • South Africa’s share of Africa’s GDP has generally declined in recent decades as other African economies expanded faster.
  • Despite the relative decline, South Africa remains one of Africa’s largest and most influential economies.

Nigeria’s slice of Africa’s economy since independence: From a peak of 31% to 7% in 2024
  • At independence in 1960, Nigeria contributed about 10% of Africa’s GDP, establishing itself early as one of the continent’s largest economies.
  • Nigeria’s share peaked at 31% in 1981 during the oil boom, highlighting the dramatic impact of natural resources on the economy.
  • Between the mid-1980s and 2000s, Nigeria’s share fluctuated significantly, dropping to 9.2% in 1999 due to political instability, economic mismanagement, and external shocks.
  • By 2024, Nigeria’s share fell to 7.1%, despite a GDP of $187.8 billion, showing slower relative growth compared to other African economies and the ongoing need for economic diversification.
  • This share reflects Nigeria’s relative position in Africa’s economy over time, showing how it moved in relation to the growth of the rest of the continent.

From 2013 to 2024, the Services sector has consistently dominated Ghana’s GDP, while Agriculture has remained the smallest sector
  • From 2013 to 2024, the services sector has consistently dominated Ghana’s GDP, while agriculture has remained the smallest sector.
  • A weak agriculture sector can make Ghana more dependent on food imports.
  • Agriculture’s stagnation reduces its role as a labour buffer.

POPULAR TOPICS
SIGN UP TO OUR NEWSLETTER
Get periodic updates about the African startup space, access to our reports, among others.
Subscribe Here
Subscription Form

A product of Techpoint Africa. All rights reserved