Eskom’s average electricity tariff in cents per kilowatt hour (c/kWh), 2013/14—2023/24

Key Takeaways

  • Eskom’s average electricity tariff increased by approximately 162% between 2013/14 and 2023/24.
  • Tariffs are categorized into two groups based on distribution: Local Authority Tariffs and Non-Local Authority Tariffs.
  • Landlight Tariff (Non-Local Authority category) is the highest rate and in 2023/24 it stood at 608.61 c/kWh.
  • Homelight 20A (Block 1) is the lowest tariff also in the non-local authority category, at 168.78 c/kWh in 2023/24.
  • Eskom applies Time-of-Use (ToU) pricing, where tariffs vary by Time of day (peak, standard, off-peak periods) and Demand season (high-demand season: June to August and Low-demand season: September to May)

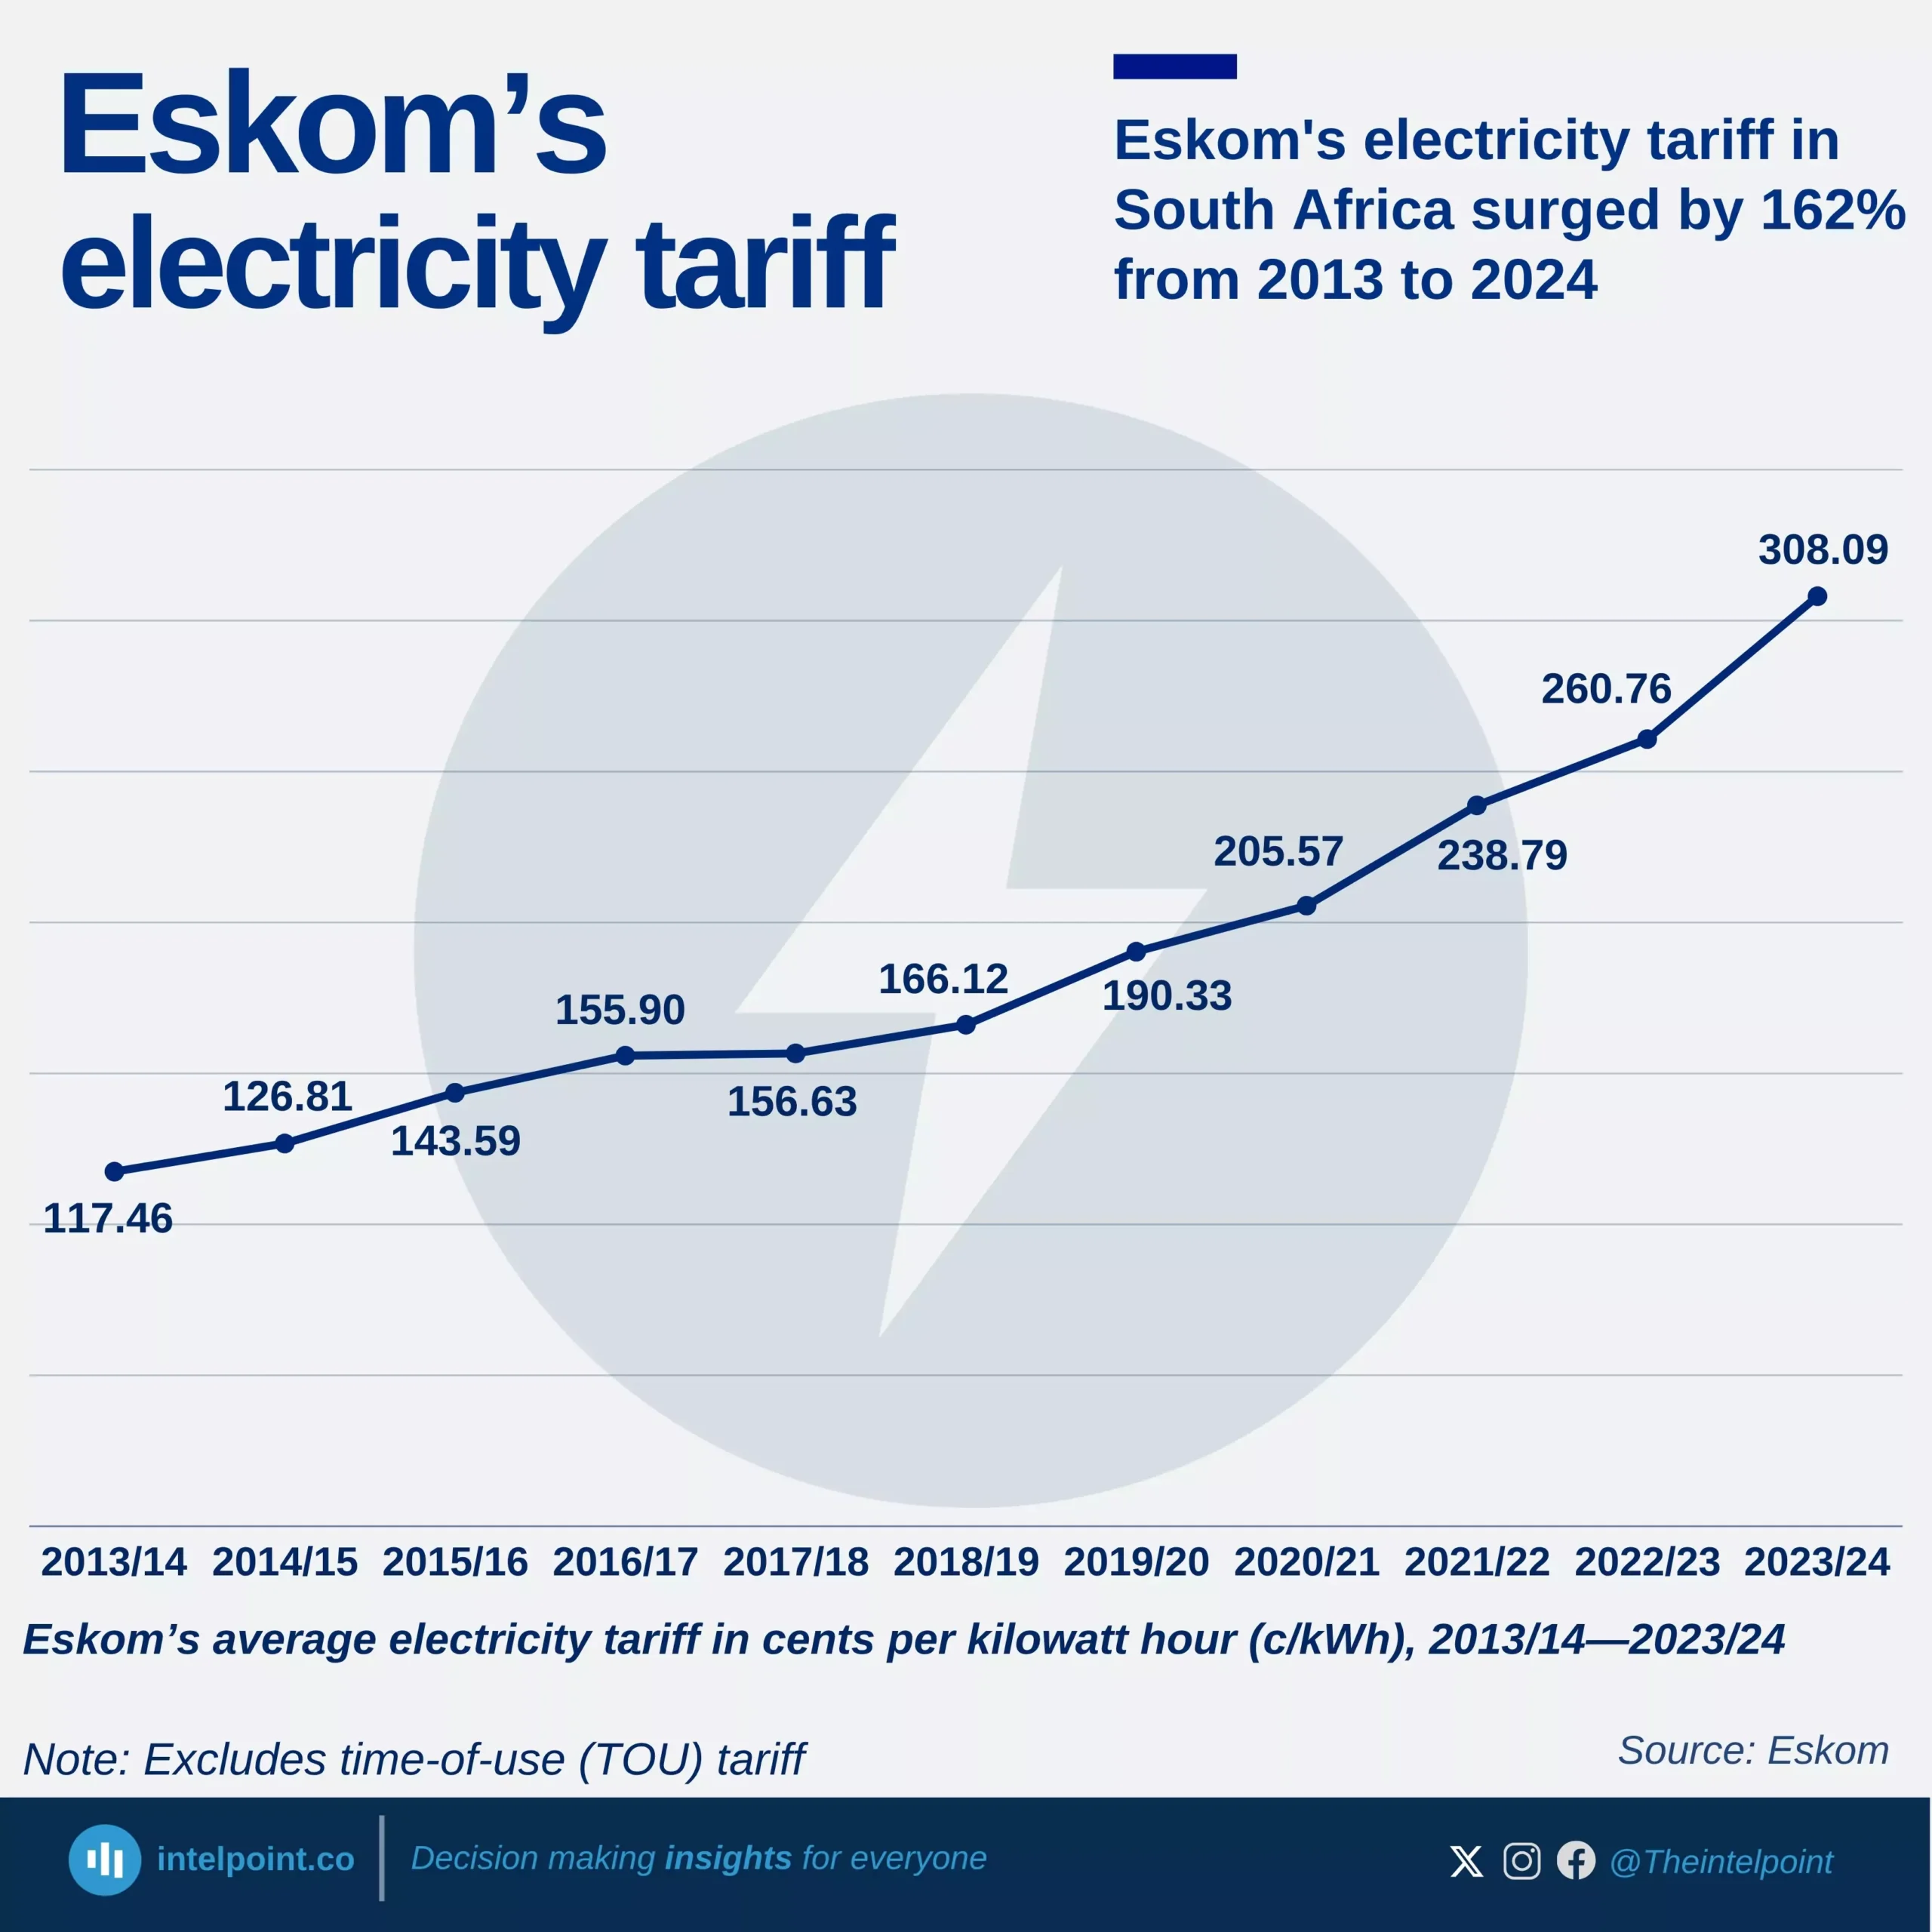
Between the 2013/14 and 2023/24, South Africans have witnessed a staggering 162% increase in electricity tariffs charged by Eskom, the country’s state-owned power utility. Despite this significant surge over the past decade, further increases are on the horizon, placing additional strain on households, businesses, and municipalities already grappling with rising energy costs.

In its latest publication, Eskom announced another round of tariff adjustments approved by the National Energy Regulator of South Africa (NERSA). Starting April 1, 2025, direct customers, those not supplied through municipalities (non-local authority), will face an effective tariff increase of 12.74%. For municipalities purchasing electricity in bulk, the adjustment will take effect on July 1, 2025, with a tariff hike of 11.32%.

These increases are part of a broader cost-recovery framework that Eskom has consistently defended. The utility argues that the continuous tariff hikes are necessary to address its significant financial challenges, which include a mounting debt burden, rising operational costs, infrastructure maintenance and expansion needs, as well as fuel expenses. Additionally, Eskom aims to recoup revenue losses from years of under-recovery, where tariffs were not sufficient to cover the true cost of electricity production and distribution.

Source:

Eskom

Period:

HTML code to embed chart
Want a bespoke report?
Reach out
Tags
Related Insights

The national grid collapses an average of 7 times annually under Tinubu, down from 13 times under Buhari
  • The highest number of grid collapses in the past 16 years occurred in 2010, with 42 incidents recorded.
  • During Goodluck Jonathan’s administration, Nigeria’s grid collapsed an average of 24.4 times a year, the highest among the three administrations.
  • Under Muhammadu Buhari, the annual average dropped to 12.8 collapses per year, indicating improved grid stability compared to earlier years.
  • Under Bola Ahmed Tinubu, the average has fallen further to about 6.7 collapses annually.
  • 2016 recorded the highest number of collapses during the Buhari administration, with 28 incidents.
  • The most stable years in the dataset were 2020 and 2021, with only four collapses each.

Nigeria’s power grid is 69.9% powered by thermal plants
  • Thermal energy dominates Nigeria’s grid, supplying 69.9% of total power.
  • Hydro plants contribute 30.1%, making them the country’s second major source.
  • The heavy reliance on thermal generation shows Nigeria’s grid is still largely fossil-fuel driven.
  • Hydro remains a crucial but secondary source, supporting overall supply stability.

Nigeria's DisCos recorded ₦360bn revenue gap after collecting ₦1.12tn from ₦1.49tn billed in H1 2025
  • DisCos billed approximately ₦1.49 trillion but collected only ₦1.12 trillion in H1 2025.
  • Ikeja and Eko DisCos generated the highest revenues, collecting ₦206.22 billion and ₦210.59 billion, respectively.
  • Revenue collection gaps remain significant, with Jos, Kaduna, and Yola posting the weakest collection performances.
  • The wide gap between billings and actual collections suggests persistent challenges in customer payment compliance, metering, and distribution efficiency.

Nigeria has installed 3.65 million electricity metres since 2019; Ikeja DisCo leads with 823,000, and Aba Power at the bottom with 56,000
  • Approximately 3.65 million metres have been installed nationwide across all frameworks since 2019.
  • Ikeja DisCo leads by a wide margin with 823,000 installations, over twice the volume of most other DisCos.
  • Kaduna, Yola, and Aba Power recorded the lowest metre installations, each below 100,000.
  • The disparities in installation totals reveal uneven progress in achieving nationwide metering coverage.

More than 8 in 10 electricity customers of Ikeja and Eko DisCos are now metered
  • Ikeja (84.6%) and Eko (83.3%) lead Nigeria’s metering performance, keeping unmetered customers below 17%.
  • Eight out of the twelve DisCos have metering rates below 60%, showing a wide sector imbalance.
  • The worst-performing DisCos — Yola, Jos, Kaduna, and Kano — have over 65% unmetered customers.
  • Regional disparities are sharp: Lagos and Abuja outperform northern and south-eastern DisCos by large margins.

Nigeria’s urban electrification has stalled below 90% for over three decades
  • Urban electricity access has remained between 80% and 89% since 1990, never crossing to 90%.
  • The inability to achieve universal access suggests that infrastructure expansion has struggled to keep pace with rapid urbanisation and population growth.
  • Periodic dips in access, such as in 2010 and 2015, point to challenges in maintaining consistent electricity supply rather than just extending connections.
  • Insufficient generation, outdated grids, and policy inefficiencies have constrained Nigeria’s ability to deliver reliable and universal electricity access even in its urban centres.

POPULAR TOPICS
SIGN UP TO OUR NEWSLETTER
Get periodic updates about the African startup space, access to our reports, among others.
Subscribe Here
Subscription Form

A product of Techpoint Africa. All rights reserved