China topped Nigeria’s import sources with ₦4.66 trillion, while India led the export destinations with ₦2.84 trillion in Q1 2025

  • India is Nigeria’s largest export destination Nigeria exported ₦2.84 trillion worth of goods to India in Q1 2025, driven largely by crude oil.
  • China dominates imports into Nigeria China supplied ₦4.66 trillion worth of goods, far outpacing all other countries. Likely dominated by electronics, machinery, and manufactured goods.
  • The United States appears on both sides. Nigeria exports ₦1.54 trillion to the US and imports ₦1.42 trillion, showing a relatively balanced trade relationship.
  • European countries are major export Partners Netherlands (₦2.30T), France (₦1.44T), and Spain (₦1.44T) are prominent export destinations, indicating strong demand for Nigerian crude oil and other commodities in Europe.
  • UAE barely makes the import list. The UAE closes out the top import list at ₦0.61 trillion, showing relatively lower trade volume compared to others, but still significant enough to be in the top 5.

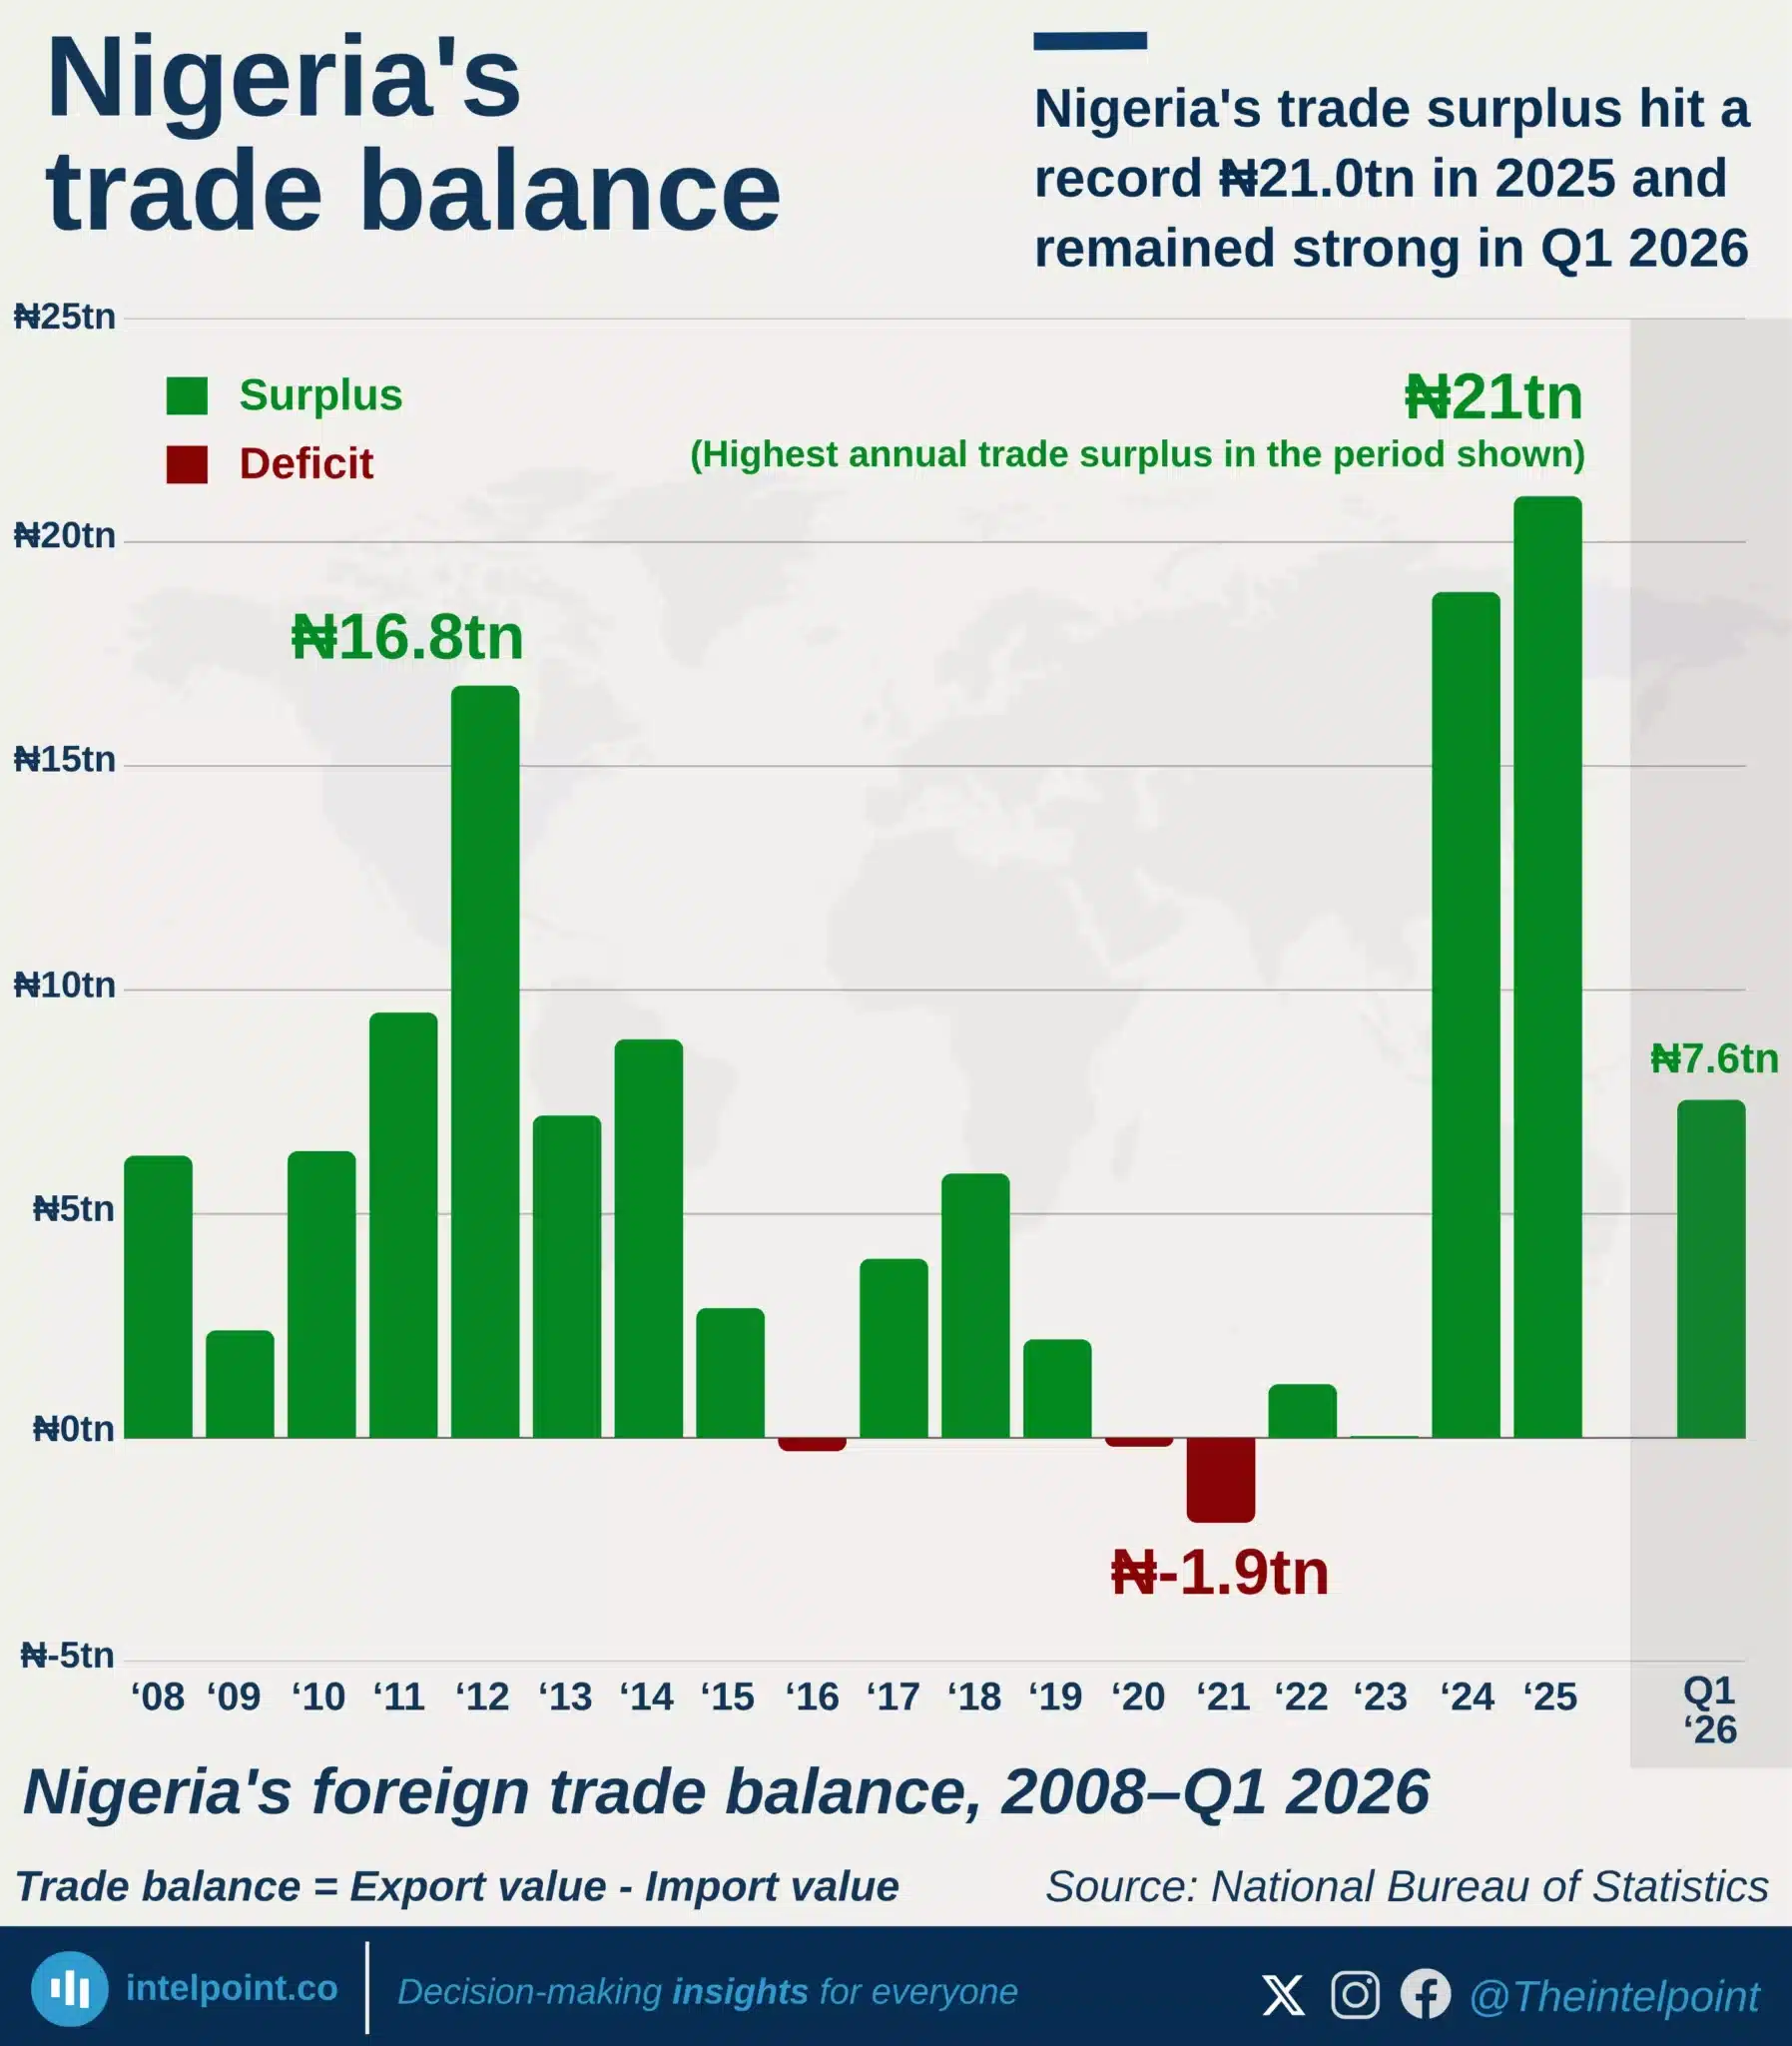
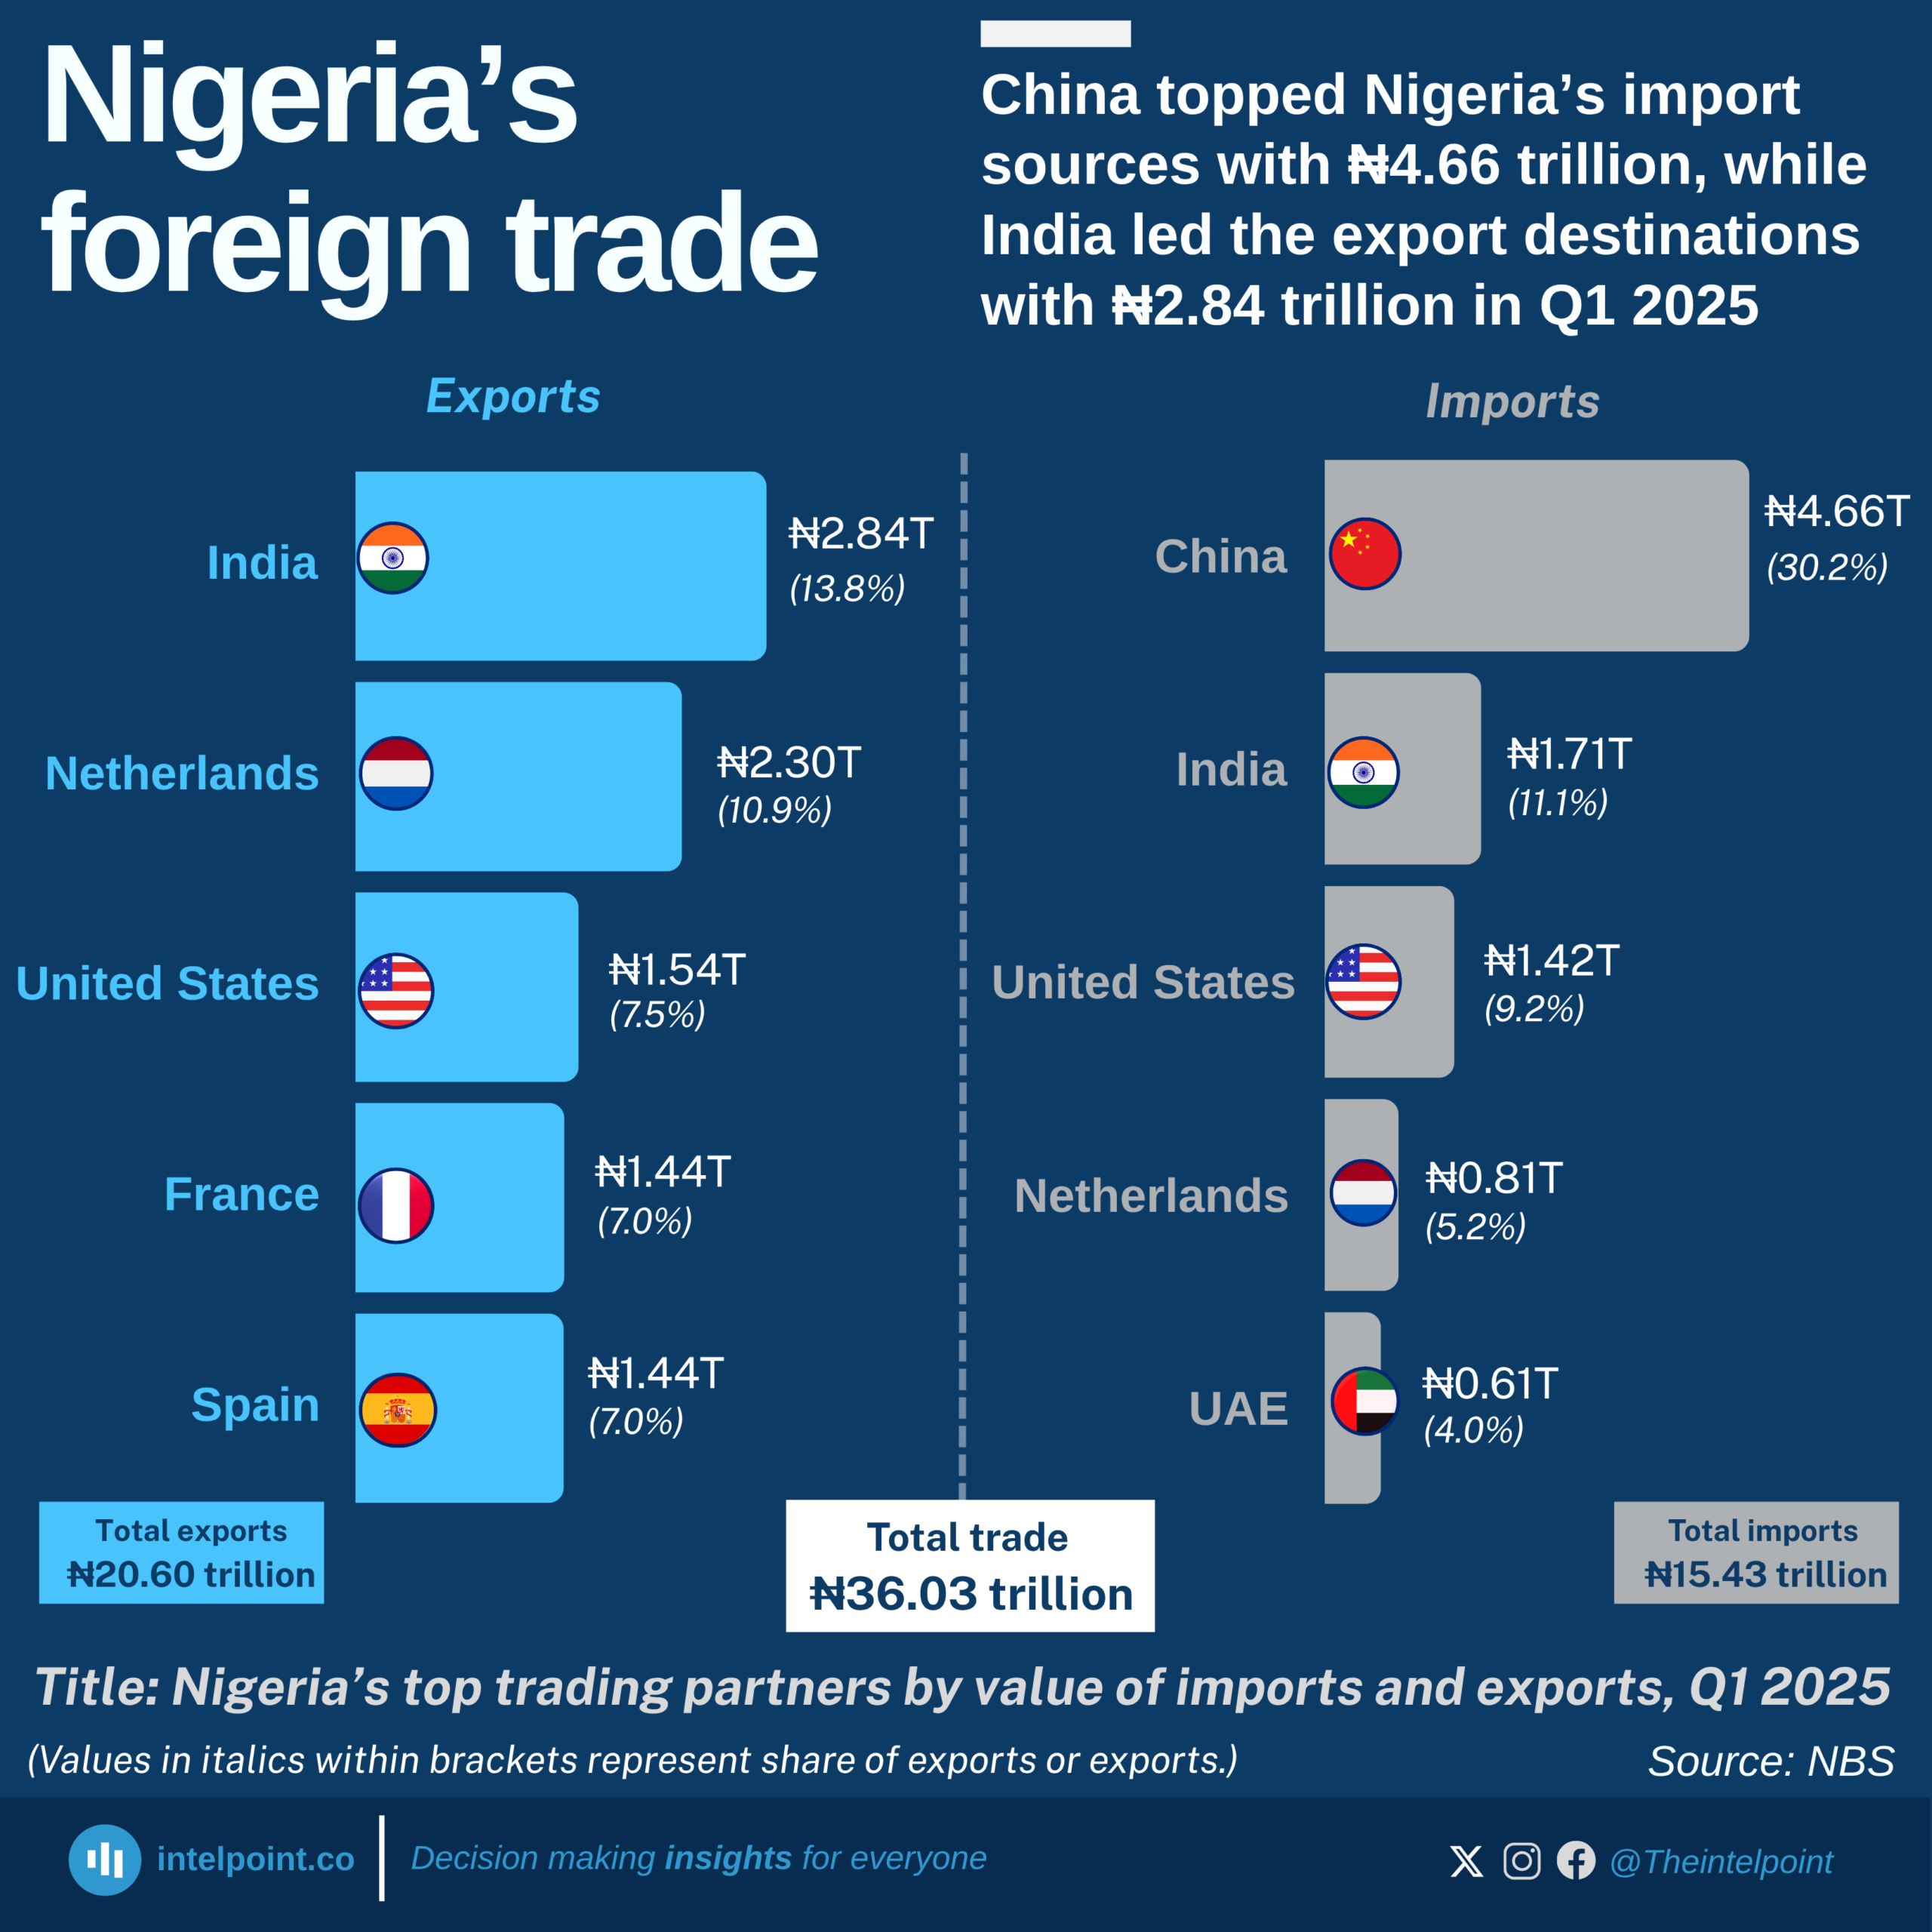
In the first quarter of 2025, Nigeria's total trade value reached a significant milestone of ₦36.03 trillion, reflecting the country’s continued engagement in global commerce. This figure comprises ₦20.60 trillion in exports and ₦15.43 trillion in imports, showcasing a trade surplus of ₦5.17 trillion, a positive indicator of stronger outbound trade compared to inbound. Nigeria's international trade dynamics reflect a strong reliance on commodity exports and imported manufactured goods. The country’s export activity was most heavily concentrated with India, receiving ₦2.84 trillion in goods, mostly attributed to crude oil exports, which continue to underpin Nigeria's trade economy. Following India are the Netherlands, the United States, France, and Spain, which reflect Nigeria’s enduring trade relationships with Western economies, especially in energy.

On the import side, China's dominance is notable, with ₦4.66 trillion in imports flowing into Nigeria. This is nearly three times the volume imported from India (₦1.71T), the second-largest source. China’s position illustrates its role as Nigeria’s primary supplier of machinery, electronics, and industrial goods. Other key import sources include the United States, Netherlands, and UAE, all of which maintain significant commercial ties.

Interestingly, the United States appears on both the top export and import lists, indicating a well-rounded trade engagement, rather than being skewed toward either inflow or outflow. This bilateral balance could be beneficial for both economies and may reflect growing diversification in traded products beyond oil.

While European countries dominate Nigeria’s export destinations, only the Netherlands appears among the top import sources. This might signal that Europe values Nigeria more as a supplier than as a buyer, maintaining a trade surplus.

Source:

NBS

Period:

Q1 2025
HTML code to embed chart
Want a bespoke report?
Reach out
Tags
Related Insights

Nigeria’s public debt has soared since 2010, with domestic debt up 2,020% and external debt up 1,000% by mid 2025
  • Nigeria’s domestic debt jumped from ₦3.8 trillion in 2010 to ₦80.55 trillion by mid-2025.
  • Foreign debts increased from $4.27 billion in 2010 to $46.98 billion in 2025, reflecting growing reliance on external financing.
  • Debt accumulation surged notably after 2020, coinciding with pandemic spending, naira depreciation, and higher fiscal deficits.
  • The widening gap between revenue and debt service raises questions about Nigeria’s long-term debt sustainability.

Nigeria's energy goods imports have stayed low and stable for 7 years, while exports increased from ₦37B to ₦263B
  • Nigeria’s energy goods exports rose from ₦37.3B in 2017 to ₦262.9B in 2024, before falling to ₦154.2B in H1 2025.
  • Imports remained consistently low, ranging from ₦24.2M to ₦353.1M throughout the period.
  • Export growth outpaced imports, showing a widening trade surplus in energy goods.
  • The 2024 spike in exports represents the highest export value within the nine-year window.
  • Energy imports stayed below ₦400M yearly, indicating low dependency on foreign energy goods.

For most of the period (2013-H1 2025), China's share of Nigeria's imports from Asia hovers around 50%-55%, showing dominance
  • China has dominated Nigeria’s imports from Asia, maintaining a 50–55% share for most of the period.
  • China’s share reached its highest level at 58.6% in H1 2025.
  • India's import share remained volatile, ranging between 11% and 25%.
  • Total imports from Asia surged from ₦2.6 trillion in 2013 to ₦16.4 trillion in H1 2025.

Nigeria's agricultural imports' share has been dropping, from 83.9% (2017) to a low of 42.9% (H1 2025)
  • Agricultural imports fell from 83.9% in 2017 to 42.9% in H1 2025, indicating a significant decline in import dependency.
  • Agricultural exports grew from 16.1% in 2017 to 54.0% in 2024, surpassing imports for the first time since 2017.
  • Total agricultural trade increased from ₦1.1 trillion in 2017 to ₦8.2 trillion in 2024.
  • Between 2022 and 2024, the import share dropped significantly from 75.7% to 46.0%.

Crude oil imports in Nigeria emerged in H1 2025 (the first since 2017), capturing a 10.2% share of the total crude oil trade
  • Crude oil imports into Nigeria in H1 2025 marked the first occurrence since 2017.
  • Crude oil imports accounted for 10.2% of total crude oil trade.
  • From 2017 to 2024, exports made up 100% of crude oil trade annually.
  • Total crude oil trade peaked at ₦55.3 trillion in 2024.
  • The emergence of crude oil imports can be linked to domestic refinery operations, especially the Dangote Refinery.

Asia and Europe (combined) have consistently represented over 70% of Nigeria's total imports since 2013
  • Asia and Europe have consistently represented over 70% of Nigeria’s imports since 2013.
  • Asia’s share of imports reached a record 53.5% in H1 2025.
  • Europe contributed 23.1% of total imports in H1 2025.
  • Imports from the American region averaged between 10%–14% over the period.
  • Africa’s import share remained below 10%, showing limited regional trade.

POPULAR TOPICS
SIGN UP TO OUR NEWSLETTER
Get periodic updates about the African startup space, access to our reports, among others.
Subscribe Here
Subscription Form

A product of Techpoint Africa. All rights reserved