Netherlands, US, and Germany dominated cocoa imports from 1961 to 2023

  • Netherlands imported the most cocoa beans — 25.48 million tonnes (1961–2023)
  • US (21.1M) and Germany (16.8M) followed in total volume
  • These three countries dominated the top 5 nearly every year
  • Malaysia, UK, France, and Belgium also ranked high over time
  • USSR stayed in the top 10 despite dissolving in 1991
  • Global cocoa imports grew from 1M tonnes in 1961 to nearly 4M in 2023

If you eat chocolate or anything made with cocoa-based fillings, there’s a good chance the raw beans passed through the Netherlands. Netherlands imported more cocoa beans than any other country in the world — 25.48 million tonnes across the 63-year span.

The US followed with 21.1 million tonnes, then Germany with 16.8 million. These three rarely dropped out of the top five in any given year. Malaysia climbed into the upper ranks starting in the 1980s, while the UK remained a steady buyer throughout. France, Belgium, and Italy also posted strong import volumes. The USSR, despite going inactive after 1991, still finished in the all-time top 10.

The numbers go beyond consumption. In the case of the Netherlands, it’s backed by one of the world’s largest cocoa grinding and processing industries. Facilities in Amsterdam and Zaandam have made the country a key hub for turning raw cocoa into butter, powder, and other ingredients used by global food brands, as documented by the International Cocoa Organization and other trade reports.

This long-term growth mirrors a global trend: total cocoa bean imports quadrupled between 1961 and 2023, rising from just over 1 million tonnes to nearly 4 million.

Source:

Food and Agriculture organization of the UN

Period:

1961-2023
HTML code to embed chart
Want a bespoke report?
Reach out
Tags
Related Insights

From 45% to 2%: How Nigeria lost its global palm oil production share to Asia
  • Indonesia dominated with 46.8M tonnes in 2022, up from 145.7 ktonnes in 1961
  • Malaysia was the second-largest producer in 2022 with 18.5M tonnes
  • Global production has increased from under 2M tonnes (1961) to over 75M tonnes (2022)
  • Thailand, Colombia, and Guatemala have emerged as major producers in recent decades
  • Nigeria was historically significant, but has been overtaken by Asian producers

Over one-fourth of Asia’s forests were in legally established protected areas as of 2024
  • Asia leads globally with 26% of its forests in legally protected areas.
  • The global average stands at 20%, meaning that one-fifth of all forests are under some form of legal protection.
  • Africa and Europe are tied at 23%, both above the global average.
  • South America has only 17% of its forests protected, despite being home to the Amazon rainforest.

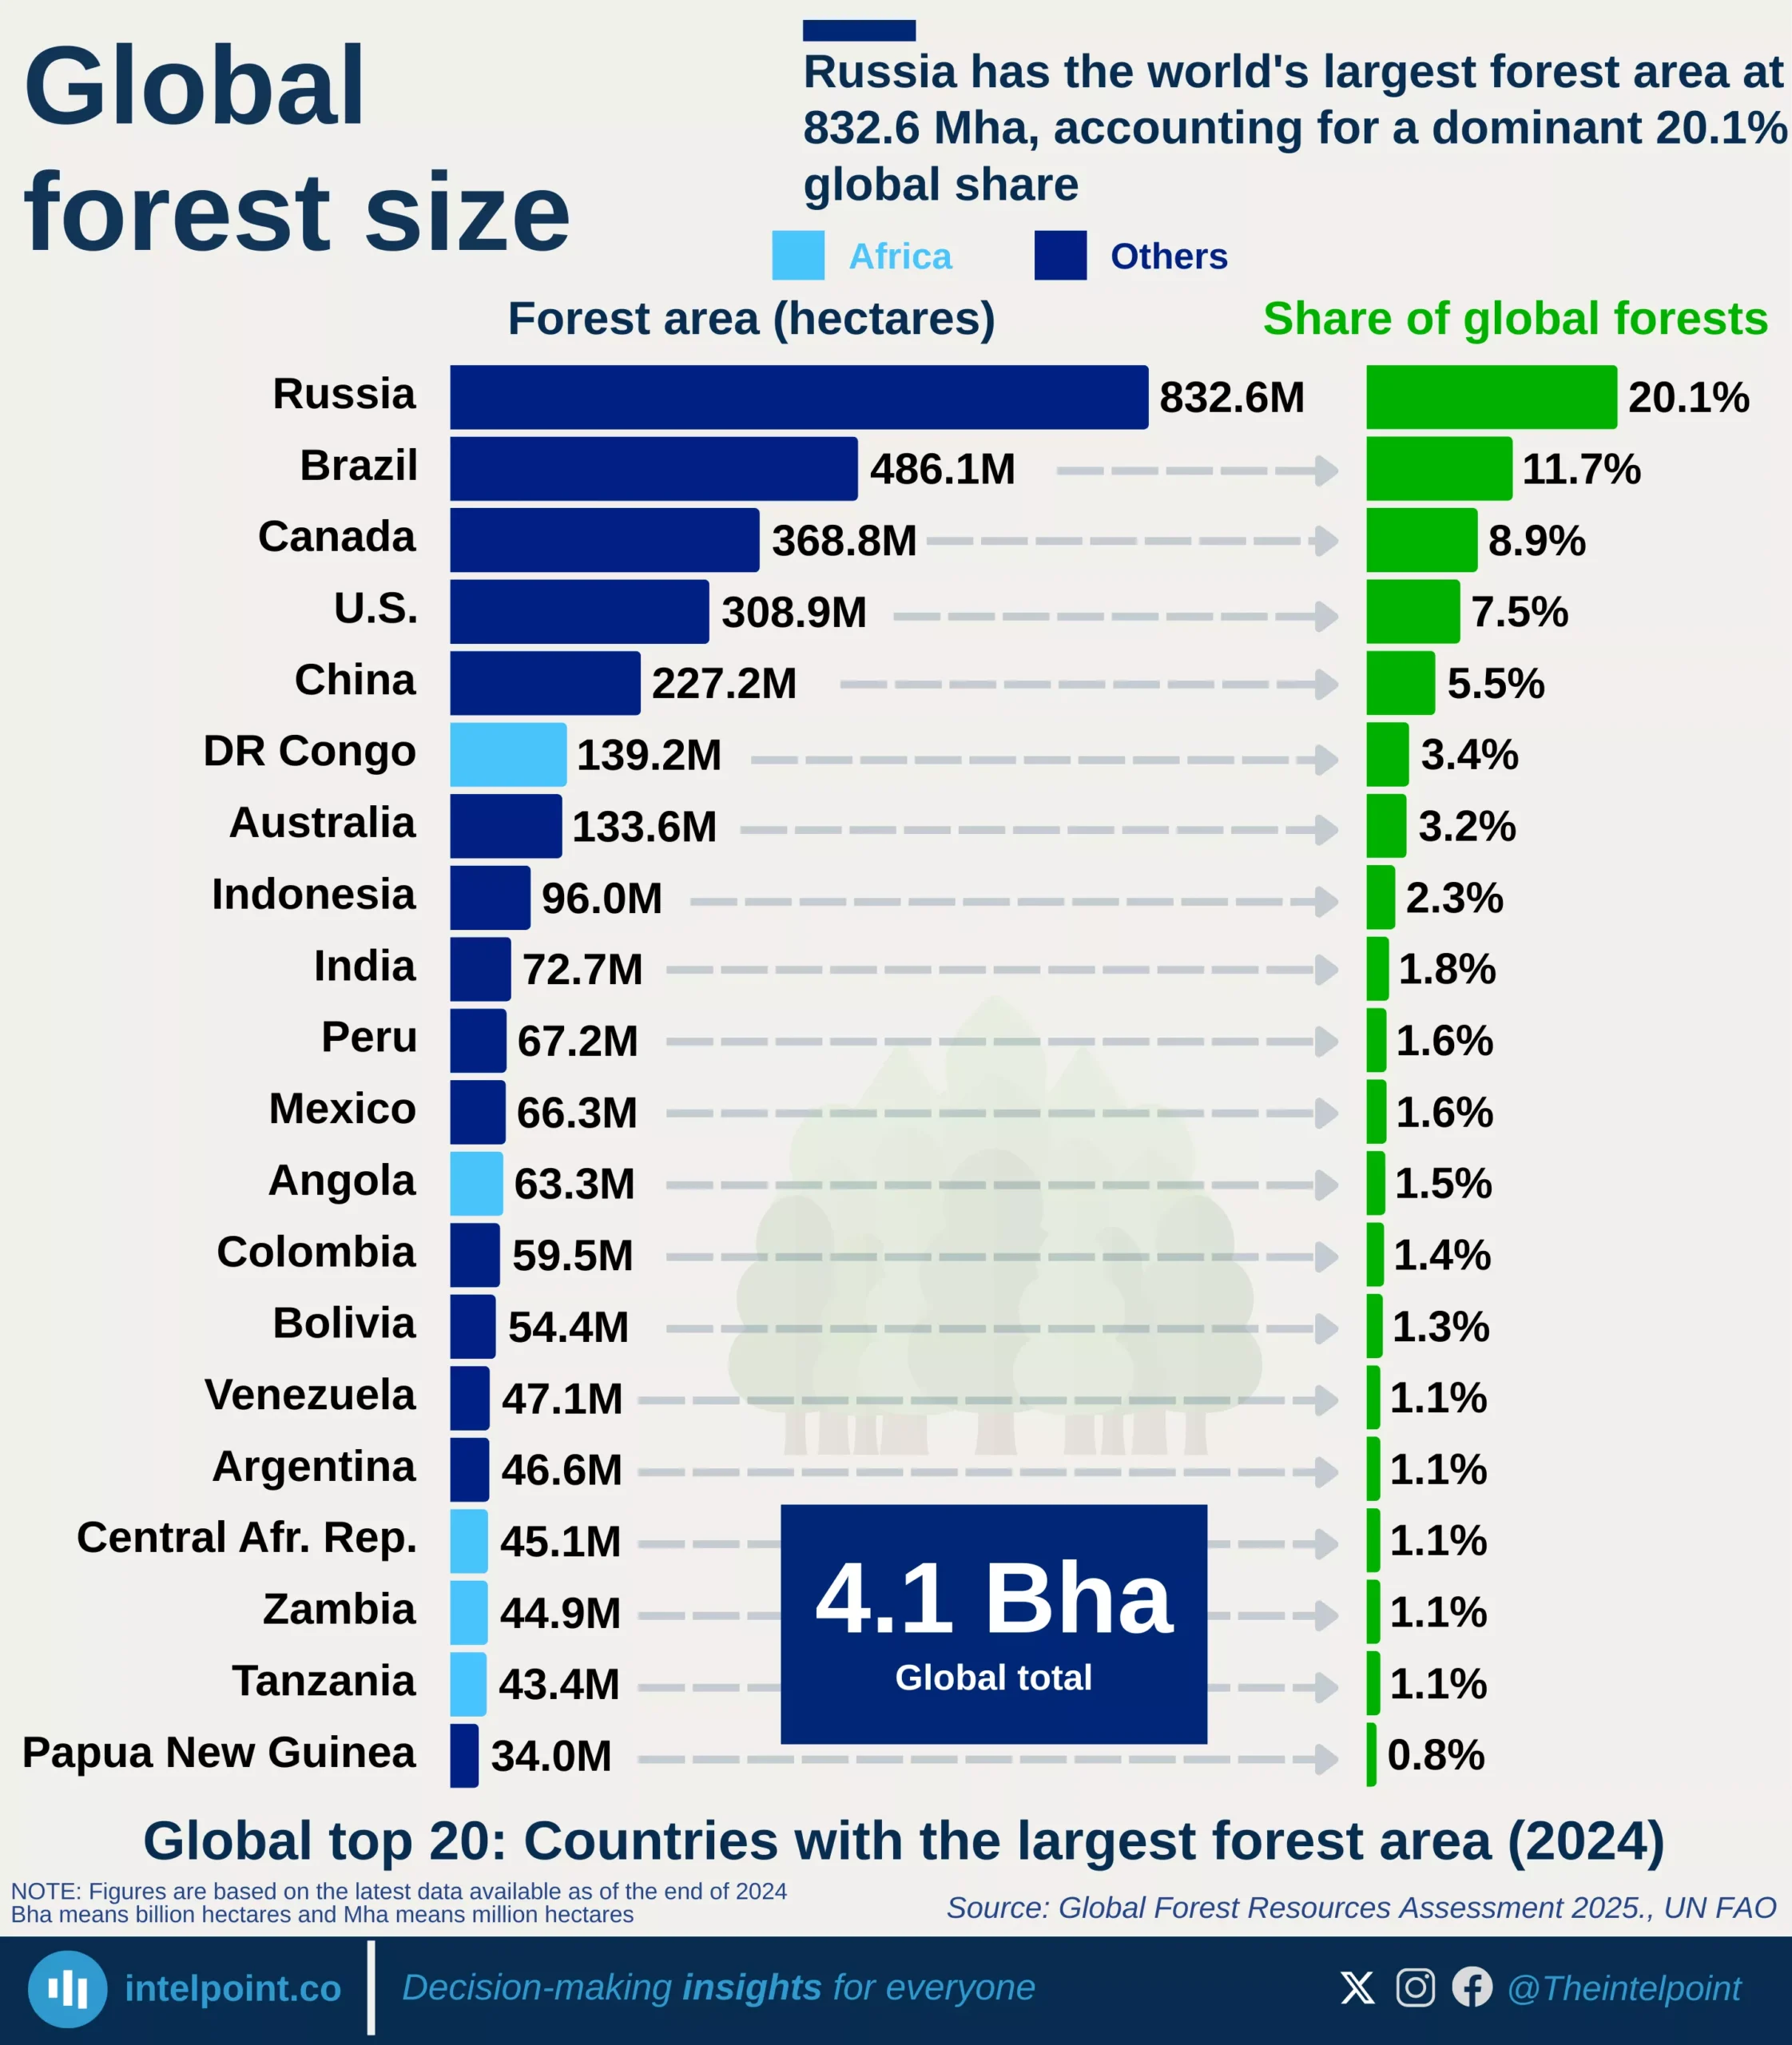
Russia has the world's largest forest area at 832.6 Mha, accounting for a dominant 20.1% global share
  • Global forest cover is 4.1 Bha, according to the latest FAO assessment.
  • At 832.6 Mha, 20.1% of the global total, Russia has the world’s largest forest area.
  • Brazil (486.1 Mha; 11.7%) and Canada (368.8 Mha; 8.9%) rank second and third, respectively.
  • The United States (7.5%) and China (5.5%) complete the global top five.
  • Africa’s top contributor is the Democratic Republic of Congo, with 139.2 Mha, 3.4% of the global total.
  • Other African countries in the top 20 include Angola, Zambia, Tanzania, and the Central African Republic, each accounting for approximately 1% of the global forest area.
  • Together, the top ten countries account for over 78% of the world’s total forest area, highlighting the global concentration of forest resources.

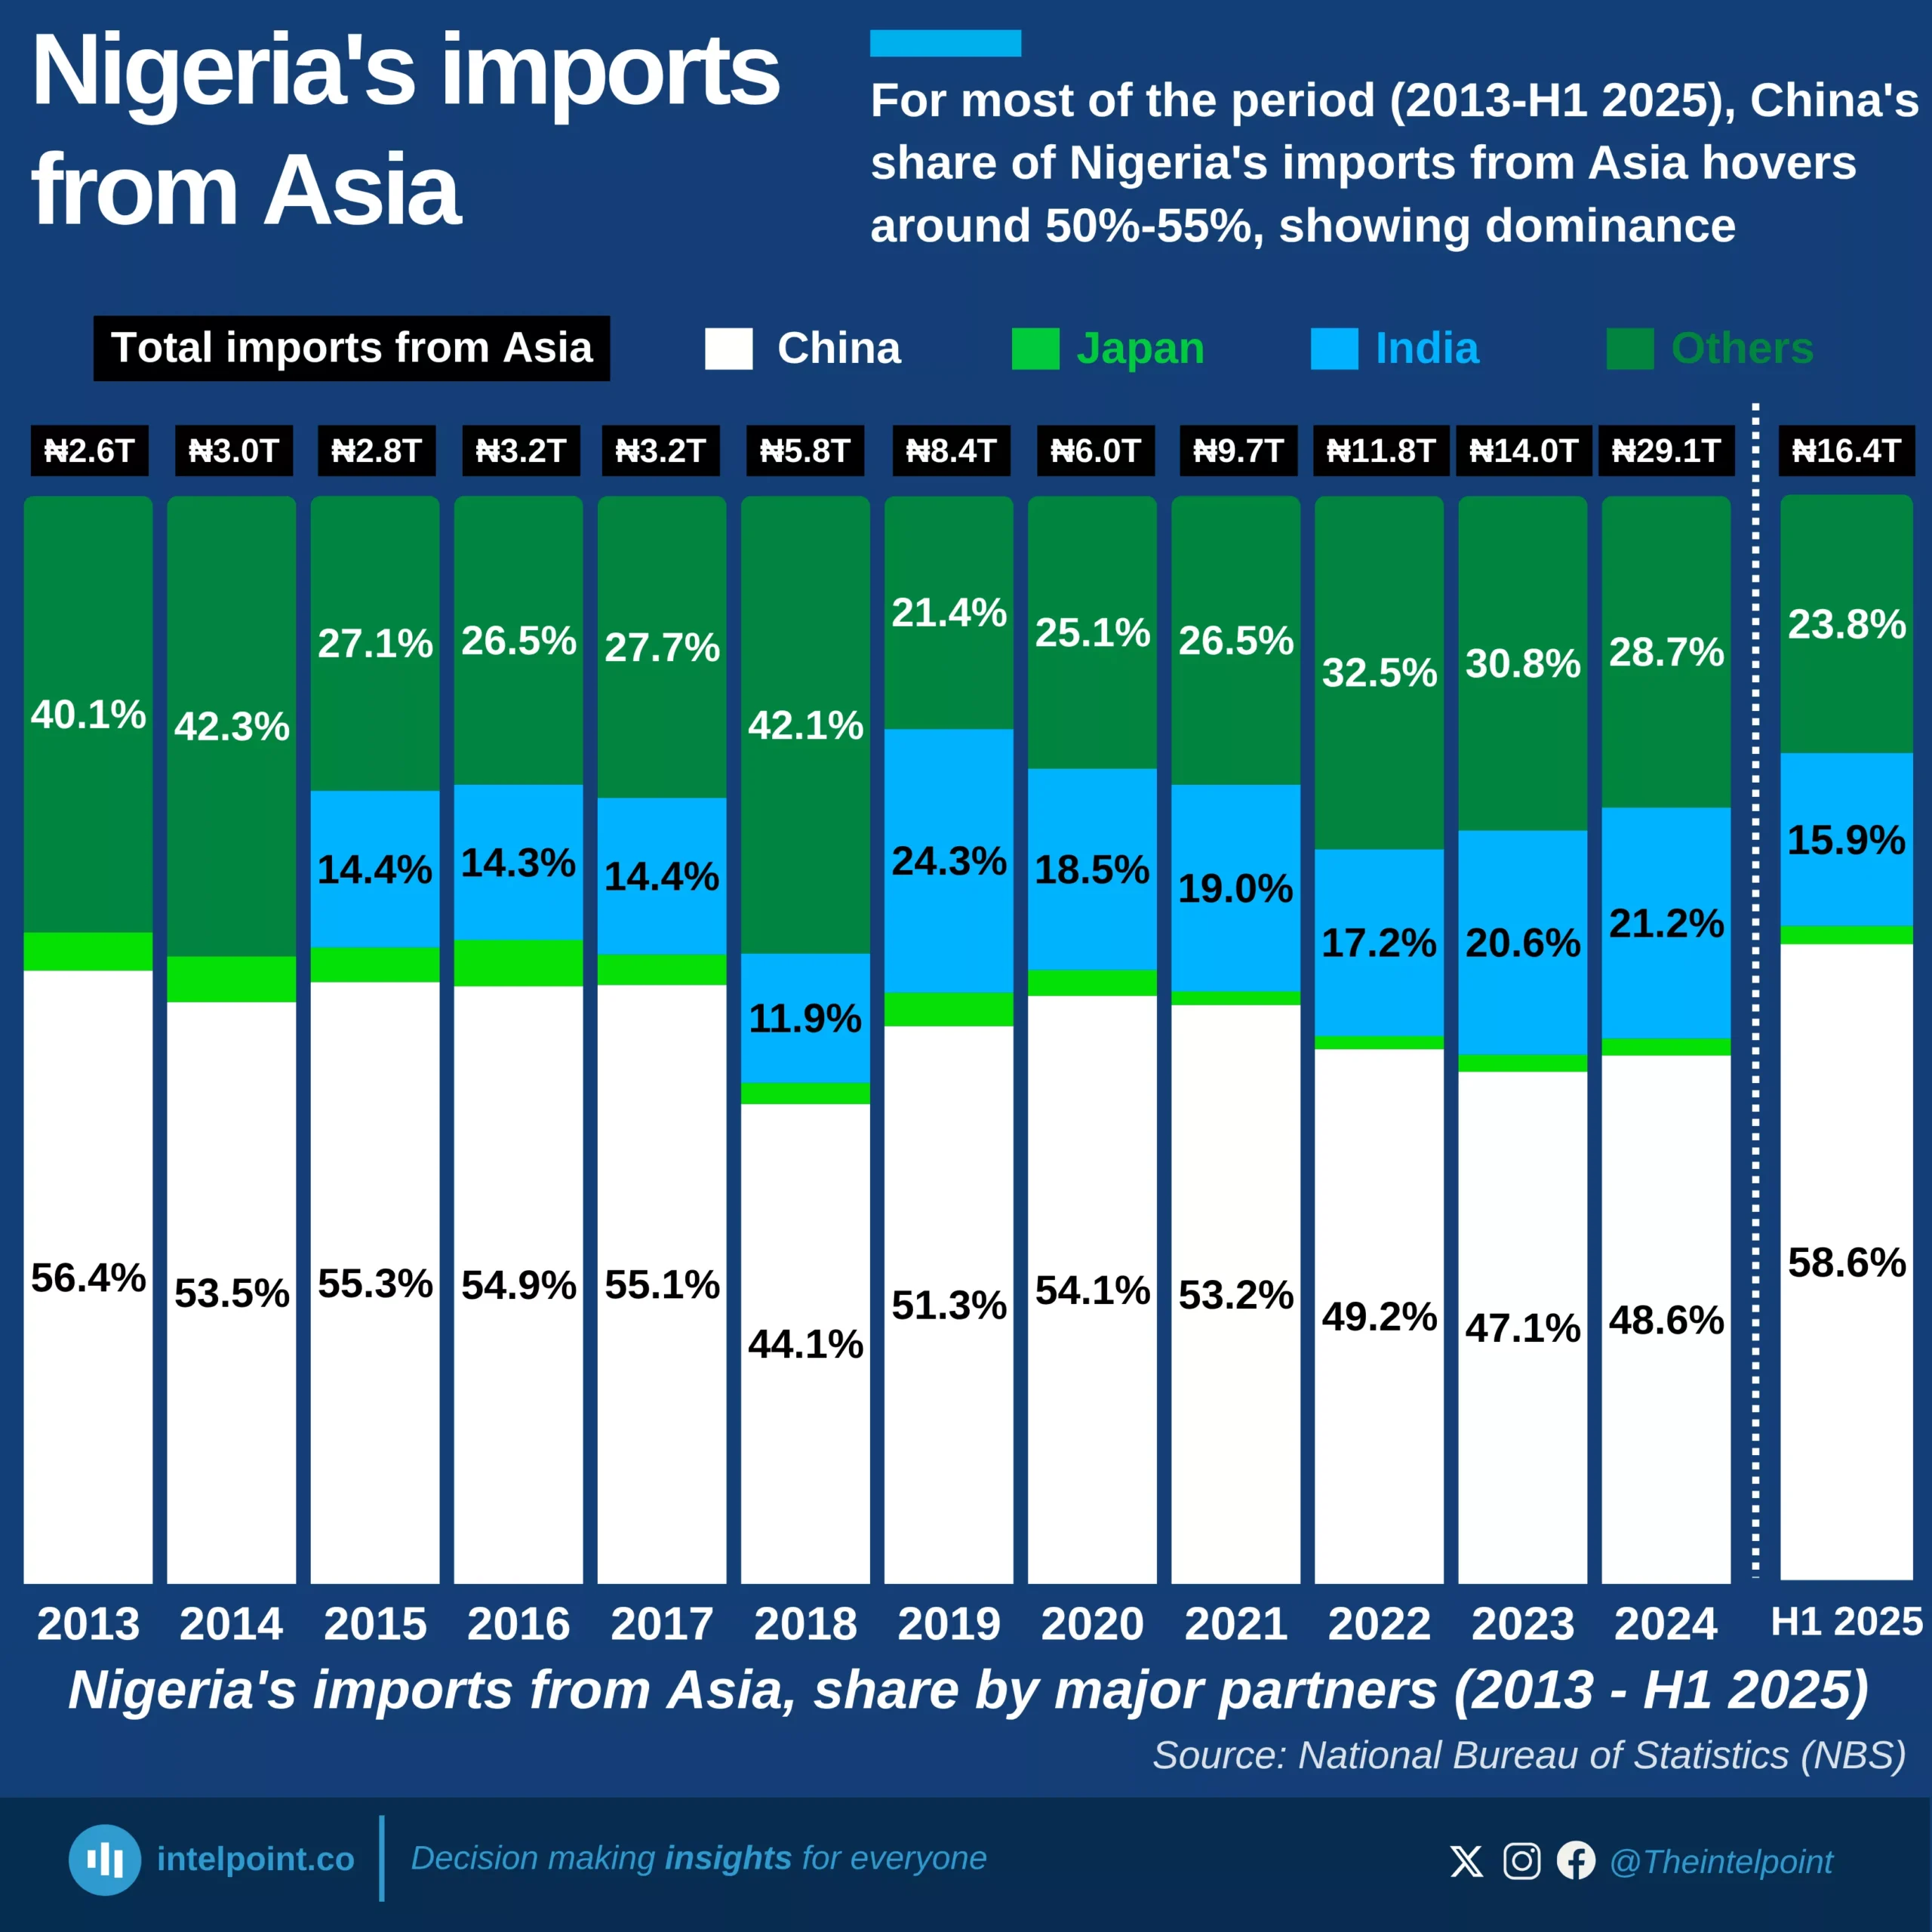
For most of the period (2013-H1 2025), China's share of Nigeria's imports from Asia hovers around 50%-55%, showing dominance
  • China has dominated Nigeria’s imports from Asia, maintaining a 50–55% share for most of the period.
  • China’s share reached its highest level at 58.6% in H1 2025.
  • India's import share remained volatile, ranging between 11% and 25%.
  • Total imports from Asia surged from ₦2.6 trillion in 2013 to ₦16.4 trillion in H1 2025.

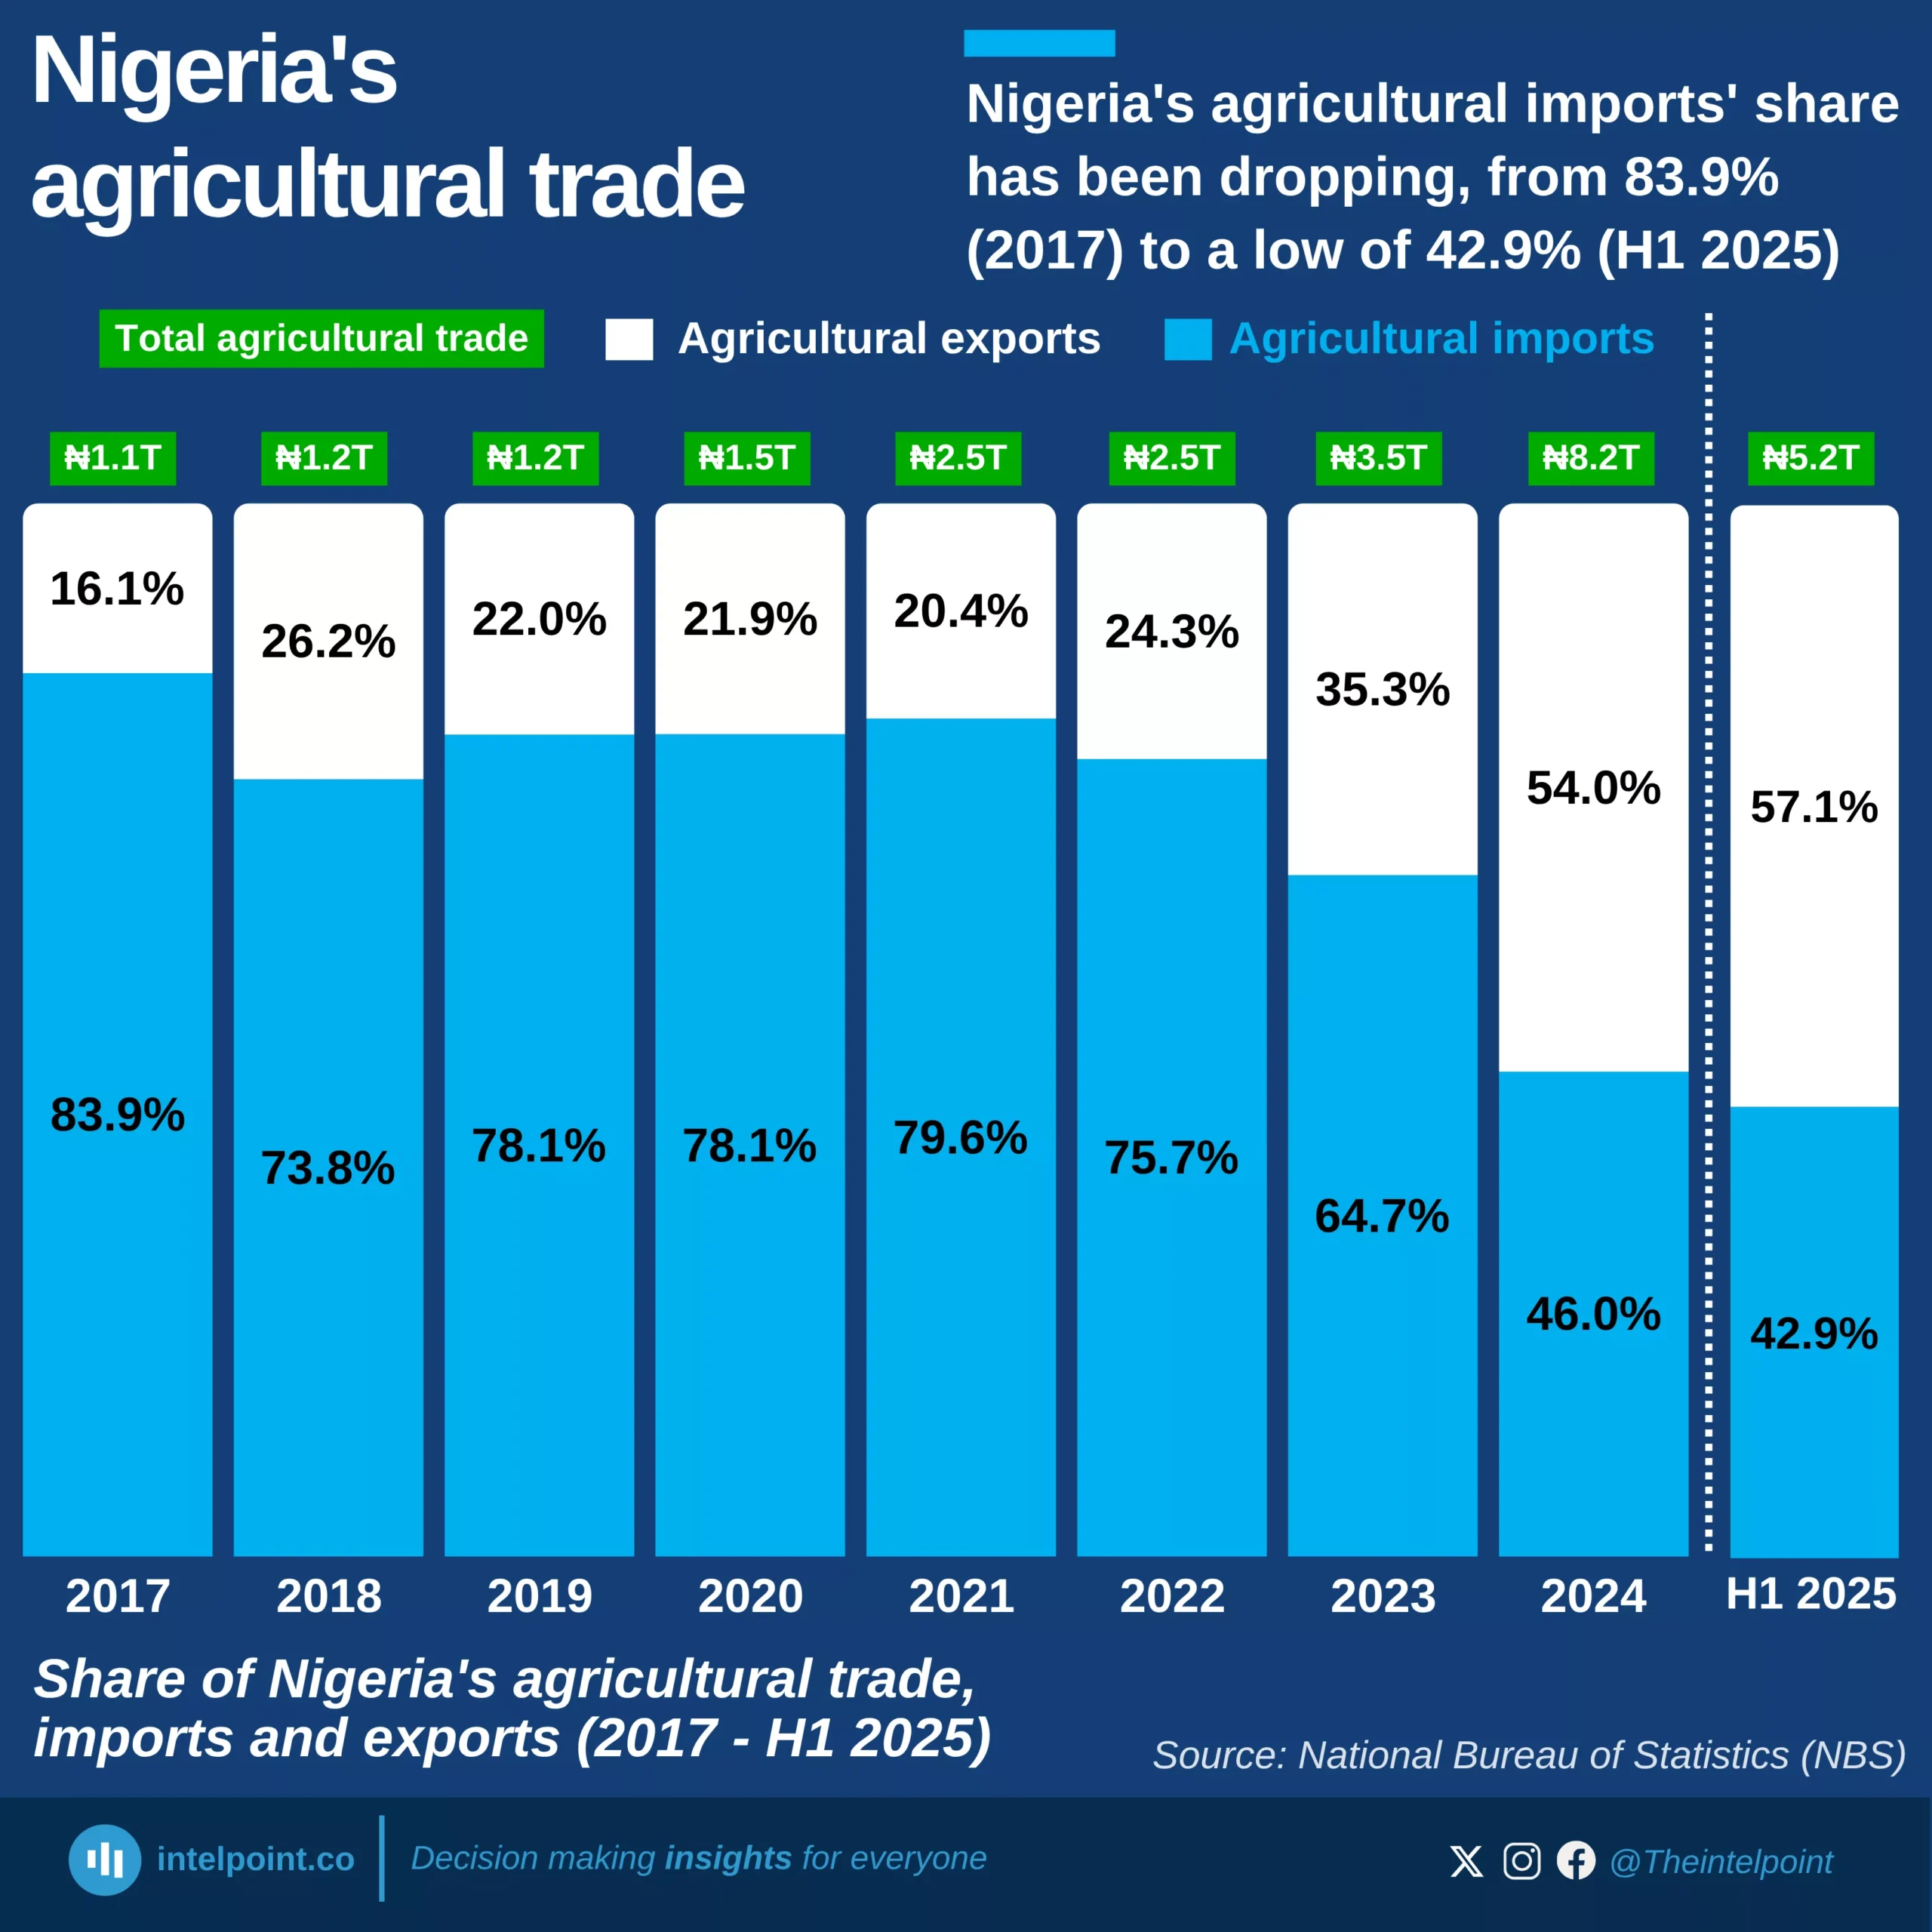
Nigeria's agricultural imports' share has been dropping, from 83.9% (2017) to a low of 42.9% (H1 2025)
  • Agricultural imports fell from 83.9% in 2017 to 42.9% in H1 2025, indicating a significant decline in import dependency.
  • Agricultural exports grew from 16.1% in 2017 to 54.0% in 2024, surpassing imports for the first time since 2017.
  • Total agricultural trade increased from ₦1.1 trillion in 2017 to ₦8.2 trillion in 2024.
  • Between 2022 and 2024, the import share dropped significantly from 75.7% to 46.0%.

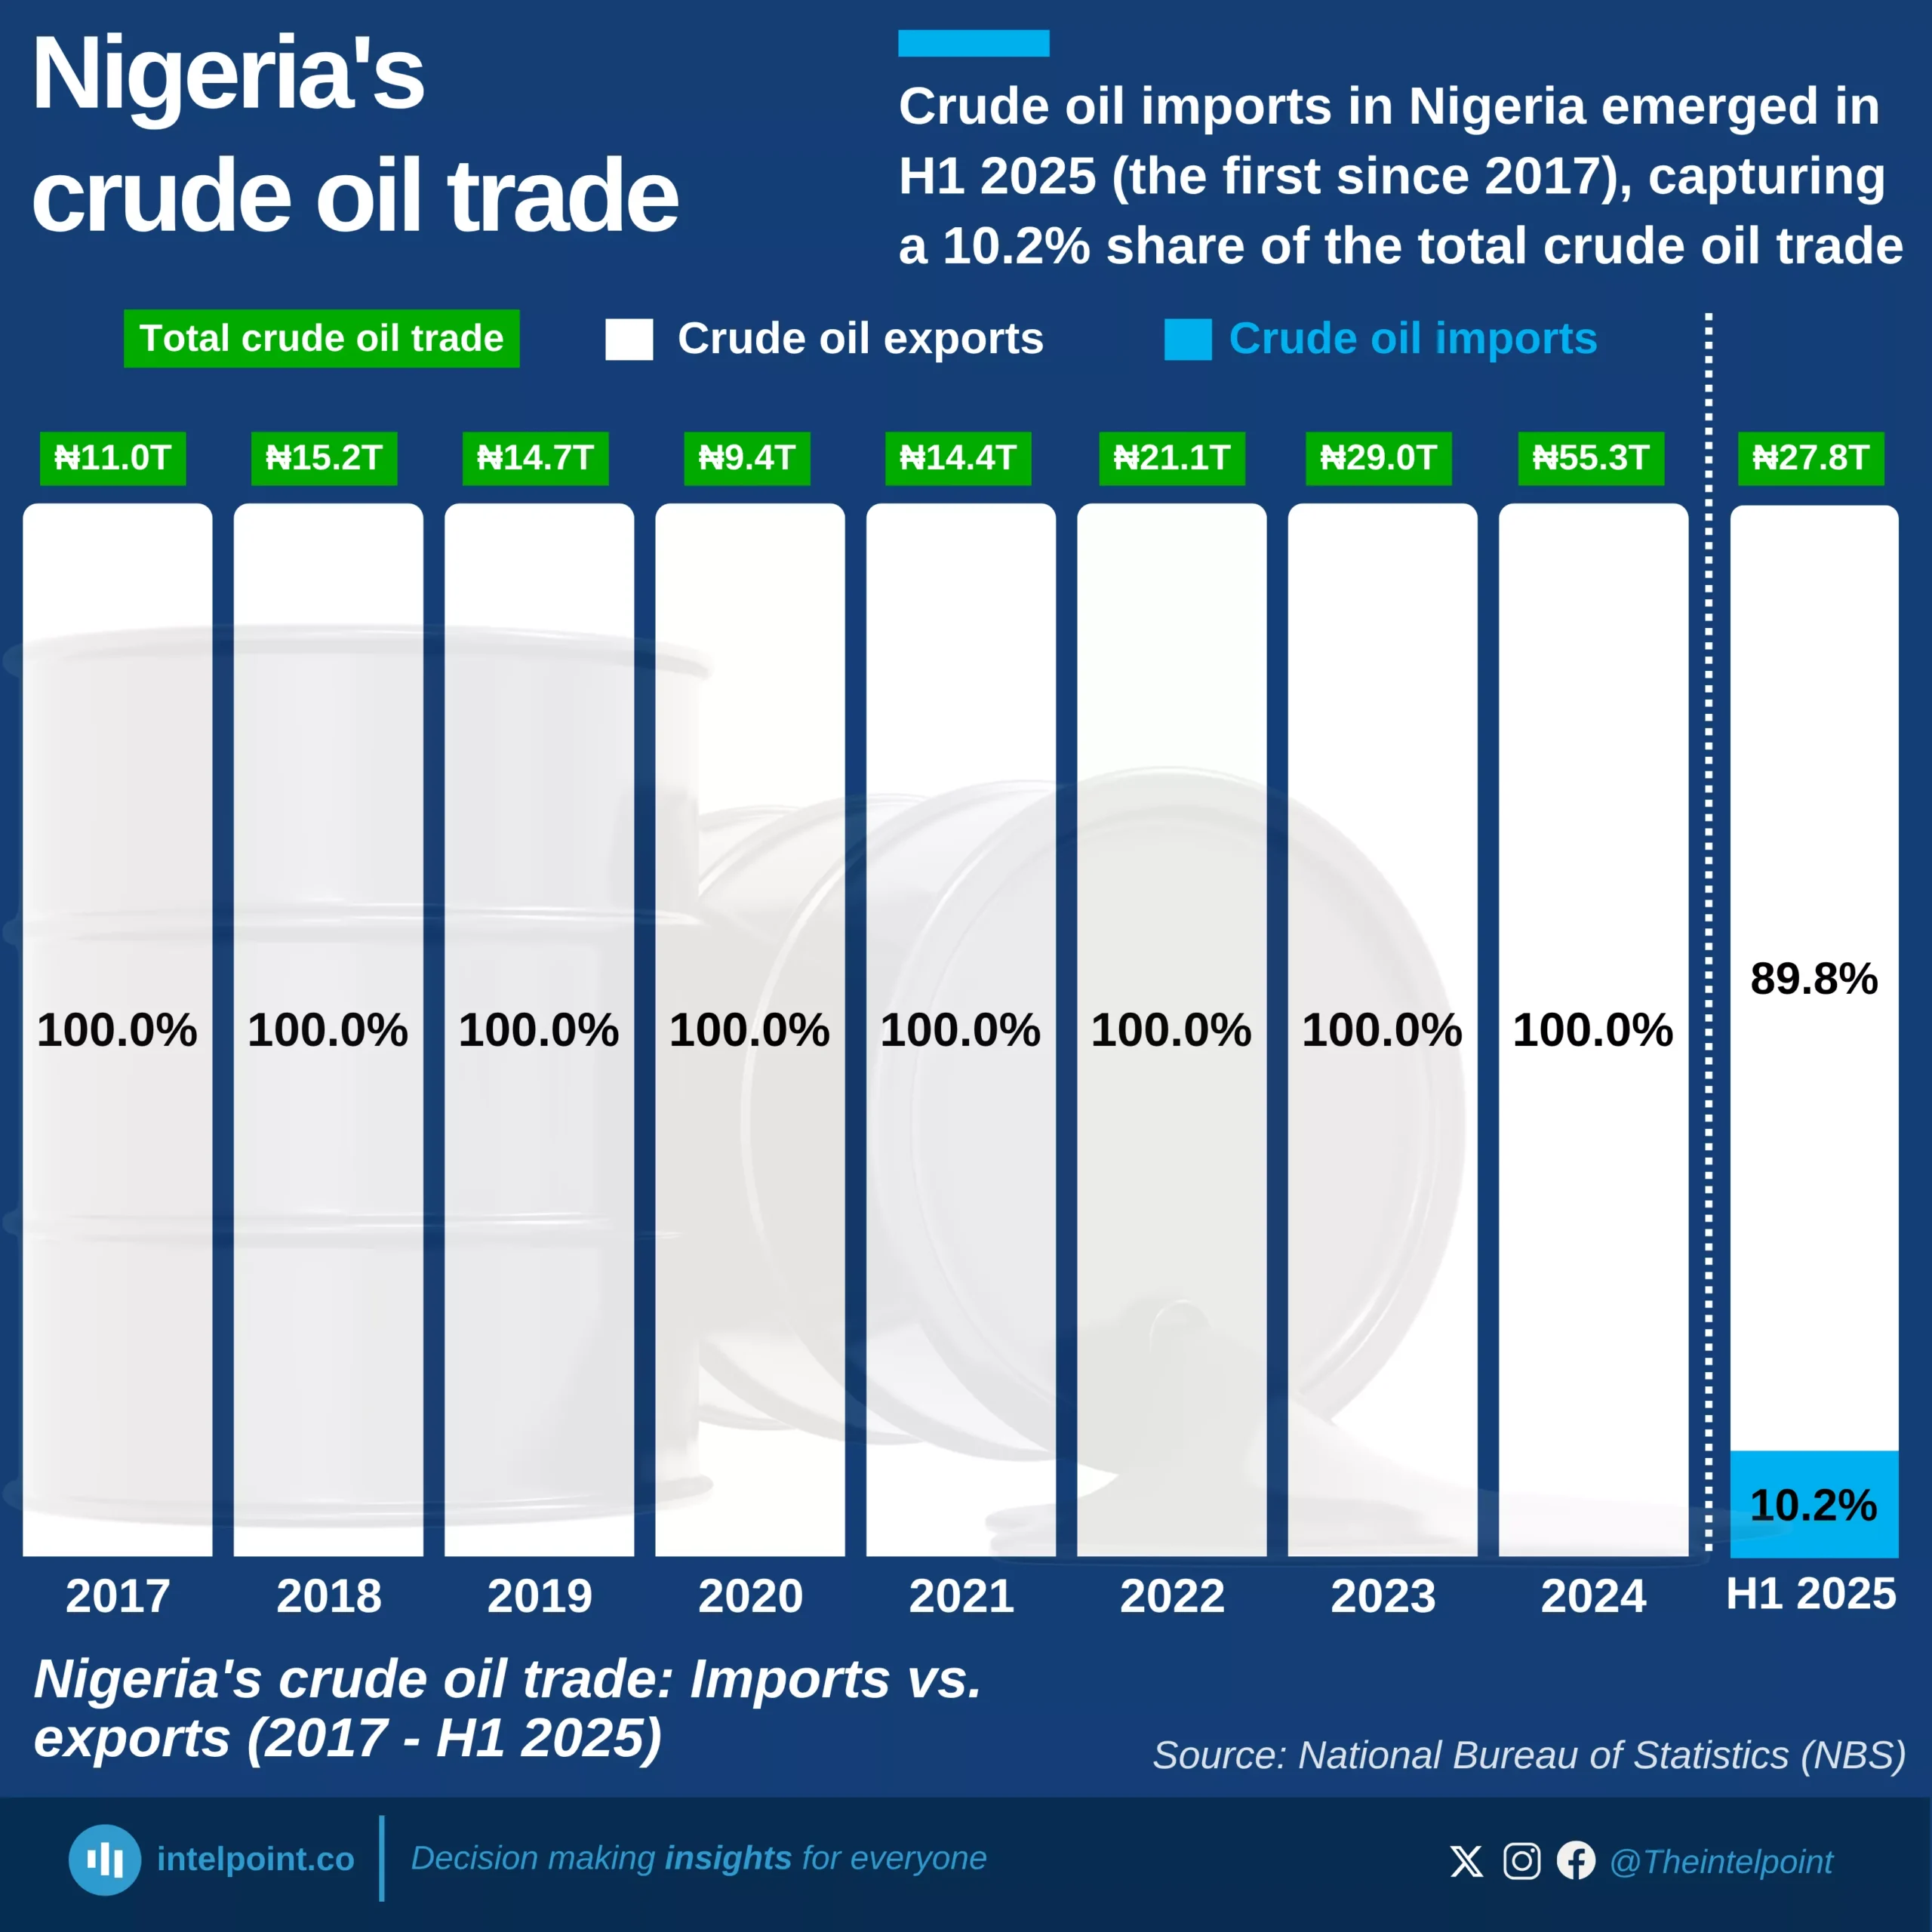
Crude oil imports in Nigeria emerged in H1 2025 (the first since 2017), capturing a 10.2% share of the total crude oil trade
  • Crude oil imports into Nigeria in H1 2025 marked the first occurrence since 2017.
  • Crude oil imports accounted for 10.2% of total crude oil trade.
  • From 2017 to 2024, exports made up 100% of crude oil trade annually.
  • Total crude oil trade peaked at ₦55.3 trillion in 2024.
  • The emergence of crude oil imports can be linked to domestic refinery operations, especially the Dangote Refinery.

POPULAR TOPICS
SIGN UP TO OUR NEWSLETTER
Get periodic updates about the African startup space, access to our reports, among others.
Subscribe Here
Subscription Form

A product of Techpoint Africa. All rights reserved