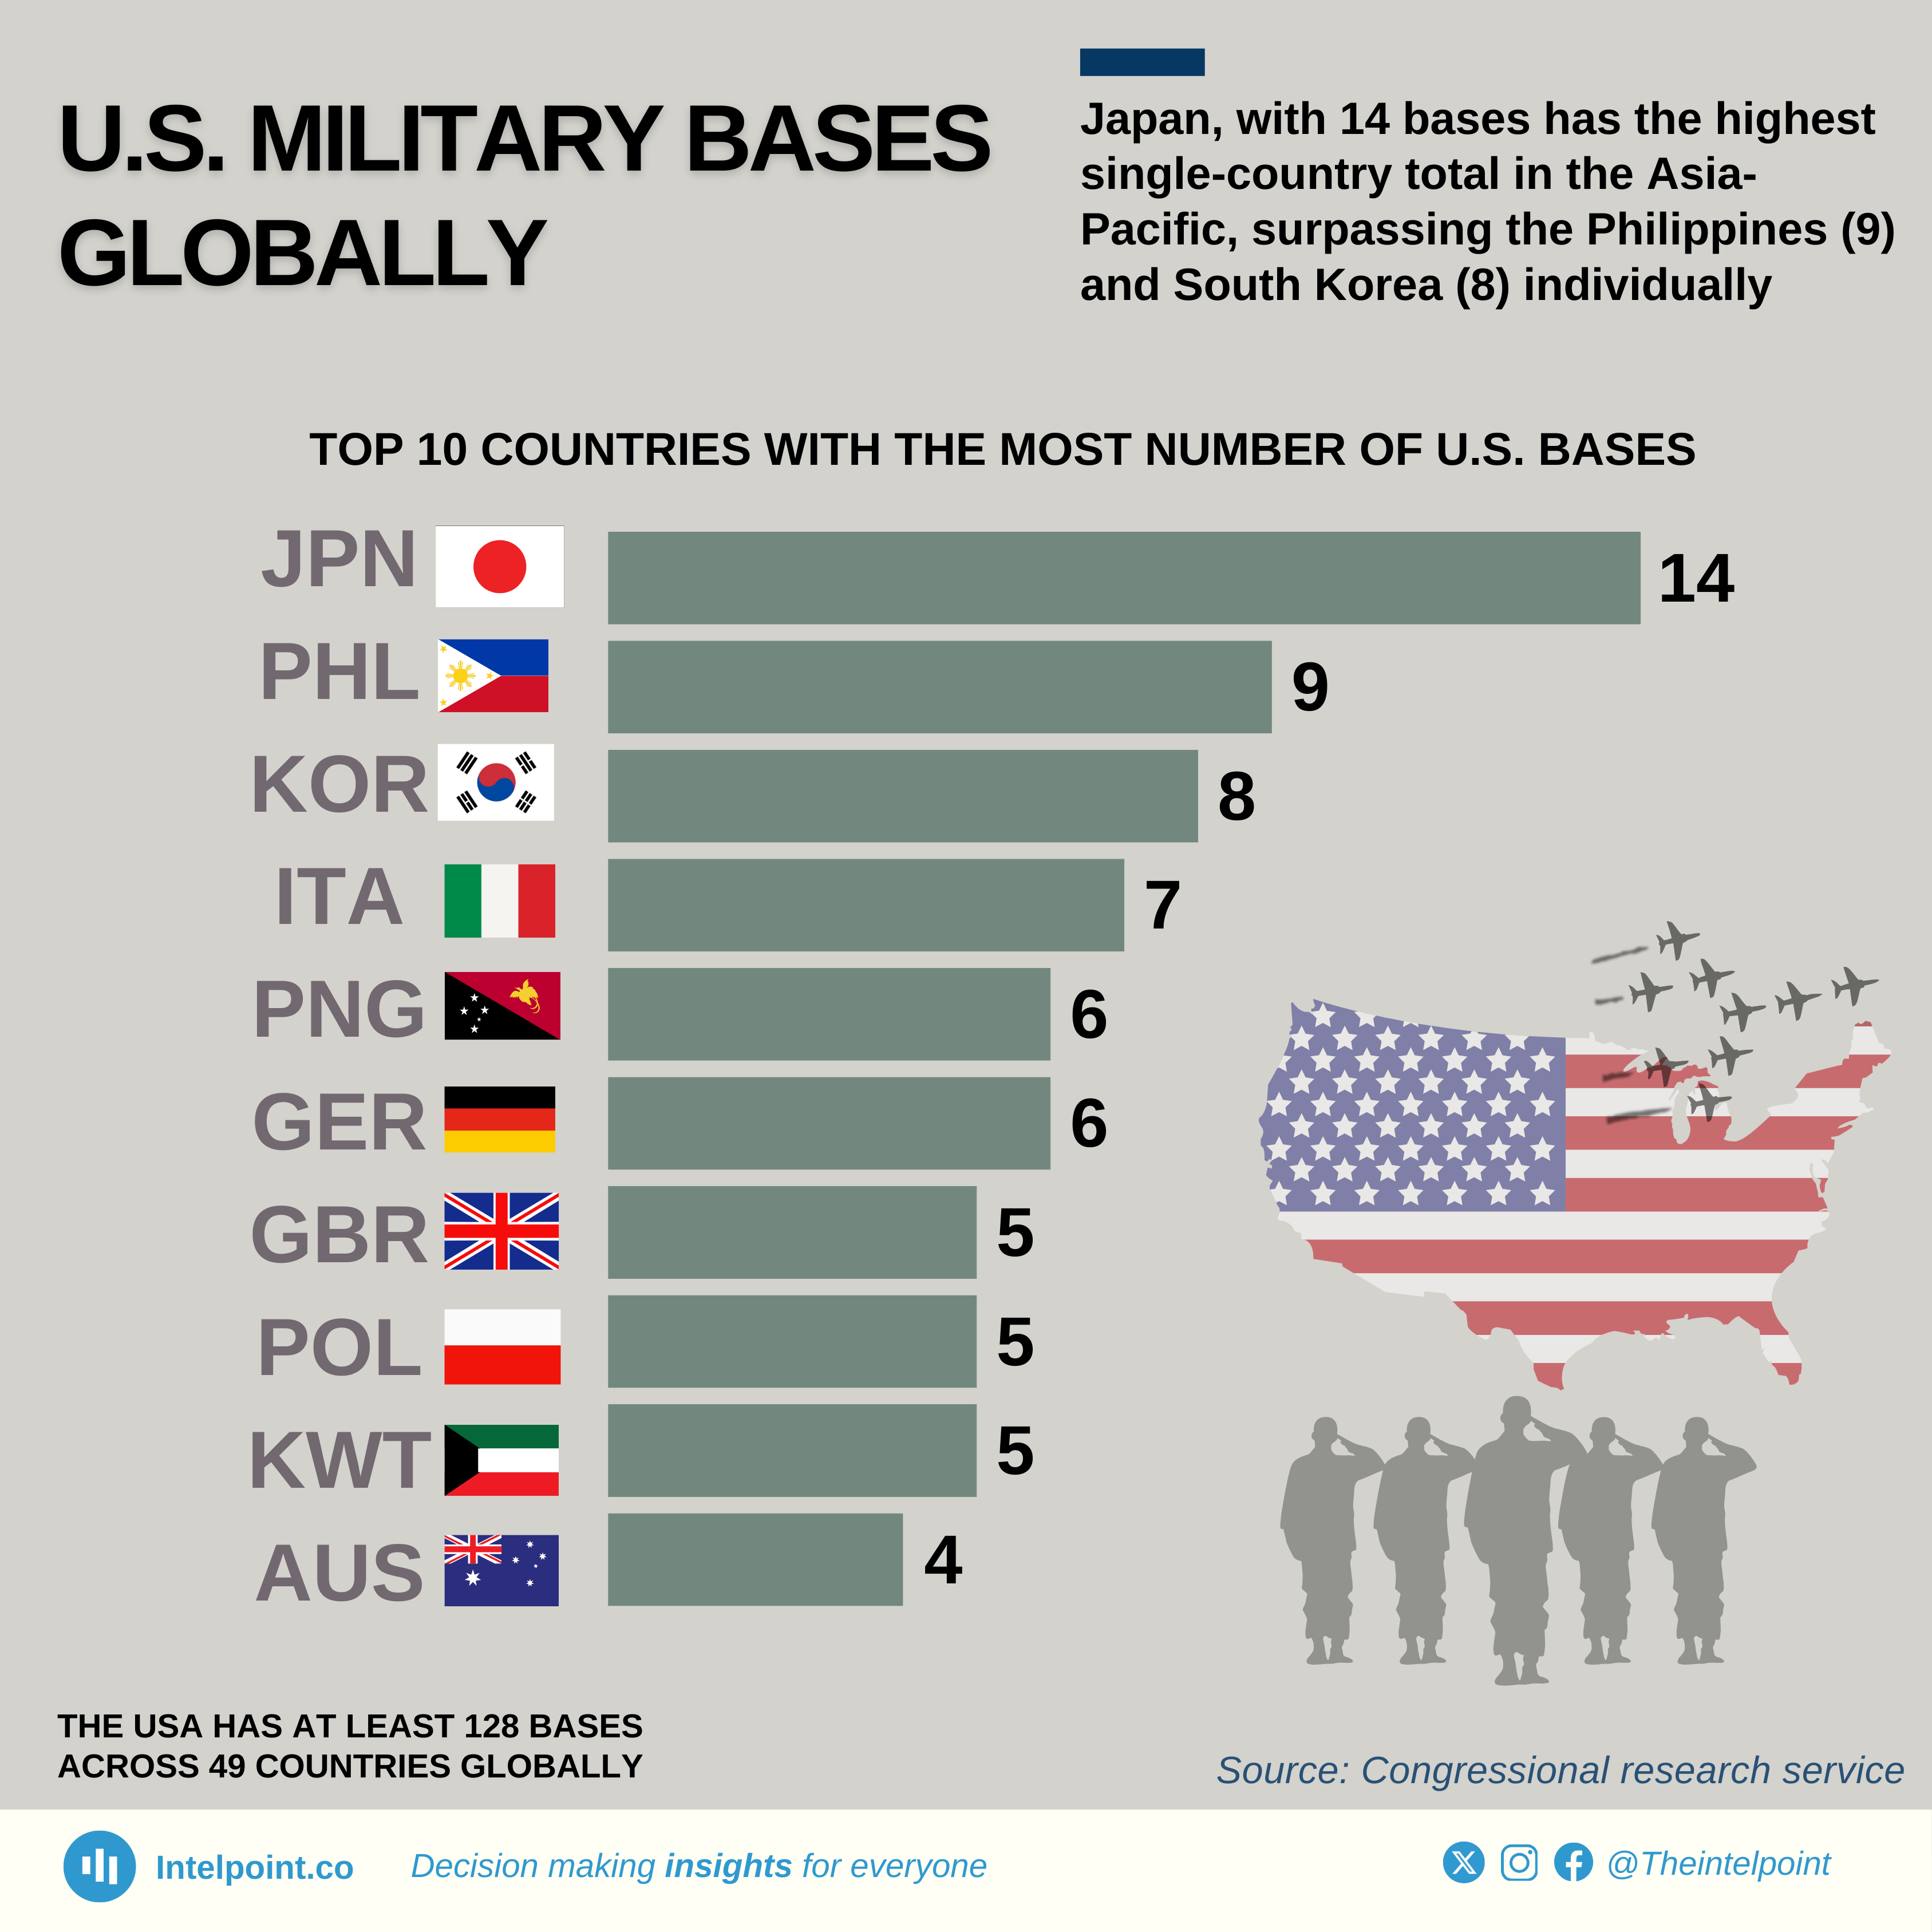
Top 10 Countries With The Most Number of U.S. Military Bases

Key Takeaways

  • Japan leads with 14 bases. It hosts the most U.S. bases globally, exceeding individual counts in the Philippines (9) and South Korea (8).
  • Asia-Pacific Dominance: The region (Japan, Philippines, South Korea, Australia, and Papua New Guinea) accounts for 41 bases, nearly 1/3 of the global total.
  • The Asia-Pacific region hosts 41 U.S. bases, while Europe (Italy, Germany, Poland, UK) has 23. This indicates a growing strategic pivot towards the Pacific compared to traditional European deployments.
  •  Kuwait (5 bases) stands out as the primary hub for U.S. military operations in the Middle East, highlighting its role as a key staging ground for regional security.
  • The top 10 host countries account for 69 of the 128 total bases (over 53%), meaning nearly half of U.S. overseas bases are spread across the remaining 39 countries.

The U.S. maintains 128 bases across 49 countries, with Japan alone hosting 14 — the highest single-nation total. While Japan leads individually, the Philippines (9) and South Korea (8) collectively hold 17 bases in the Asia-Pacific, highlighting the region’s strategic priority.

Europe’s footprint spans Italy (7), Germany (6), and Poland (5), reflecting NATO’s eastern focus, while Kuwait (5) anchors Middle East operations. Emerging deployments in Papua New Guinea (6) highlight Pacific militarisation efforts, contrasting with legacy hubs like Germany.
Source:

Congressional research service

Period:

2024
HTML code to embed chart
Want a bespoke report?
Reach out
Tags
Related Insights

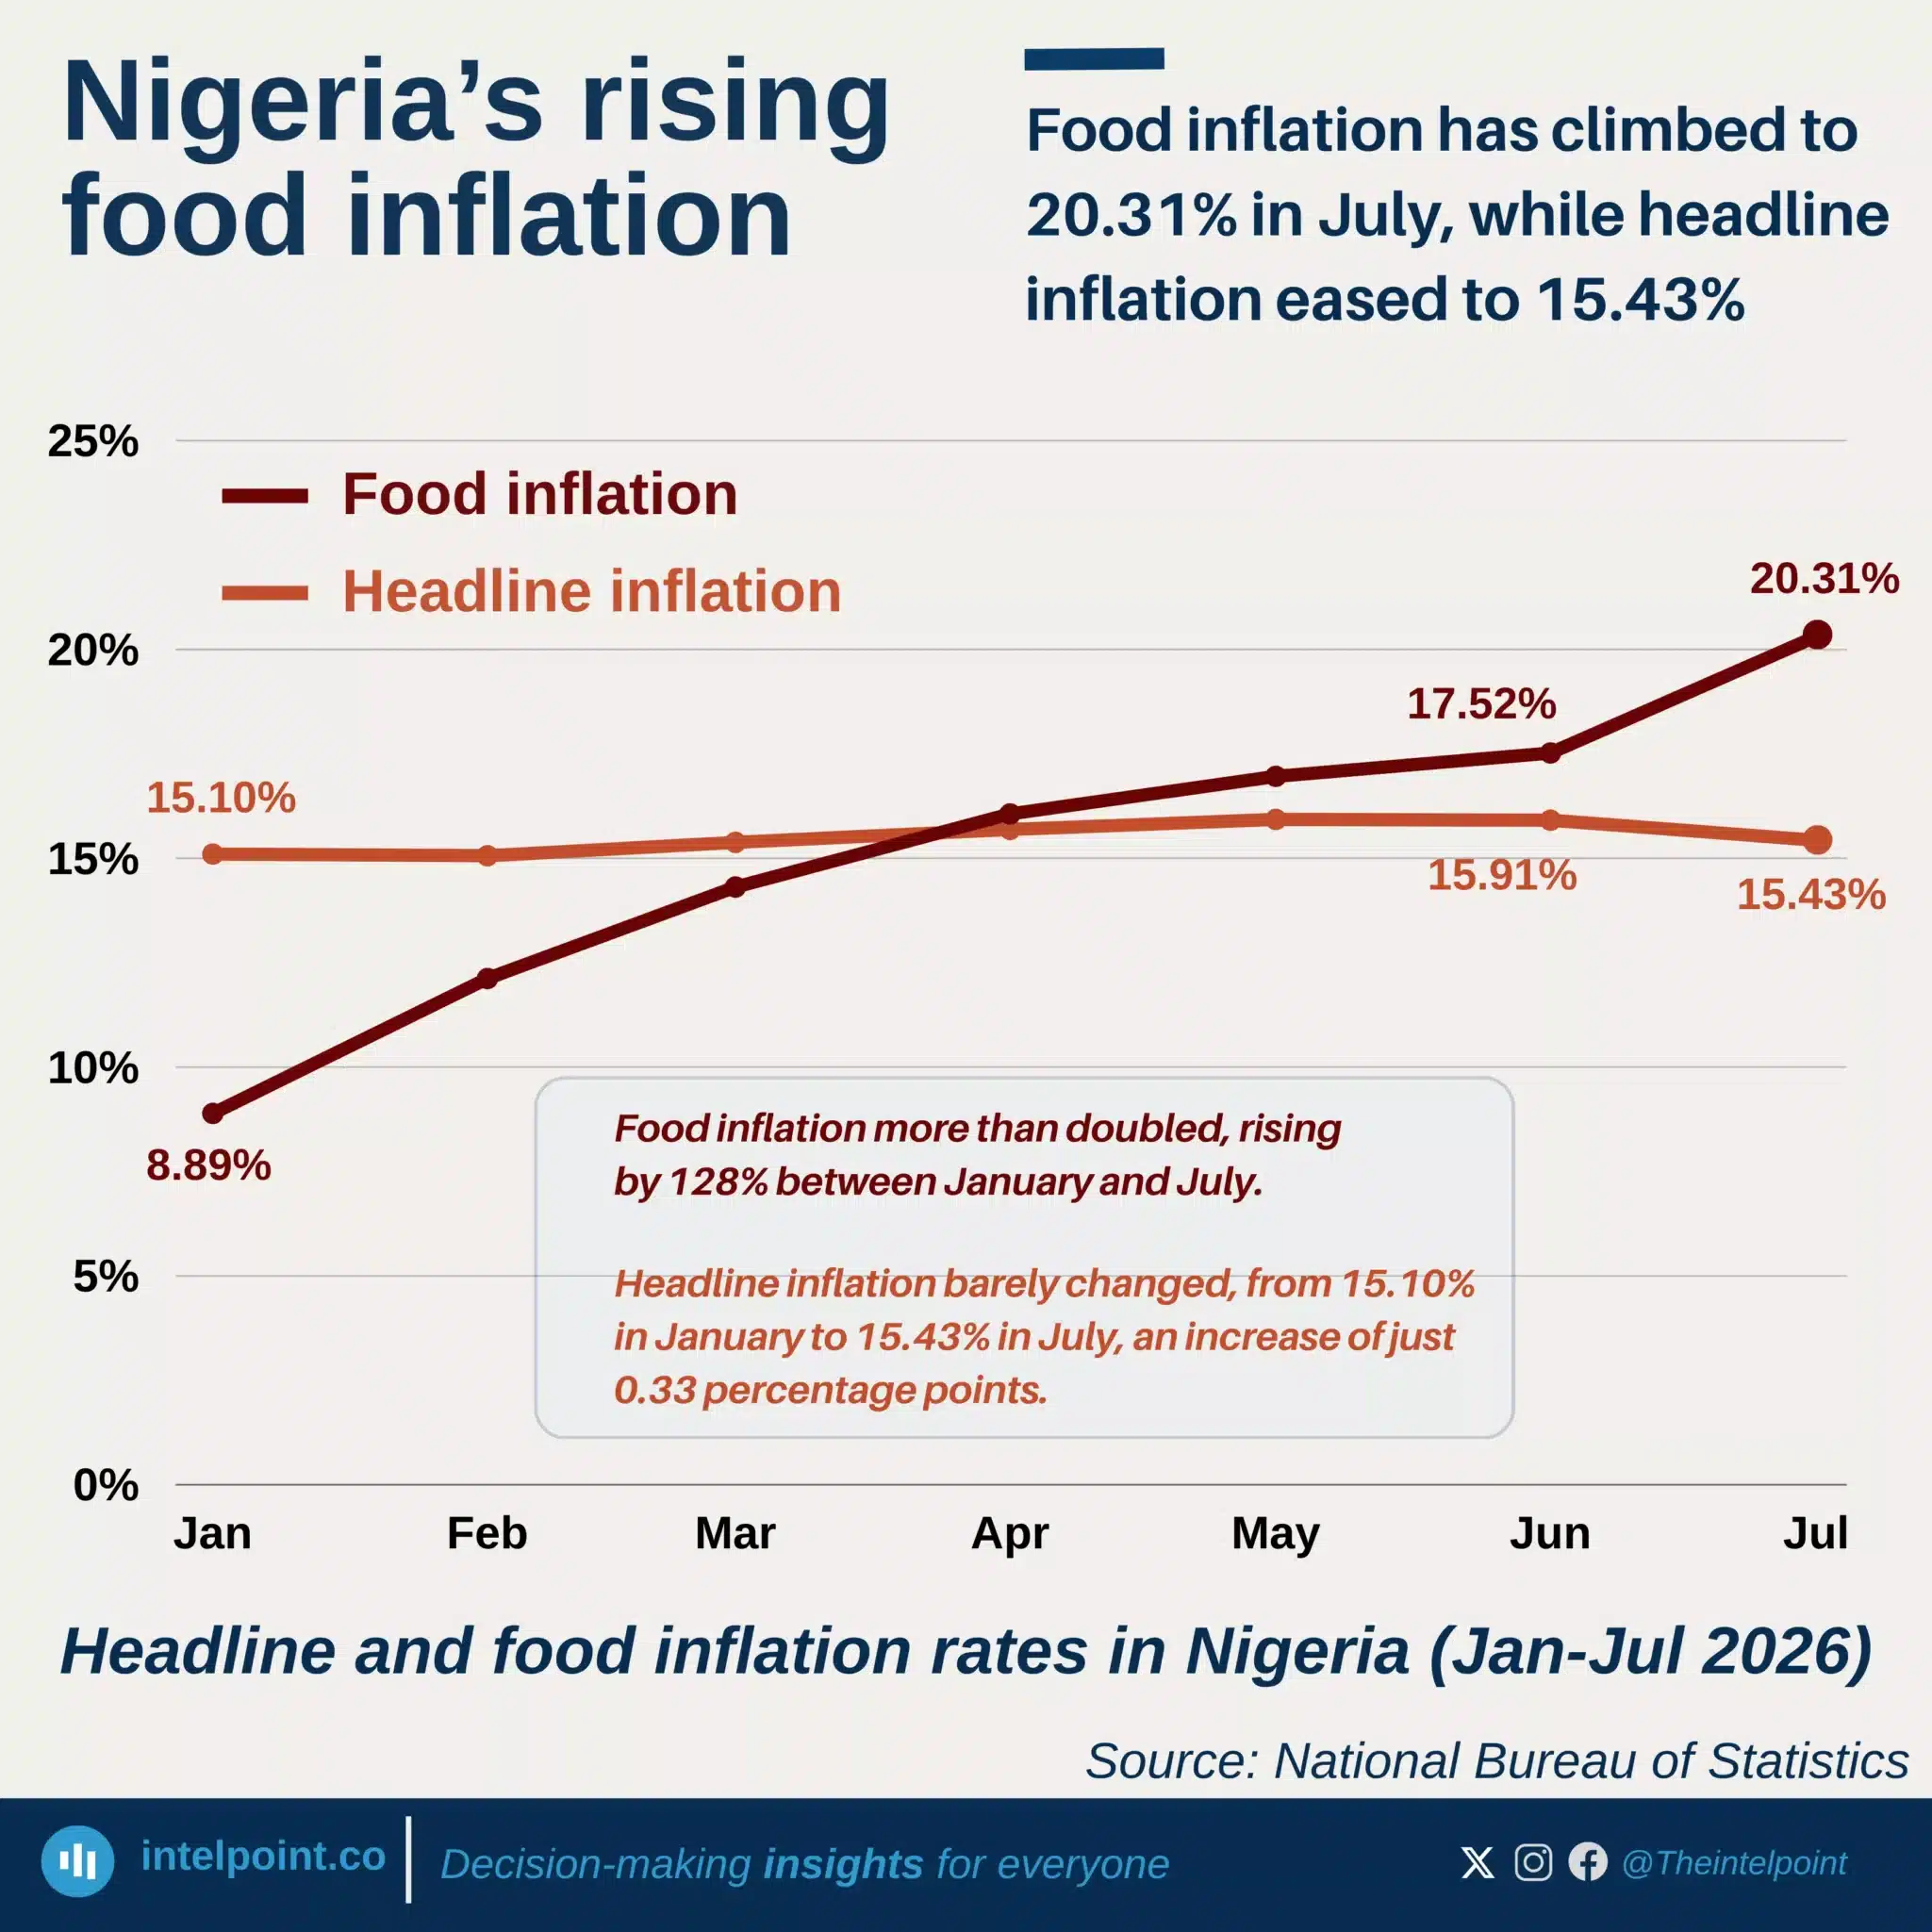
Food inflation has climbed to 20.31% in July, while headline inflation eased to 15.43%
  • Food inflation more than doubled, from 8.89% in January to 20.31% in July.
  • Food inflation overtook headline inflation, moving from 6.21 points below to 4.88 points above it.
  • Headline inflation barely changed, from 15.10% to 15.43%.
  • Food price pressures accelerated, with monthly inflation rising to 5.56% in July.

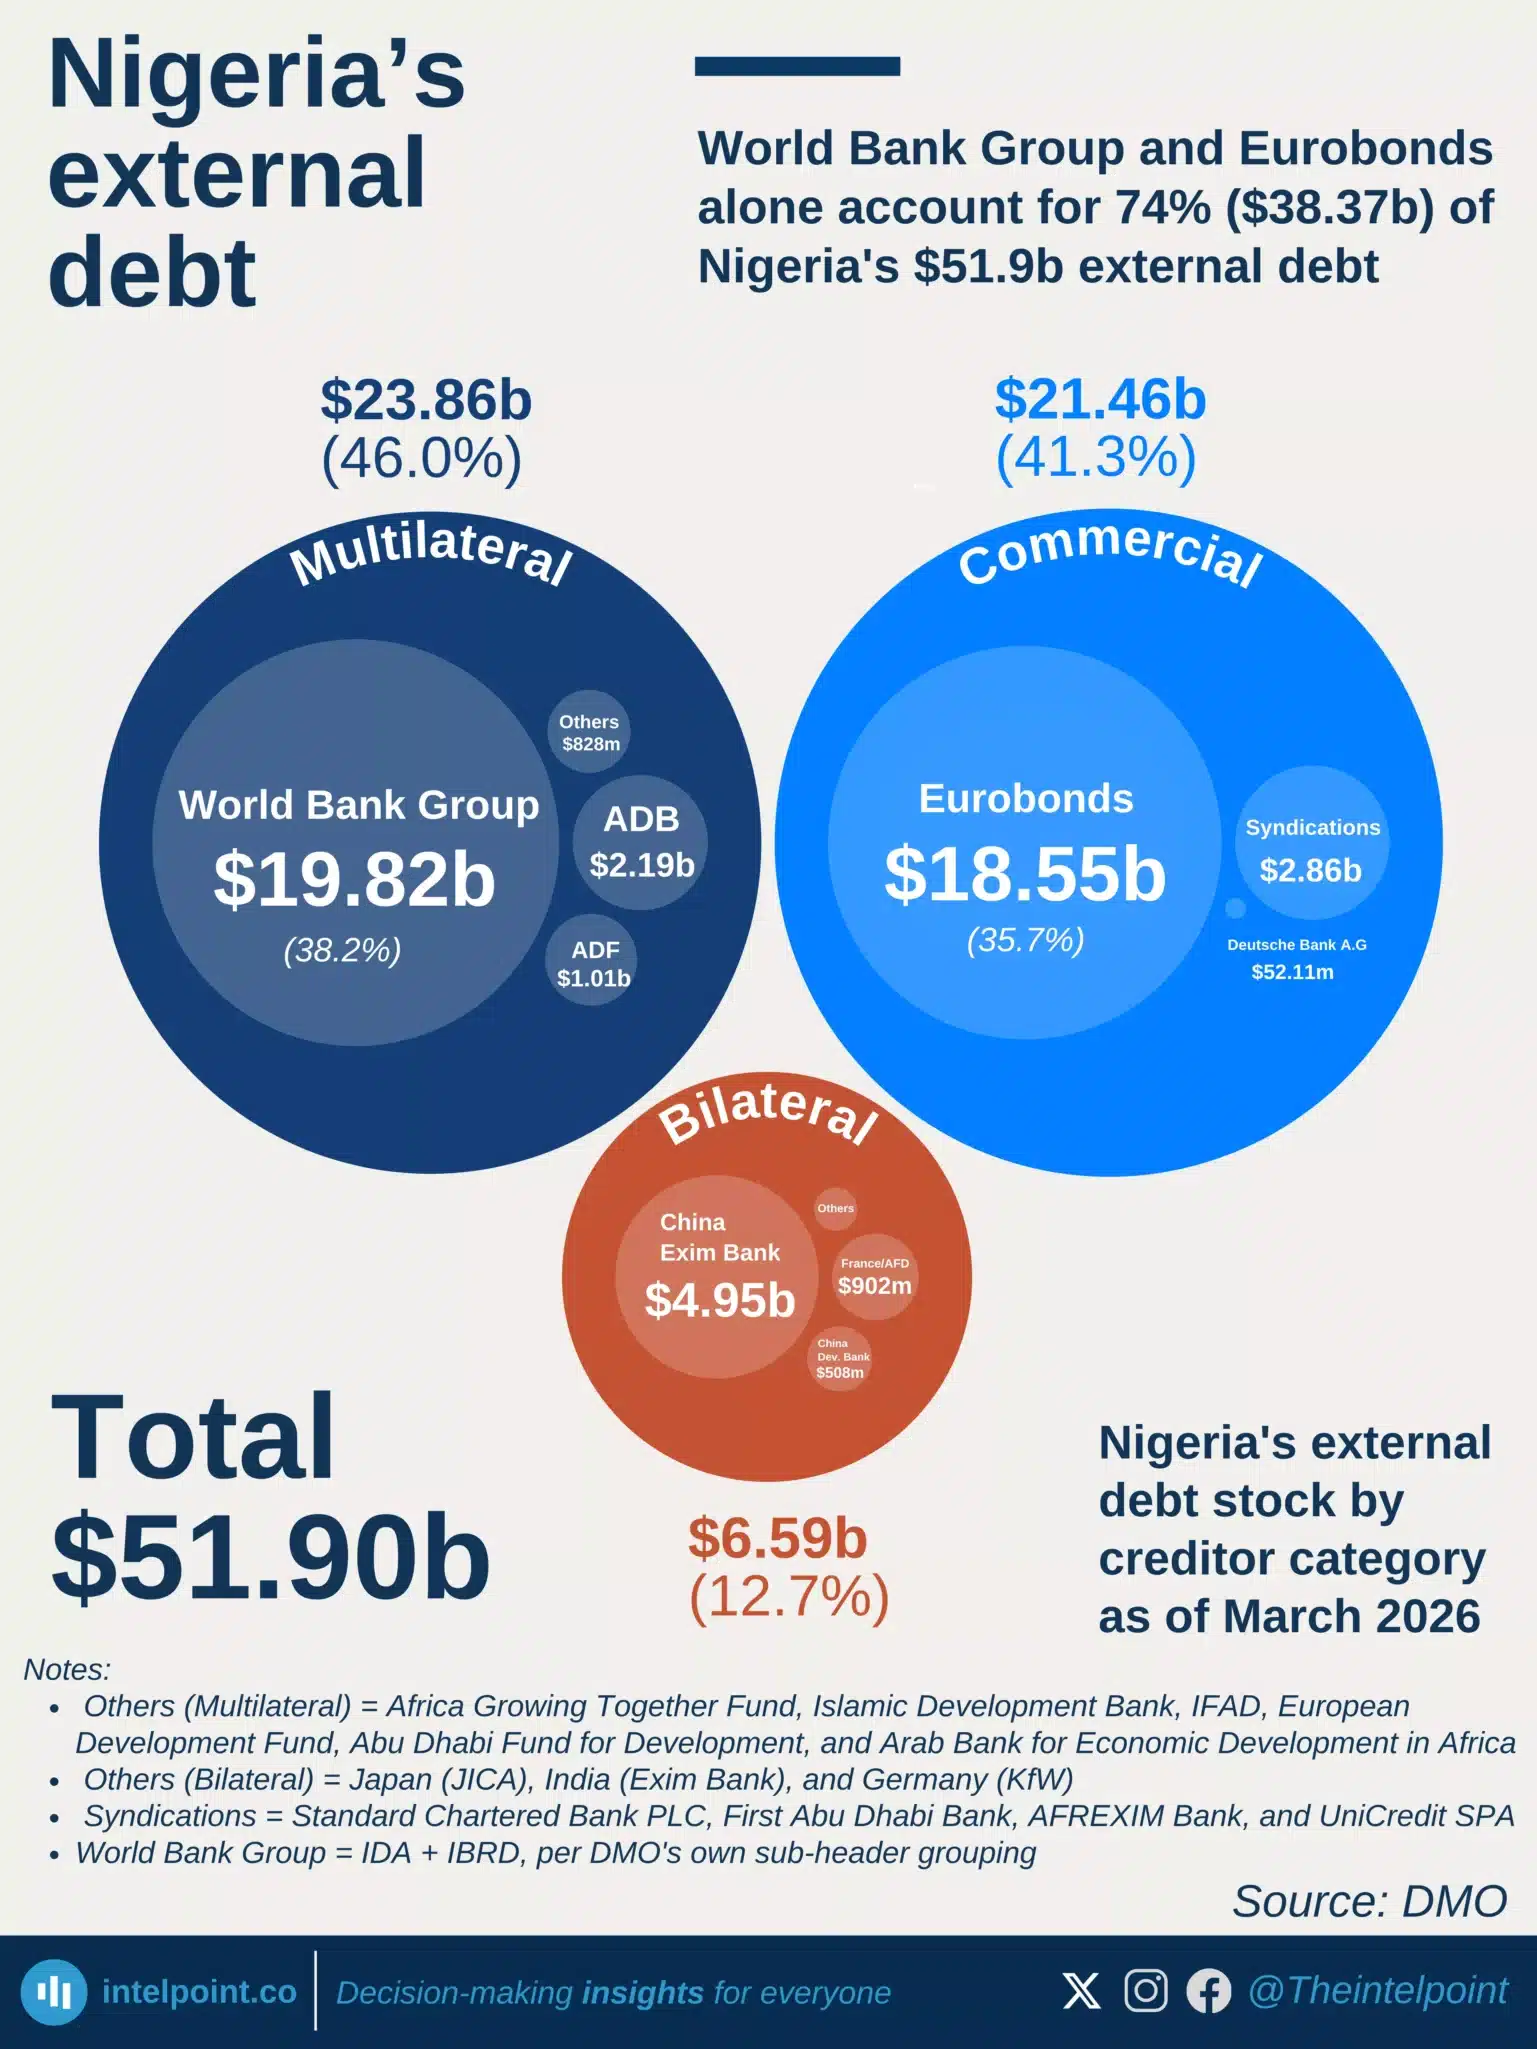
World Bank Group and Eurobonds alone account for 74% ($38.37b) of Nigeria's $51.9b external debt
  • Nigeria’s external debt stood at $51.90 billion as of March 2026.
  • External debt increased by just 0.09% from December 2025.
  • Multilateral creditors held the largest share at 46.0%.
  • Commercial creditors accounted for 41.3% of external debt.
  • Bilateral creditors accounted for 12.7% of external debt.
  • The World Bank Group accounted for 38.2% of total external debt.
  • Eurobond holders accounted for 35.7% of total external debt.
  • The World Bank Group and Eurobond holders together accounted for 73.9% of Nigeria’s external debt.
  • Bilateral debt fell by $130 million from December 2025 to March 2026.
  • Commercial external debt increased by about $1.1 billion over the same period.

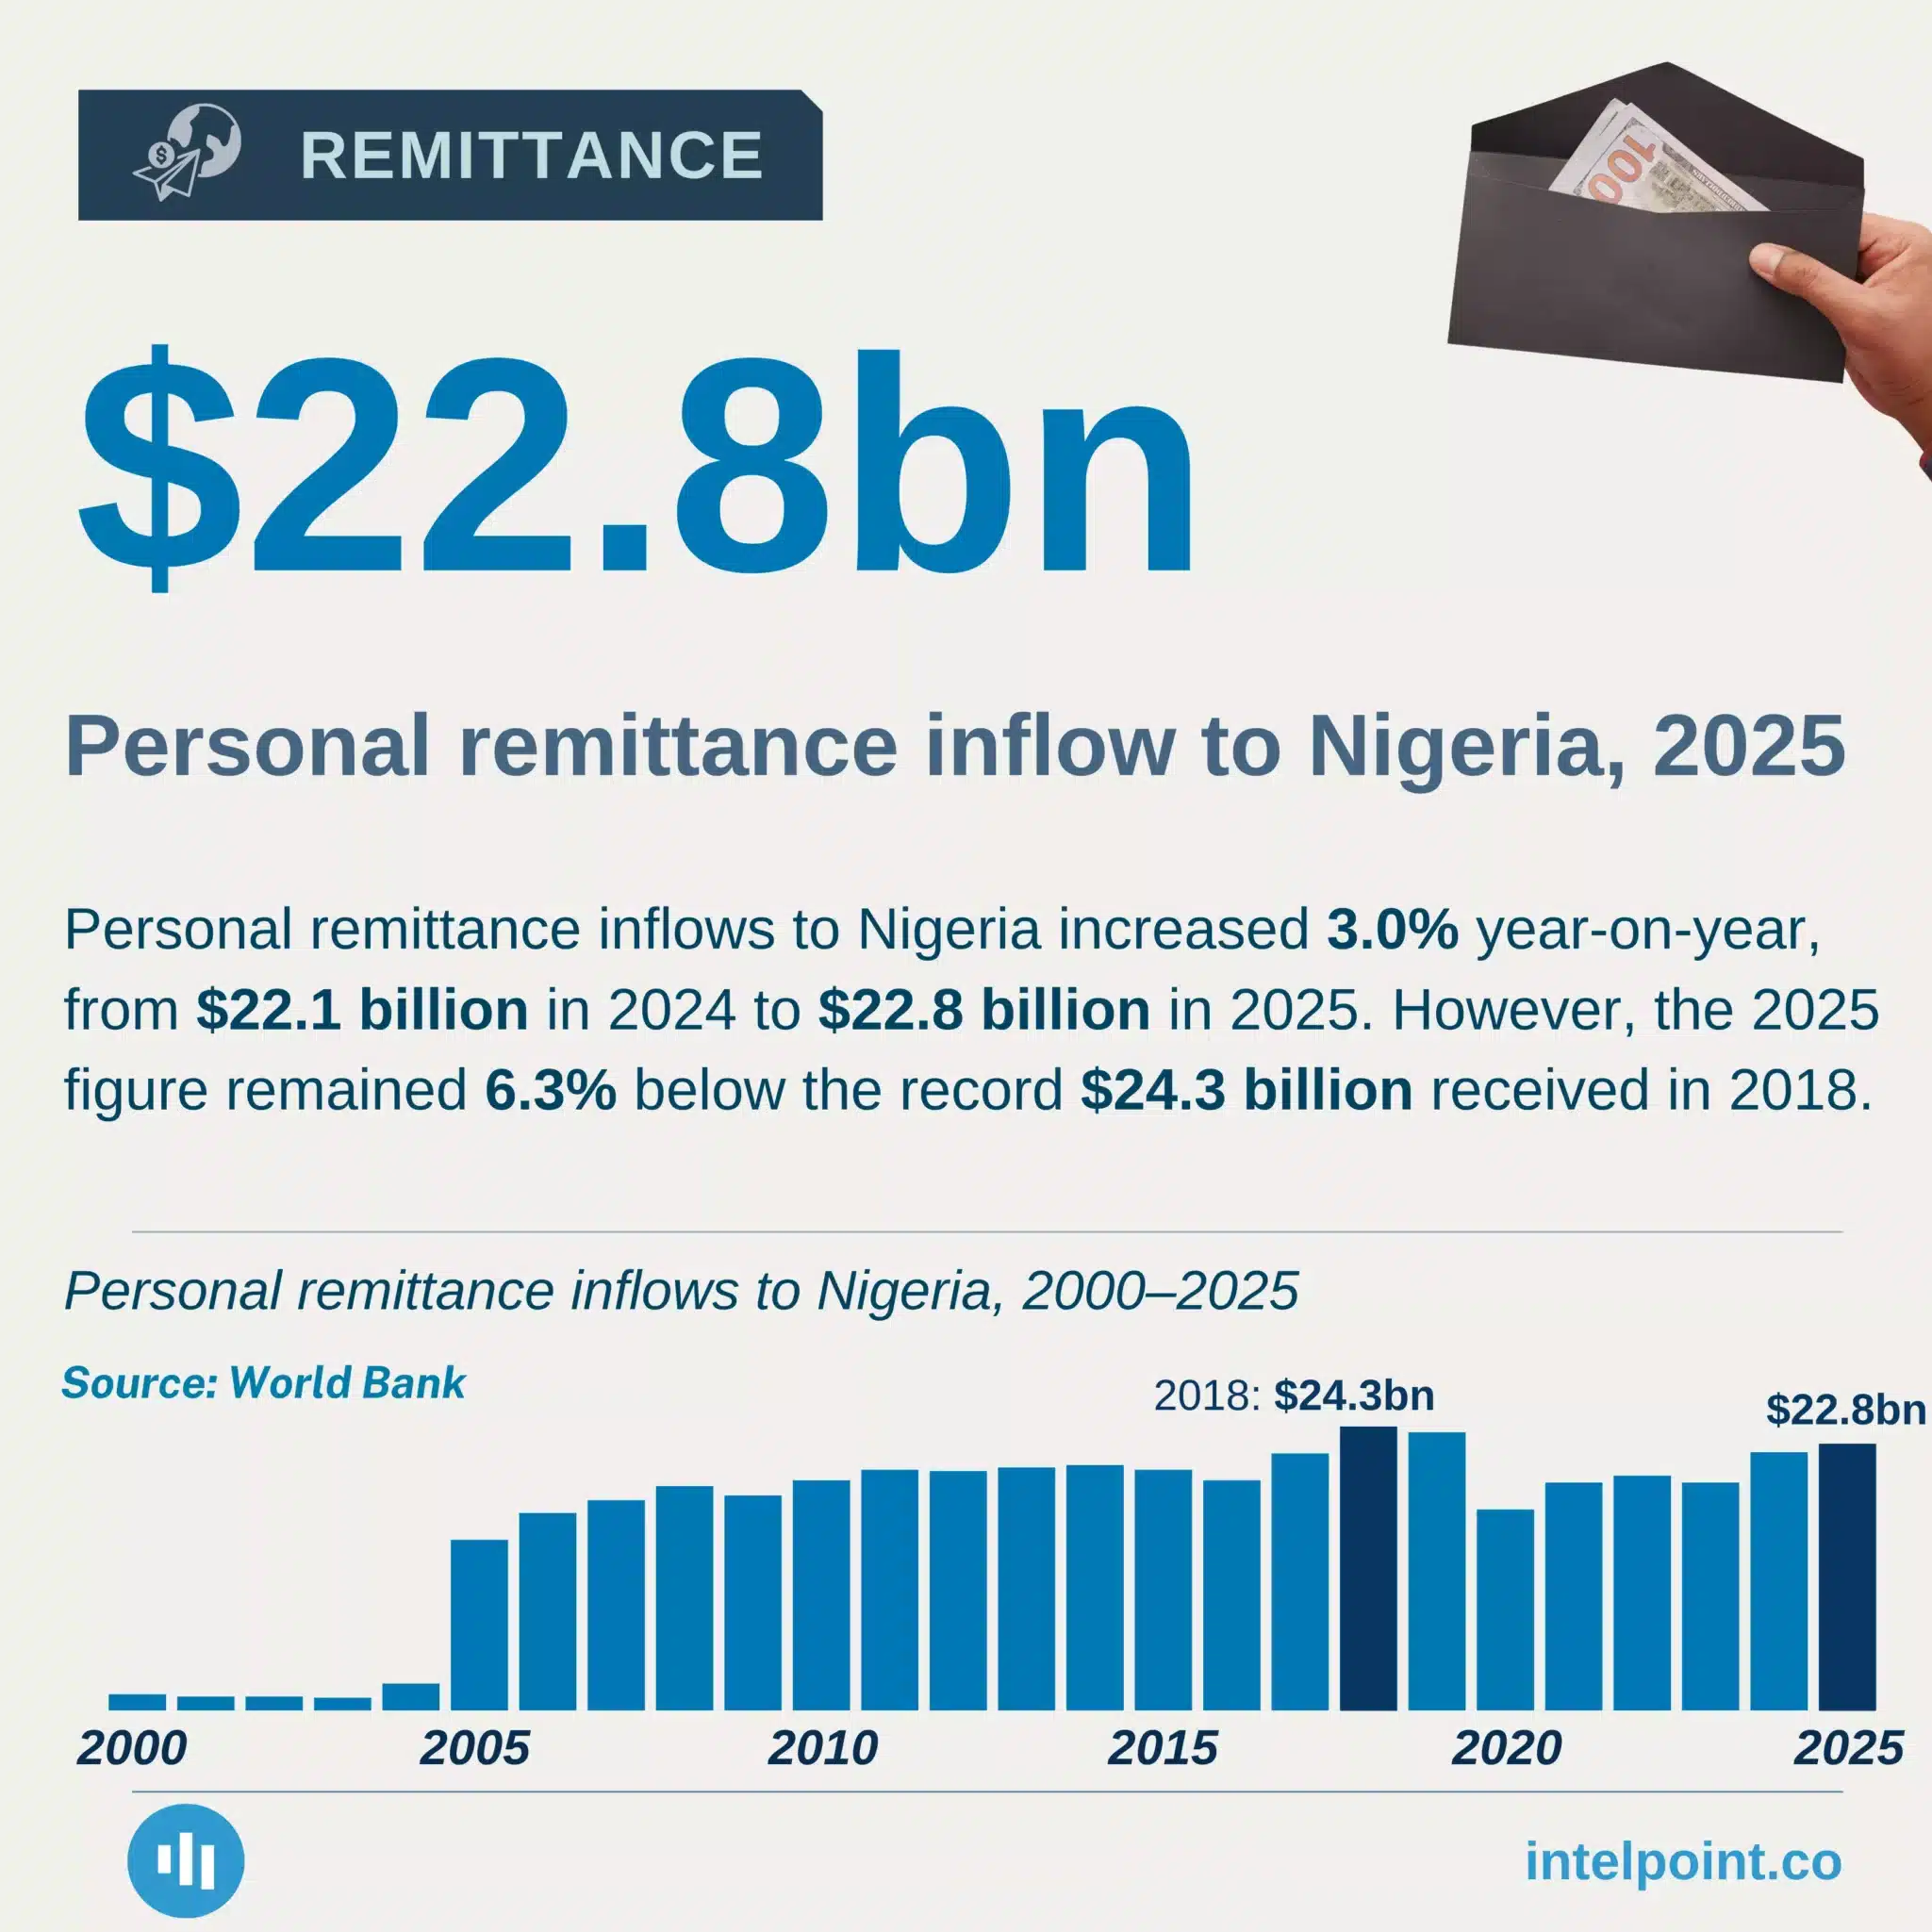
Personal remittance inflows to Nigeria increased 3.0% year-on-year, from $22.1 billion in 2024 to $22.8 billion in 2025
  • Nigeria received $22.8 billion in personal remittances in 2025; a 3% year-on-year increase
  • Inflows remained 6.3% below the 2018 record of $24.3 billion.
  • Remittances have recovered from the $17.2 billion recorded in 2020.
  • Nigeria’s 2025 remittance inflows were 32.6% higher than in 2020.
  • Remittances accounted for 7.8% of GDP in 2025.
  • Remittances’ share of GDP fell from 8.8% in 2024.
  • Remittances’ share of GDP remained above the 4.0% recorded in 2023.

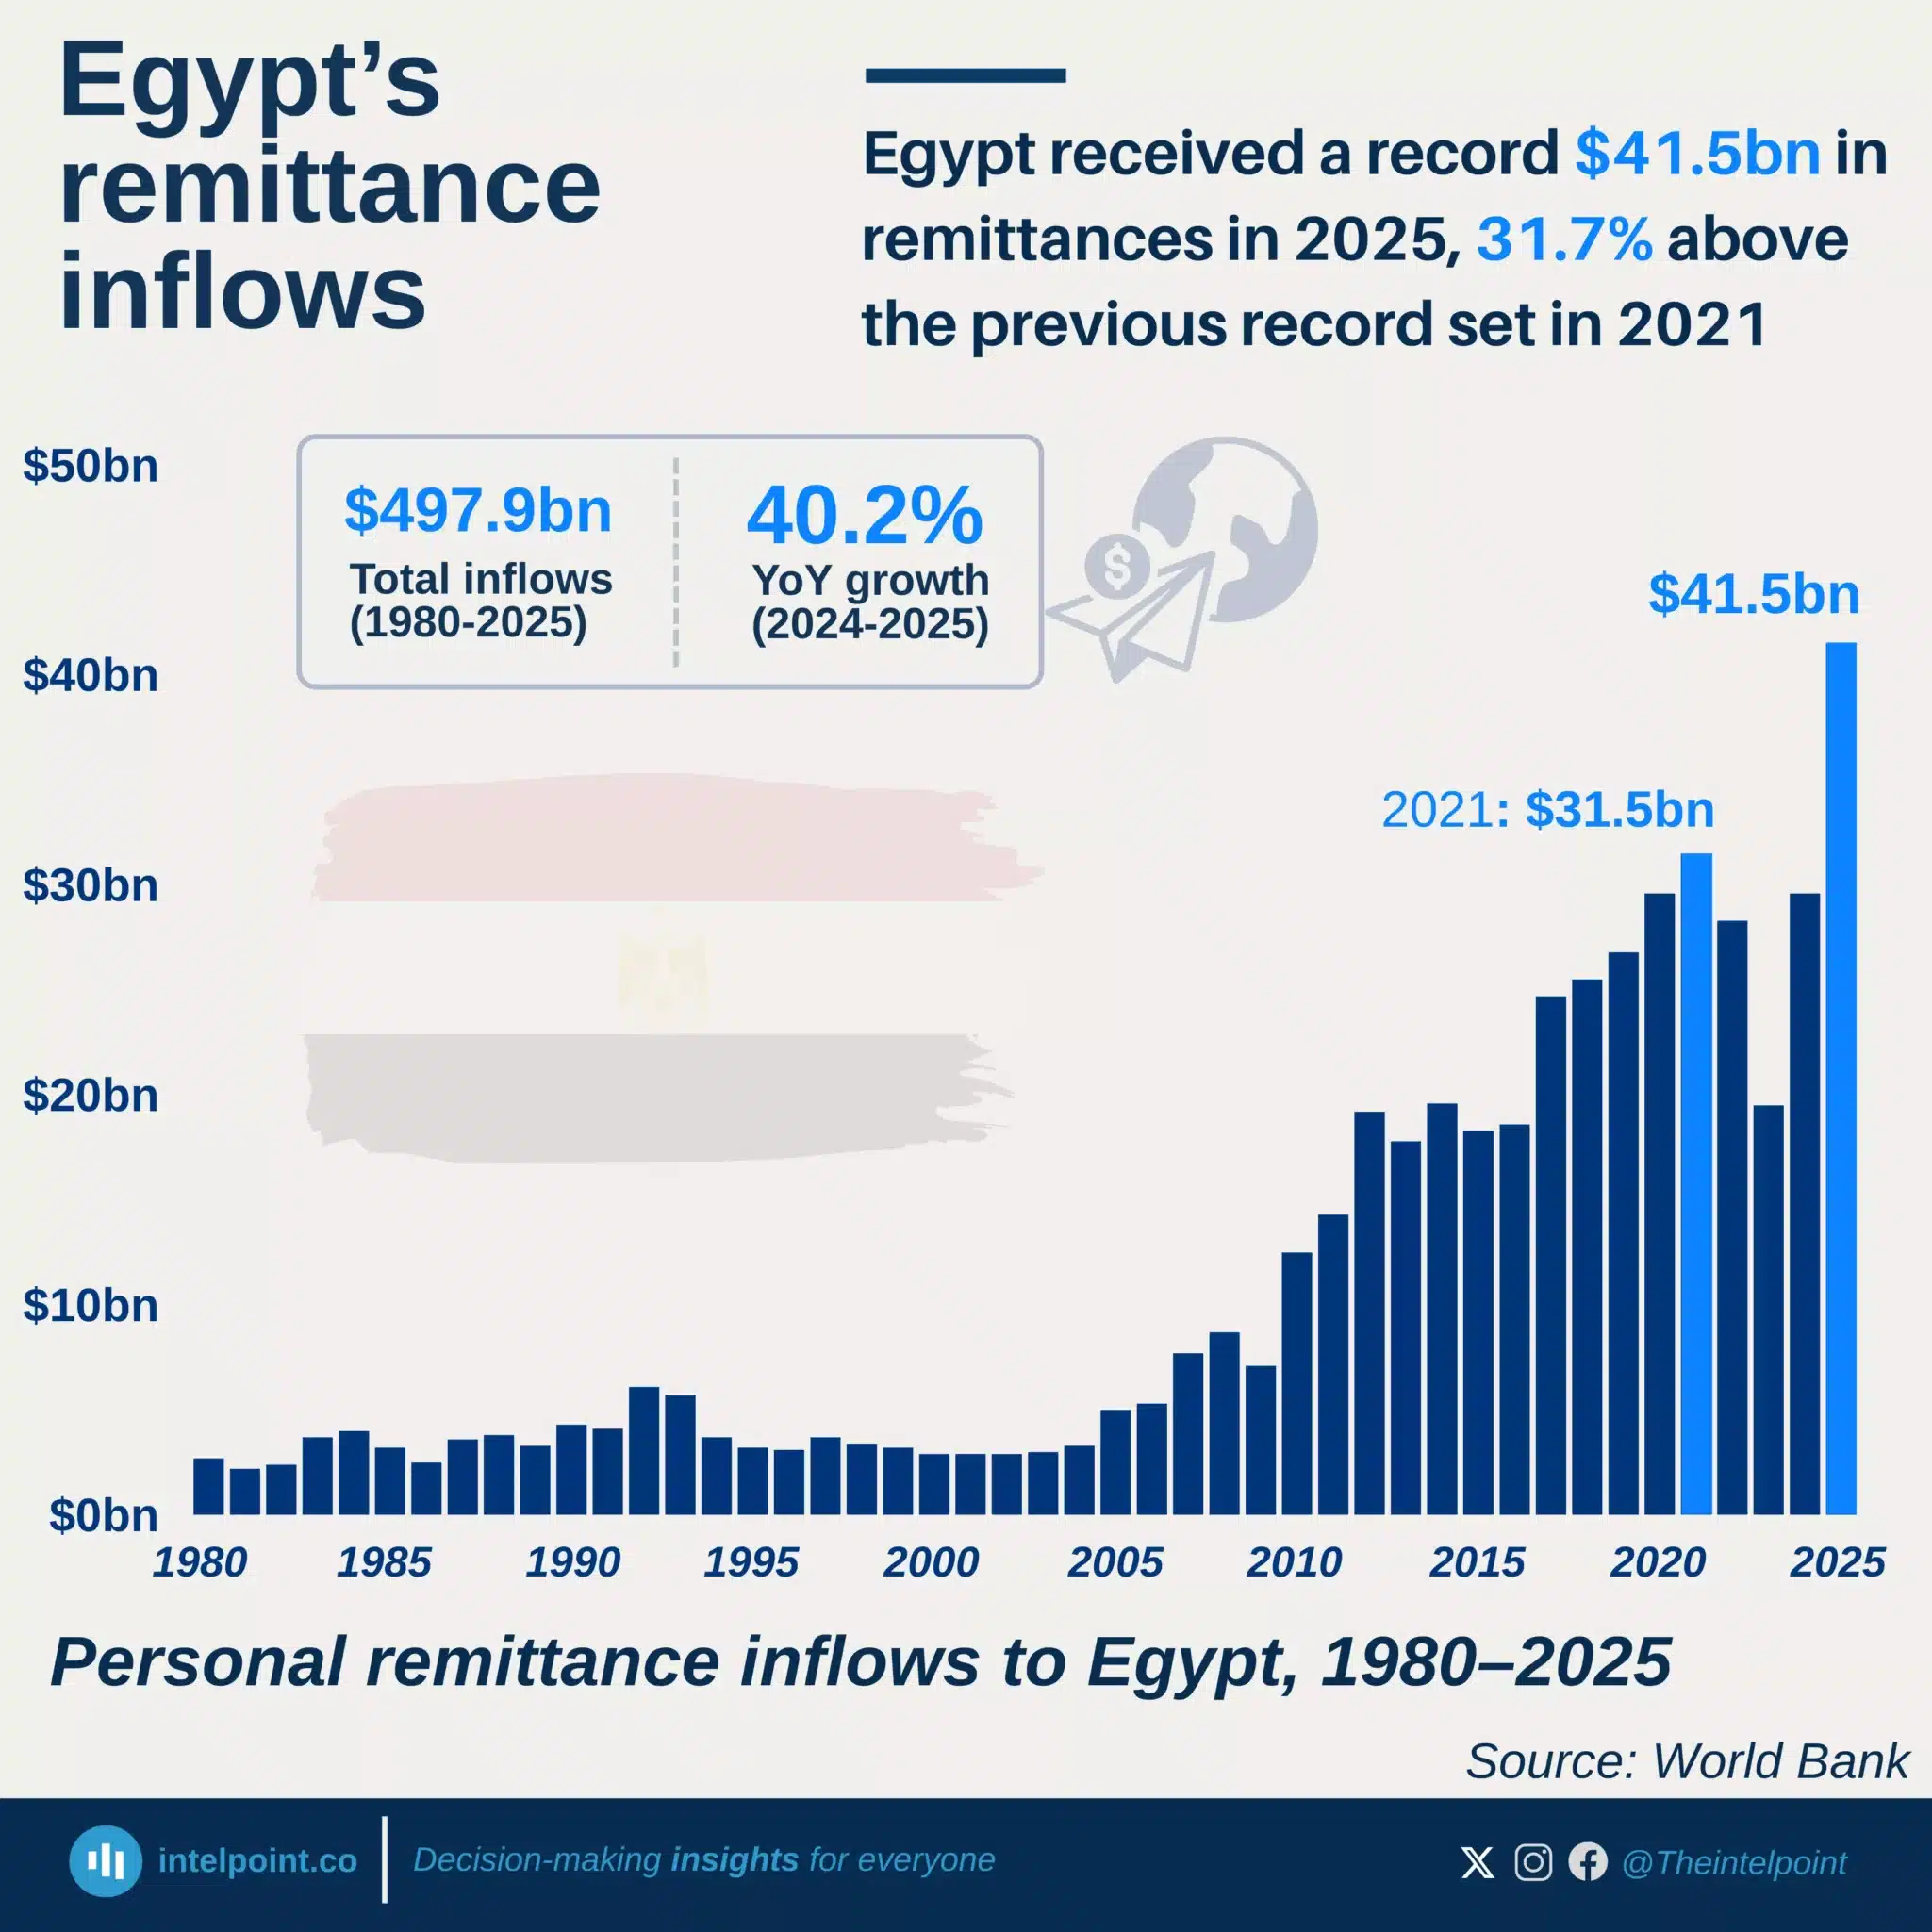
Egypt received a record $41.5bn in remittances in 2025, 31.7% above the previous record set in 2021
  • Egypt received a record $41.5 billion in remittances in 2025.
  • Remittances increased 40.2% from 2024.
  • The 2025 inflow was 31.7% above the previous record set in 2021.
  • Remittances fell to $19.5 billion in 2023 before rebounding sharply.
  • Remittances more than doubled between 2023 and 2025.
  • Egypt received about $497.9 billion in remittances from 1980 to 2025.
  • The March 2024 FX reforms preceded the sharp recovery in remittance inflows.
  • 2025 marked the highest annual remittance inflow in the series.

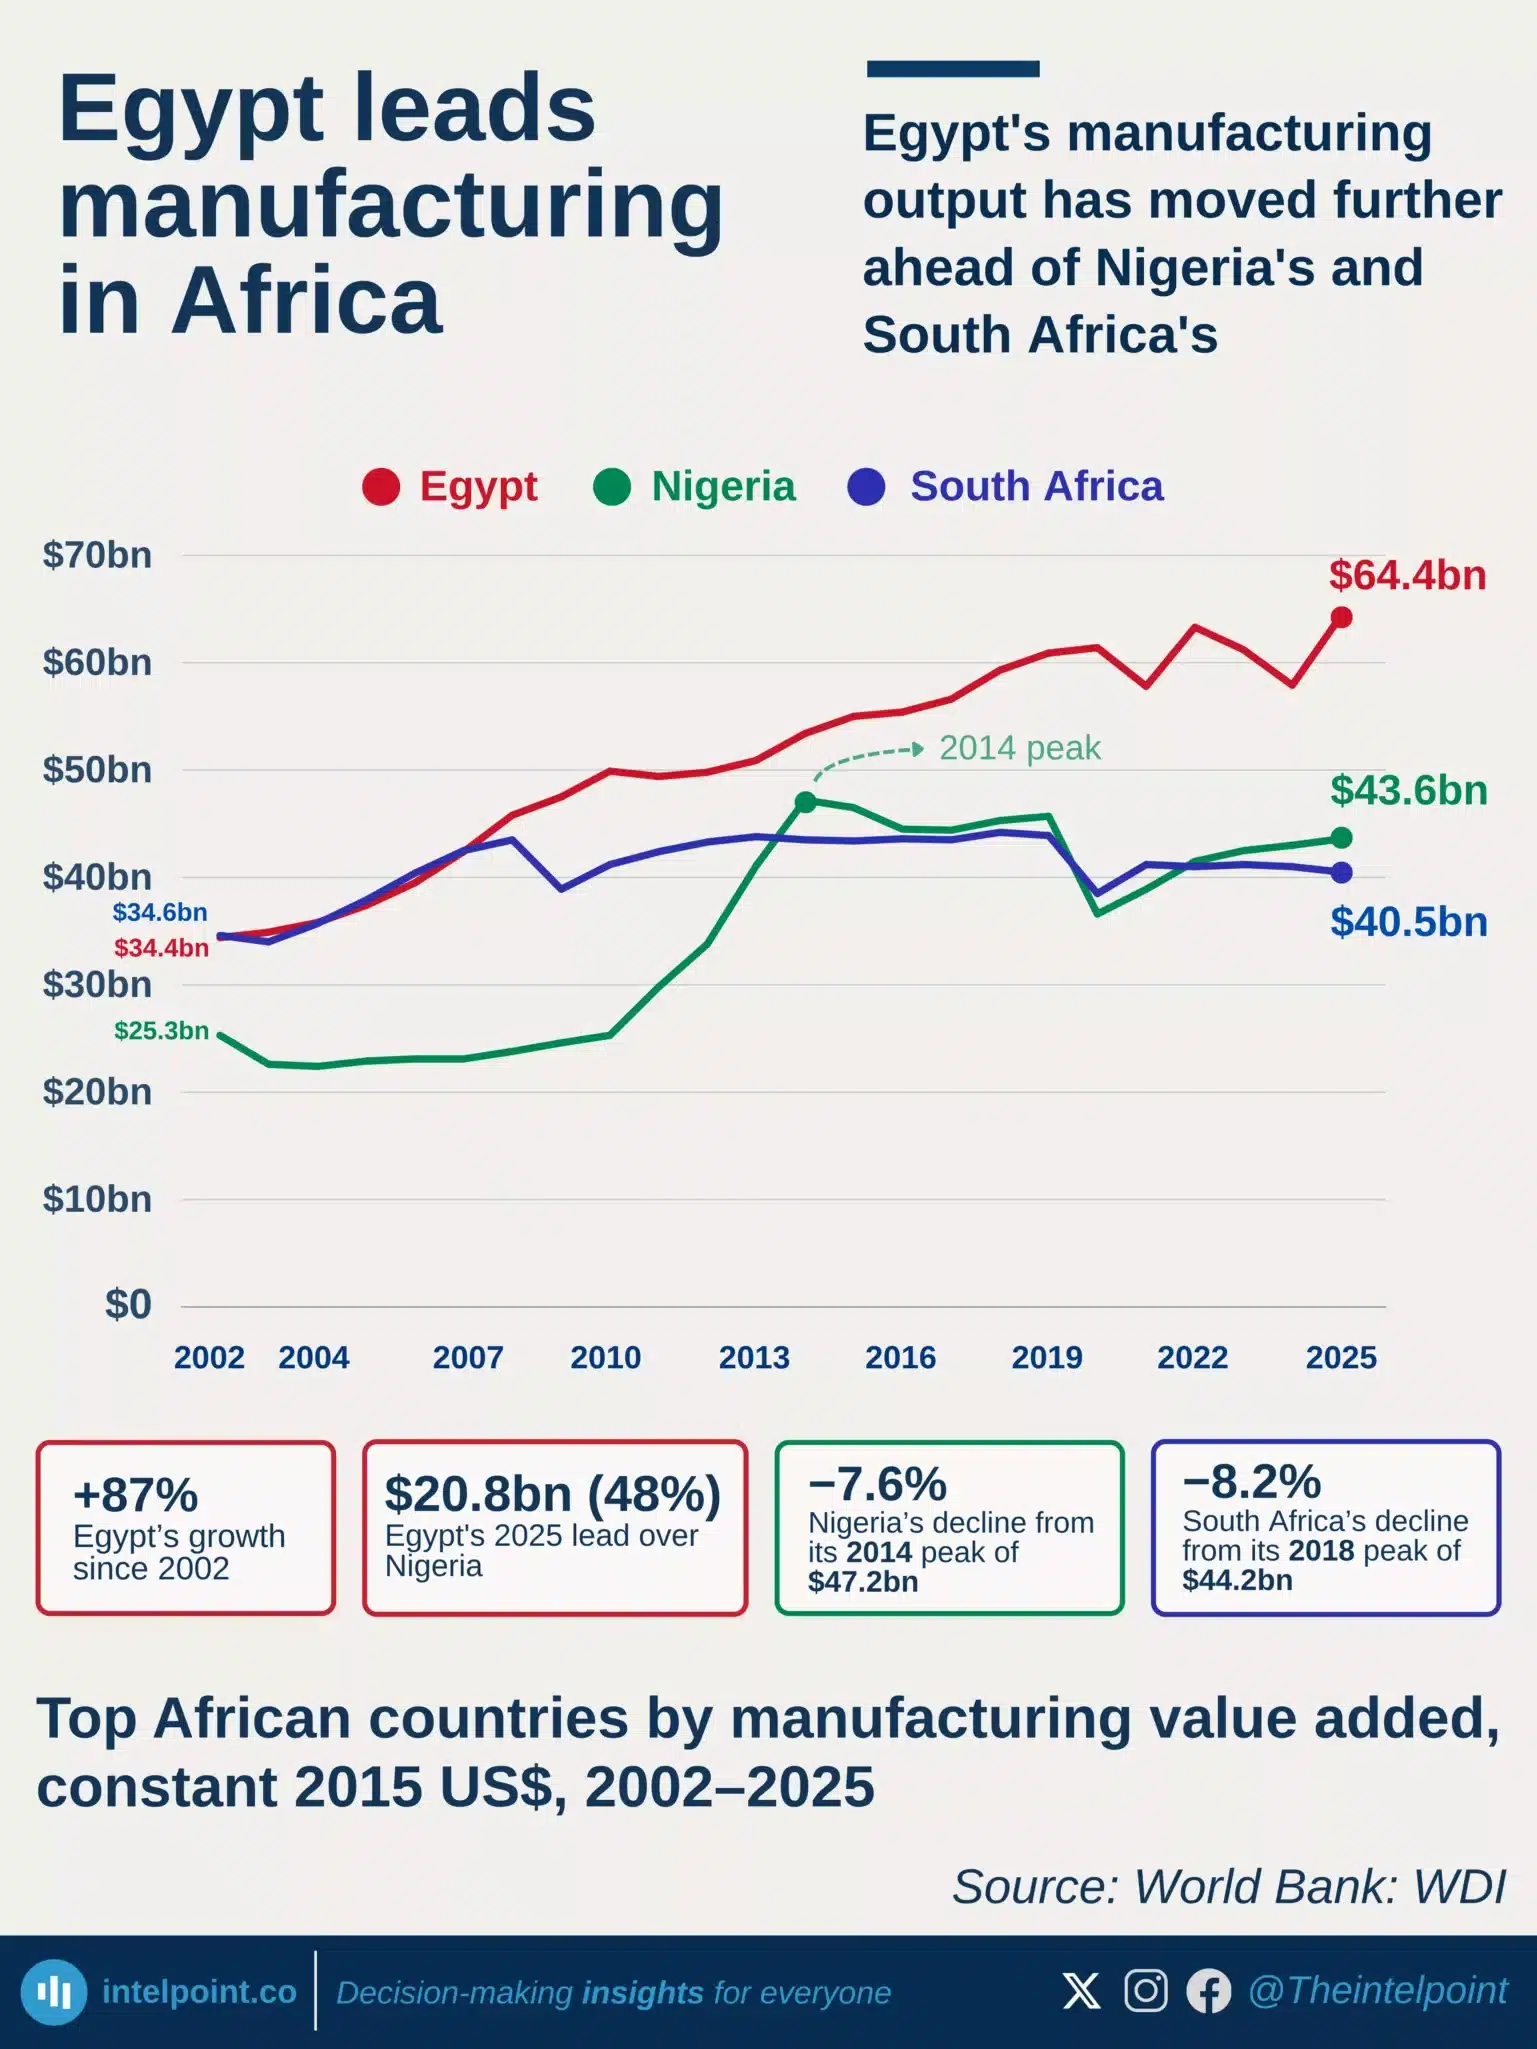
Egypt's manufacturing output has moved further ahead of Nigeria's and South Africa's
  • Egypt’s manufacturing value added reached $64.4 billion in 2025.
  • Egypt’s manufacturing value added increased 87% since 2002.
  • Nigeria’s manufacturing value added peaked at $47.2 billion in 2014.
  • Nigeria’s 2025 manufacturing value added was $43.6 billion, below its 2014 peak.
  • Nigeria was just $3.1 billion behind South Africa in 2025.
  • South Africa’s manufacturing value added peaked at $44.2 billion in 2018.
  • South Africa’s manufacturing value added fell to $40.5 billion in 2025.
  • Egypt recorded $20.8 billion more manufacturing value than Nigeria in 2025.

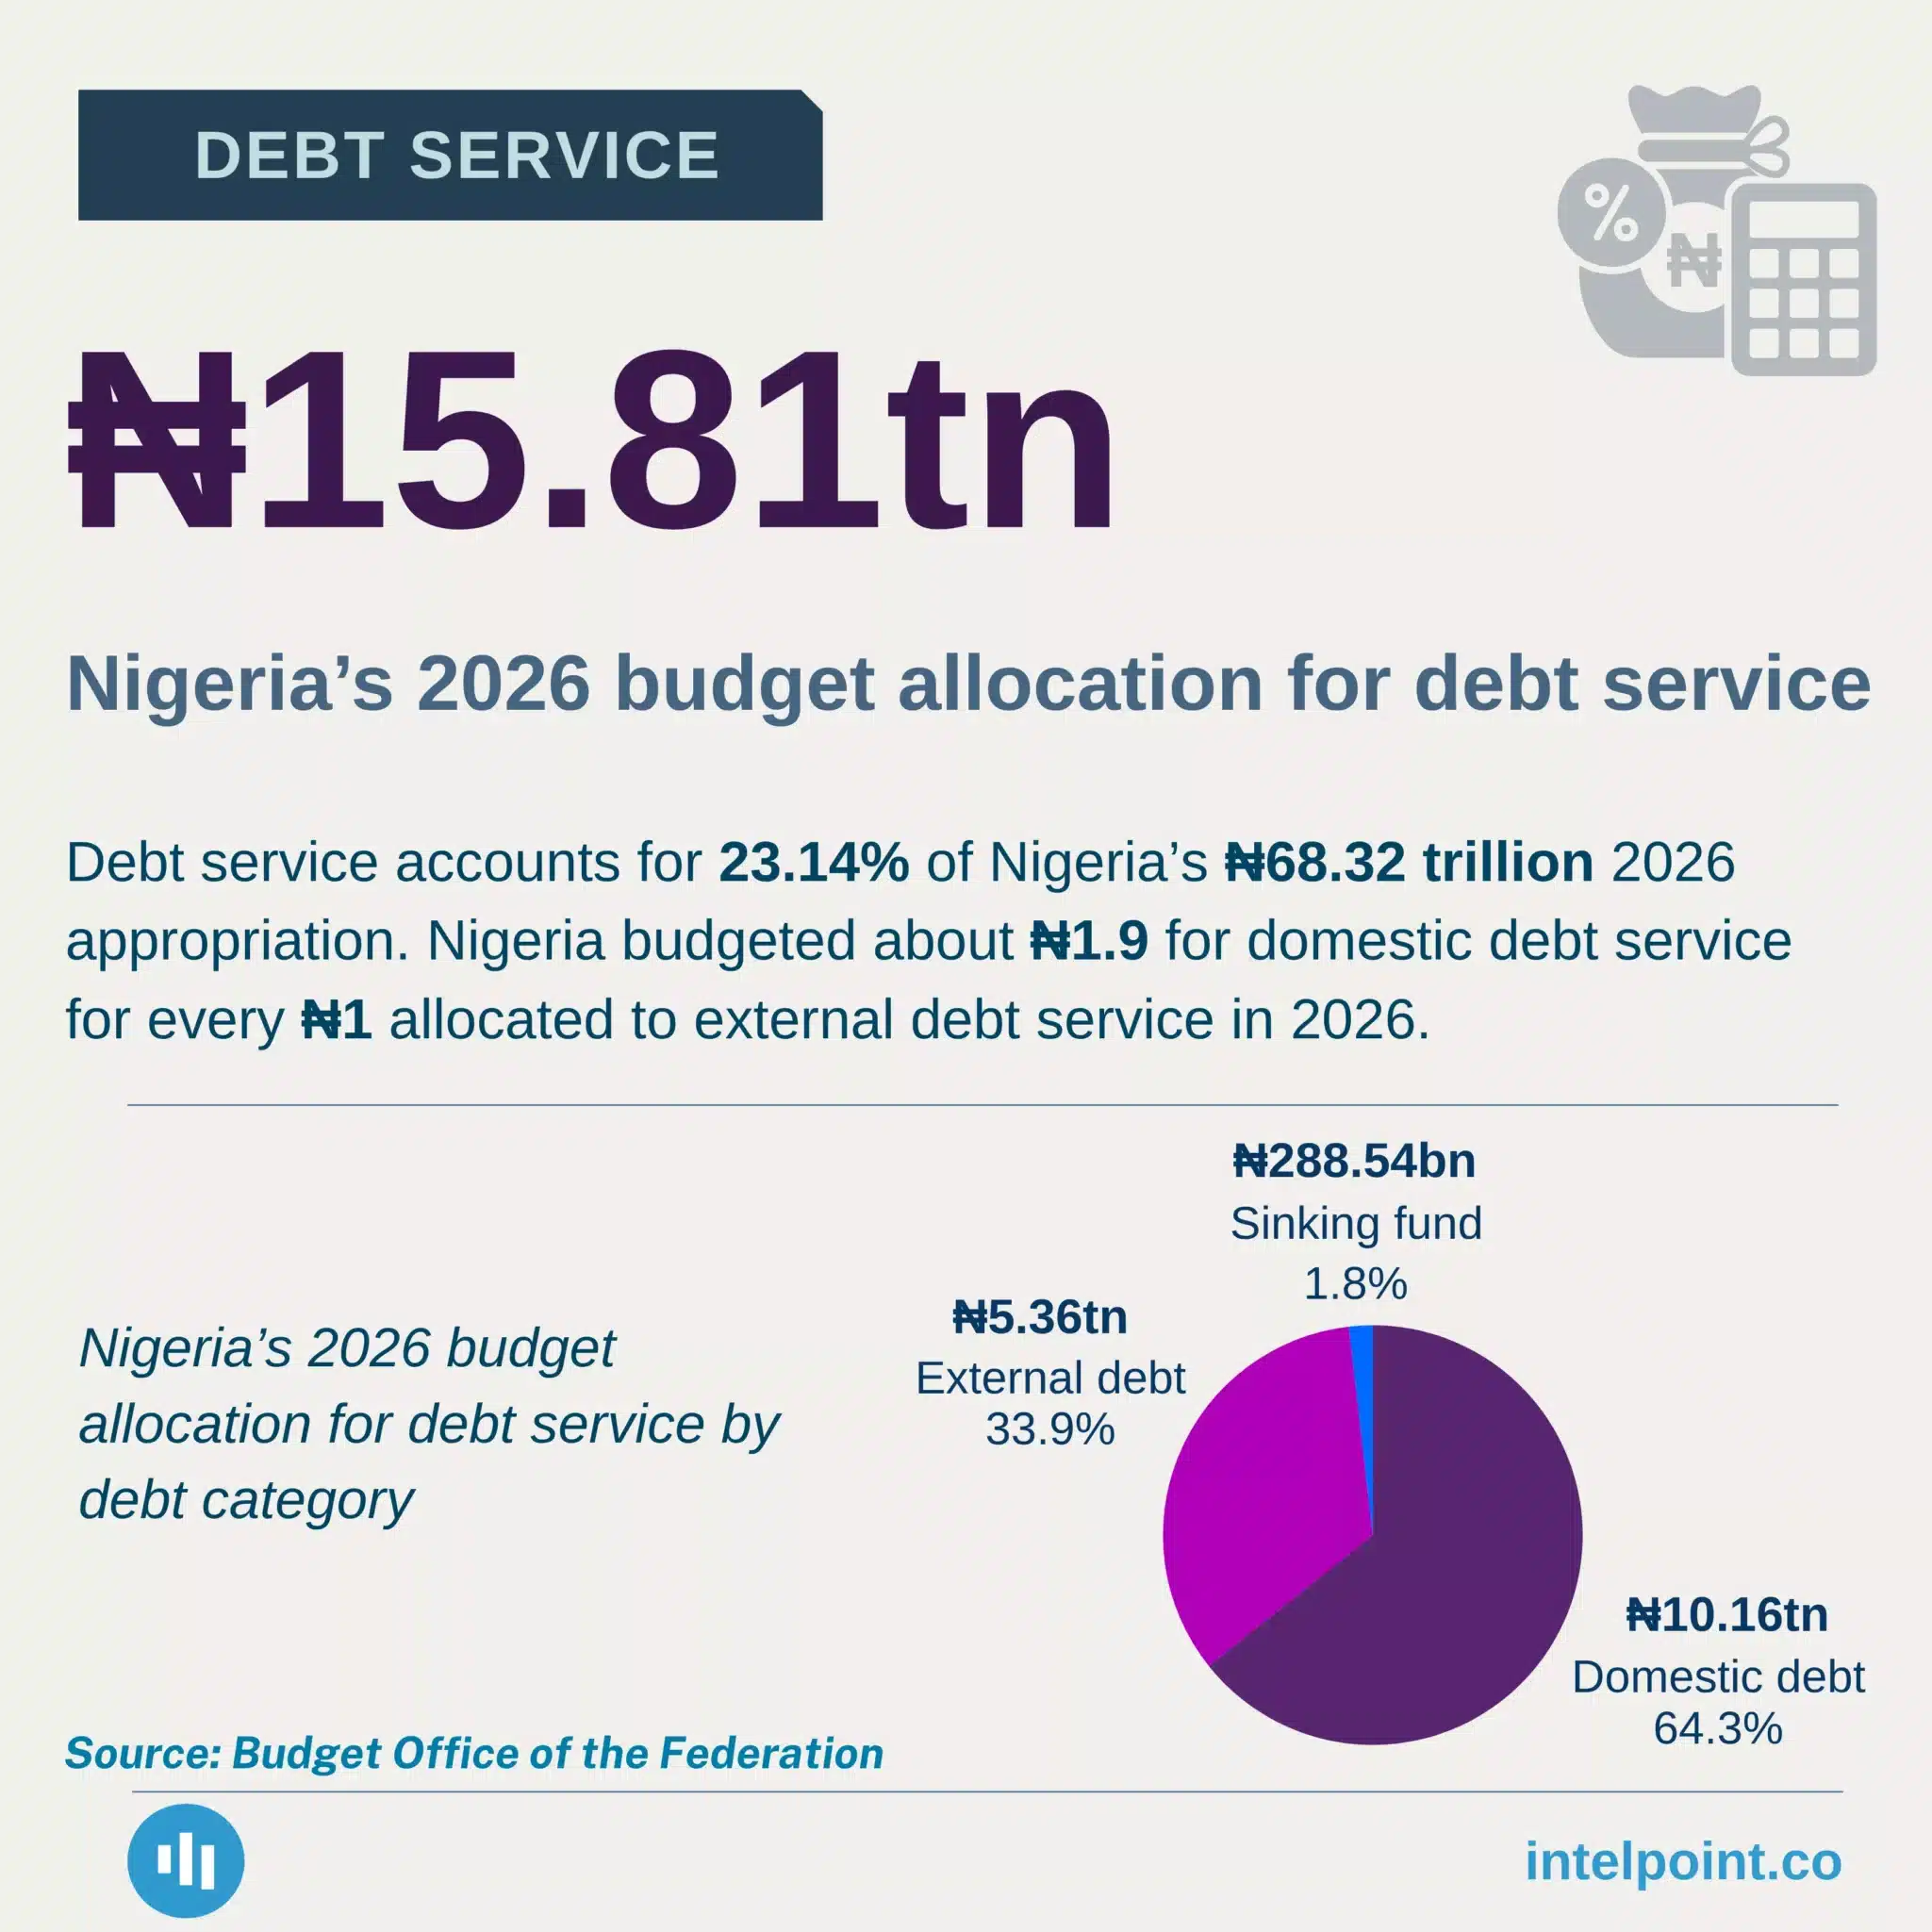
Debt service accounts for 23.14% of Nigeria’s ₦68.32 trillion 2026 appropriation
  • Debt service takes 23.14% of Nigeria’s 2026 budget.
  • Domestic debt service accounts for 64.3% of the debt-service allocation.
  • Domestic debt service is nearly twice the external debt-service allocation.
  • The sinking fund receives just 1.8% of the debt-service allocation.
  • Domestic debt service is more than 35 times the sinking-fund allocation.
  • Debt service totals ₦15.81 trillion in the 2026 budget.

POPULAR TOPICS
SIGN UP TO OUR NEWSLETTER
Get periodic updates about the African startup space, access to our reports, among others.
Subscribe Here
Subscription Form

A product of Techpoint Africa. All rights reserved