The South West got ₦1 back for every ₦3.60 in VAT, while the North West received ₦2.60 for every ₦1 contributed

Key takeaways

  • The South West generated ₦929.86B, over half of Nigeria’s total VAT, but received only ₦258.19B, amounting to ₦1 back for every ₦3.60 contributed.
  • The North West contributed just ₦68.05B but received ₦176.73B, meaning it got back ₦2.60 for every ₦1 generated.
  • The South South, the second-highest contributor at ₦364.99B, got back ₦171.18B, just ₦1 for every ₦2.13 generated.
  • The three southern zones together contributed ₦1.32 trillion in VAT, nearly 90% of the national total, but received less than half of it back.
  • Zones with the lowest generation (North East and South East) received 3 to 4 times their contributions.

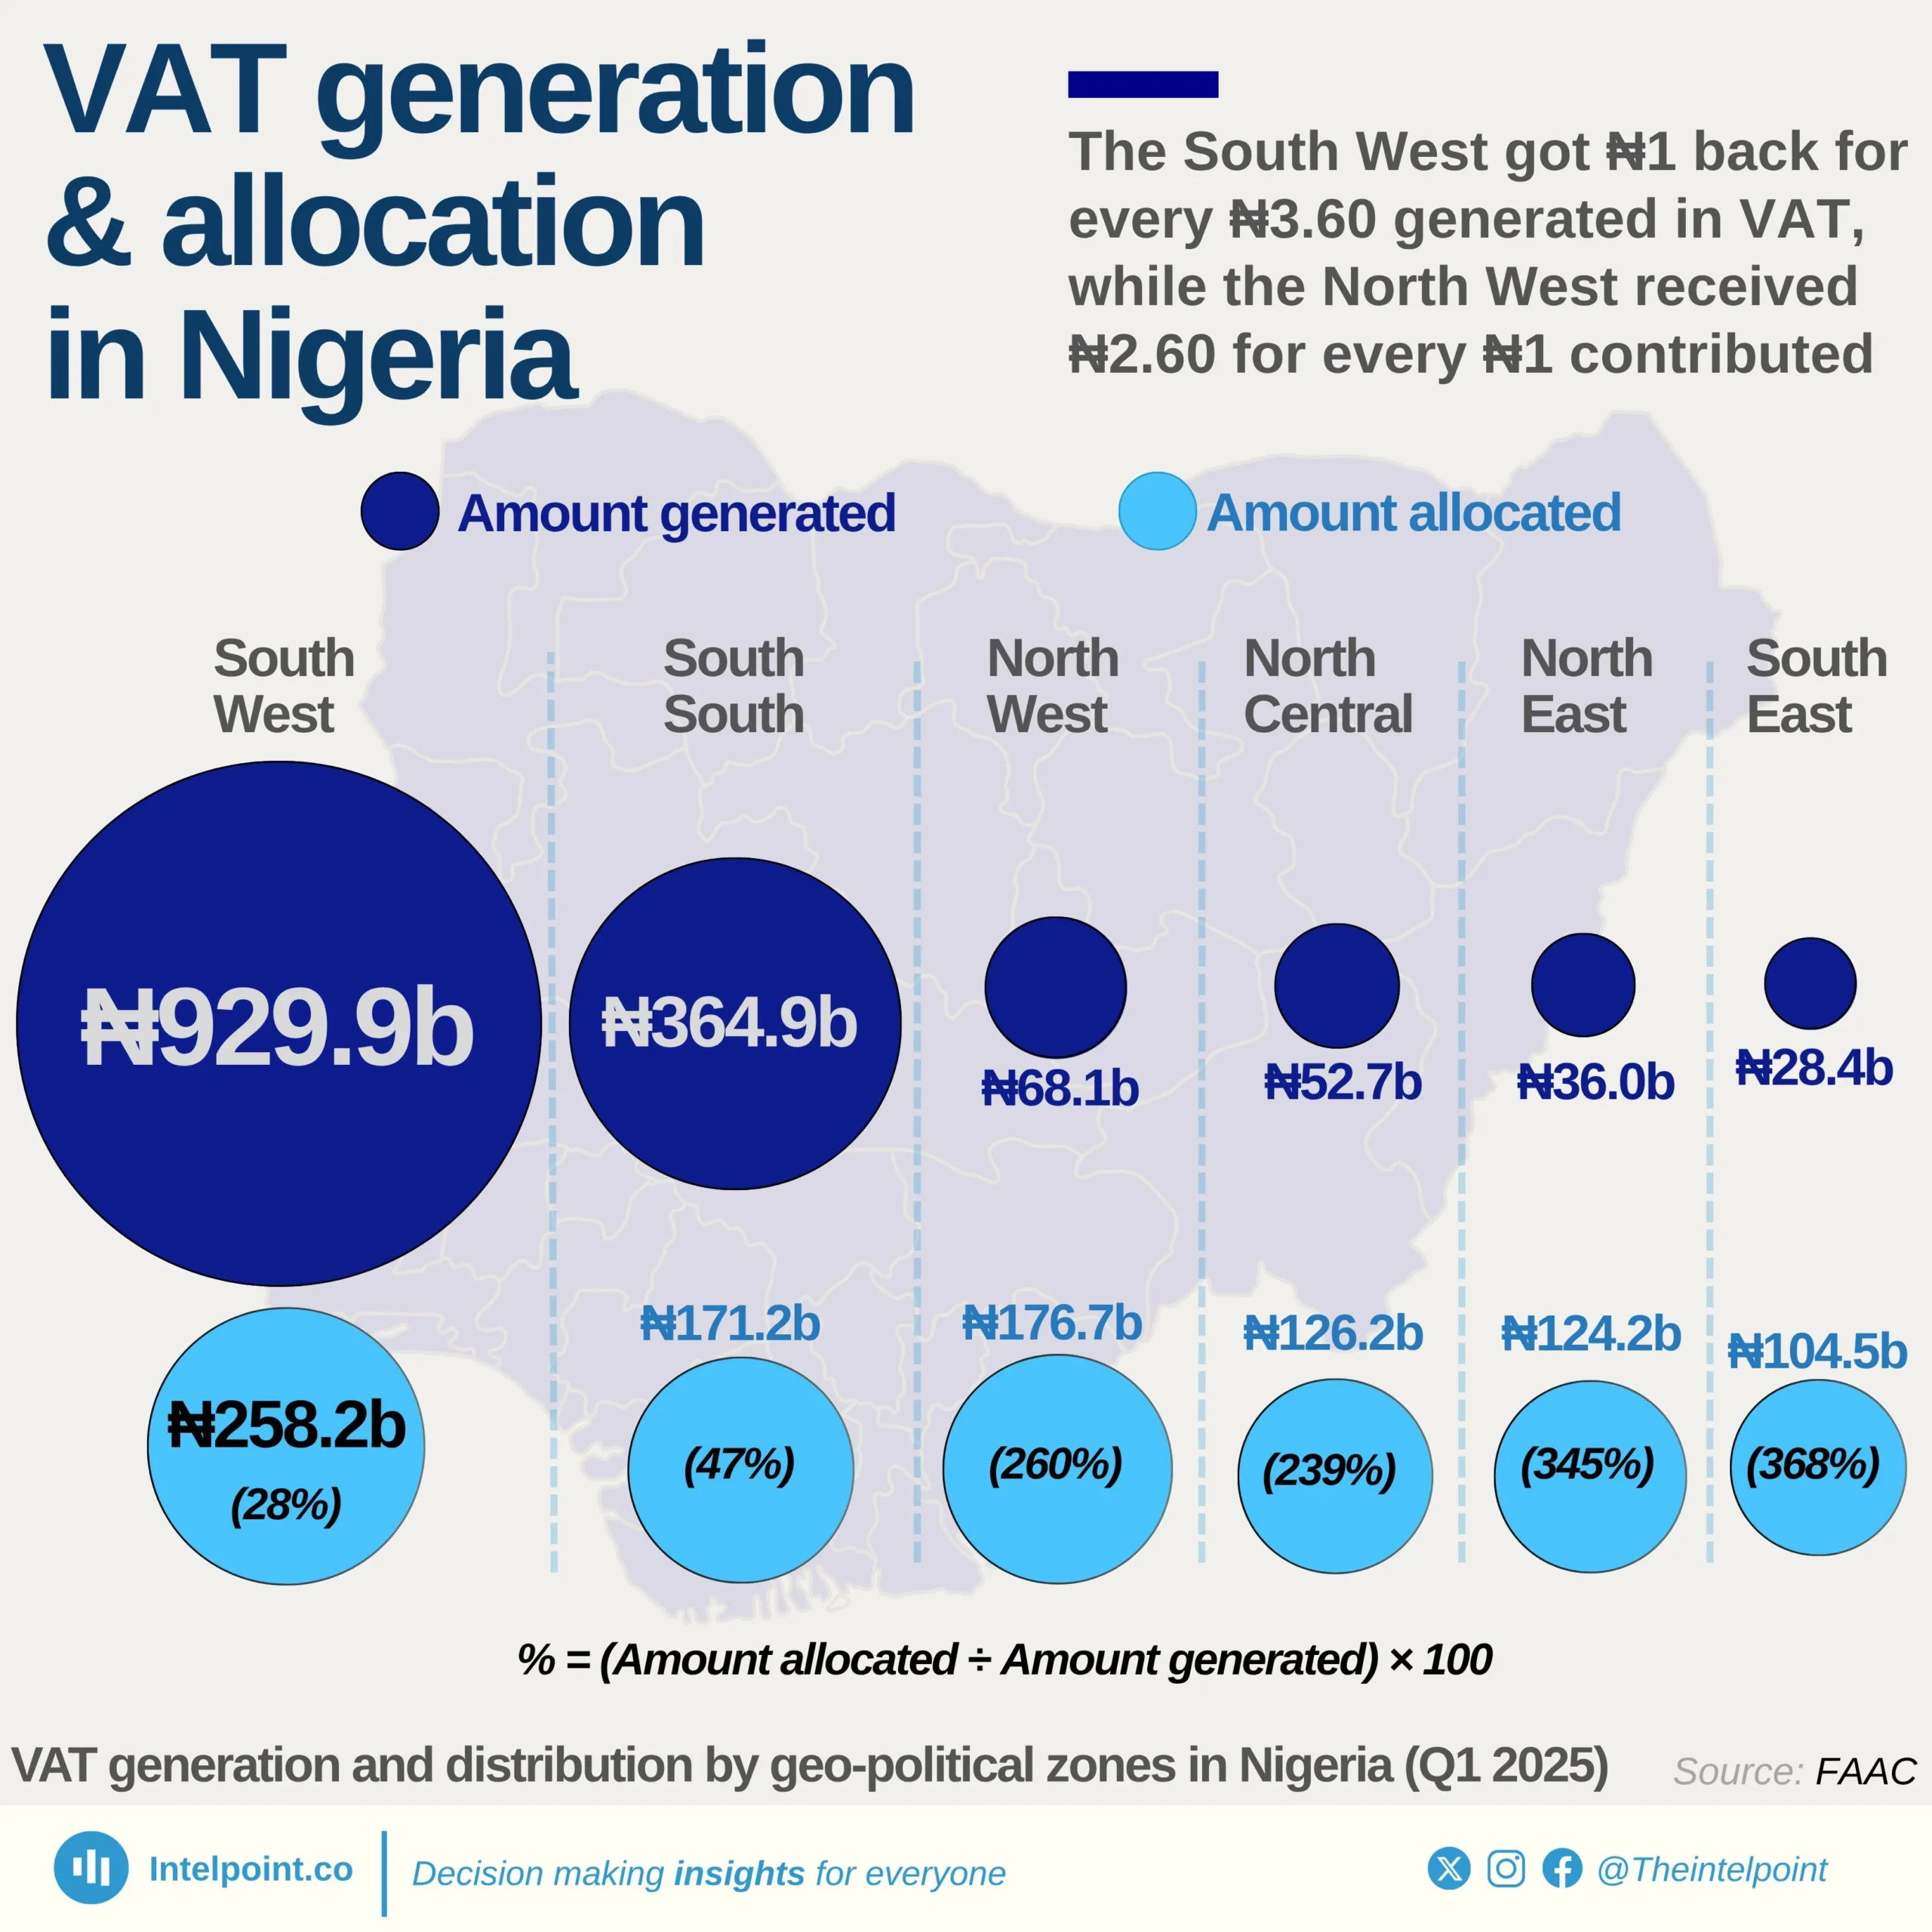
Nigeria’s VAT (Value Added Tax) records for Q1 2025 show distinct regional patterns in both revenue generation and allocation. The South West zone generated the highest VAT at ₦929.86 billion, more than twice the amount generated by the South South, which stood at ₦364.99 billion. The North West generated ₦68.05 billion, while the North Central, North East, and South East generated ₦52.69 billion, ₦36.04 billion, and ₦28.38 billion respectively.

On the allocation side, the South West received ₦258.19 billion, the South South ₦171.18 billion, and the North West ₦176.73 billion. The North Central and North East were allocated ₦126.17 billion and ₦124.22 billion respectively, while the South East received ₦104.50 billion.

Source:

Federation Account Allocation Committee

Period:

Q1 2025
HTML code to embed chart
Want a bespoke report?
Reach out
Tags
Related Insights

Nigeria’s public debt has soared since 2010, with domestic debt up 2,020% and external debt up 1,000% by mid 2025
  • Nigeria’s domestic debt jumped from ₦3.8 trillion in 2010 to ₦80.55 trillion by mid-2025.
  • Foreign debts increased from $4.27 billion in 2010 to $46.98 billion in 2025, reflecting growing reliance on external financing.
  • Debt accumulation surged notably after 2020, coinciding with pandemic spending, naira depreciation, and higher fiscal deficits.
  • The widening gap between revenue and debt service raises questions about Nigeria’s long-term debt sustainability.

Borno records lowest domestic debt in North-East Nigeria at ₦22.3 billion in Q2 2025
  • The six North-Eastern states collectively owe around ₦450 billion in domestic debt as of Q2 2025.
  • Borno State maintains the lowest debt in the region at ₦22.3 billion, showing signs of controlled borrowing amid post-conflict rebuilding.
  • Bauchi State has the highest domestic debt burden of ₦143.6 billion, accounting for about 31% of the region’s total.
  • The top three states, Bauchi, Taraba and Gombe, collectively account for more than two-thirds of the zone’s total subnational debt stock.

In just six months, Nigeria spent over $2.3 billion servicing external debts
  • Nigeria paid $816.3 million to the International Monetary Fund, accounting for over 35% of total external debt service payments.
  • Eurobond payments followed closely, with $687.8 million paid, reflecting Nigeria’s heavy reliance on commercial debt instruments.
  • Multilateral lenders like IDA and AfDB collectively received about $463 million, signalling continued exposure to concessional financing.
  • China’s share shrinking: Payments to Chinese lenders (EXIM + CDB) totalled $235.6 million, less than 11% of total outflows, suggesting reduced Chinese debt servicing in H1 2025.

Over 60% of Nigeria’s ₦1.7 trillion domestic debt service in Q2 2025 was spent on Federal Government Bonds
  • FGN bonds dominated: ₦1.07 trillion went to Federal Government Bonds, accounting for about 63% of total domestic debt servicing.
  • Treasury bills followed: Payments on NTBs reached ₦537.9 billion, making up roughly 31% of the total.
  • Sukuk and promissory notes together cost ₦90.8 billion, reflecting Nigeria’s mix of infrastructure and settlement instruments.
  • Green and savings bonds remained minimal, together below ₦5 billion, showing limited traction for retail and sustainability-focused debt.

93% of Nigeria's public debt is owed by the Federal Government
  • The Federal Government’s share of total public debt rose from 79.5% in 2019 to 92.6% in 2025.
  • States’ share has more than halved, from 20.5% to 7.4% in six years.
  • Total public debt grew from $83.9 billion to $99.7 billion, peaking at $113.4 billion in 2023.
  • Nigeria’s debt burden is increasingly concentrated at the centre, amplifying federal repayment risks and reducing fiscal independence for states.

Over 60% of Nigerians use crypto for savings and long-term investing
  • Wealth-building dominates motivation: 45.4% cite “active wealth building” as their primary motive, and an additional 21.8% cite “long-term financial security”.
  • Payments and utility are minor drivers: Only 3.3% report “daily utility” and 2.2% “digital commerce” as their chief motive for using crypto.
  • Hedging and cross-border flows matter: 8.7% use crypto for currency hedging, and 4.1% for cross-border payments, showing a dual role of investment plus international value flows.
  • Nigerian retail users treat crypto like a conventional financial instrument rather than only as a means of payment or speculation.

POPULAR TOPICS
SIGN UP TO OUR NEWSLETTER
Get periodic updates about the African startup space, access to our reports, among others.
Subscribe Here
Subscription Form

A product of Techpoint Africa. All rights reserved