South-west remitted ₦341.38B but received only ₦99.85B

Key Takeaways

  • South-West drives Nigeria’s VAT but gets little back. The region remitted ₦341.38B (53%) but received only ₦99.85B (29% return).
  • South-South remitted ₦121.84B but got ₦52.49B (43% return); Rivers alone gave ₦90.21B but got just ₦11.01B.
  • The North enjoyed the highest VAT gains, remitting ₦66.18B and receiving ₦161.11B (240% return); the North-West got ₦66.75B from ₦28.31B (235% return).
  • South-East and North-East got the biggest VAT boost. South-East: ₦10.94B remitted, ₦39.13B received (357.6% return); North-East: ₦14.94B remitted, ₦46.68B received (312.5% return).

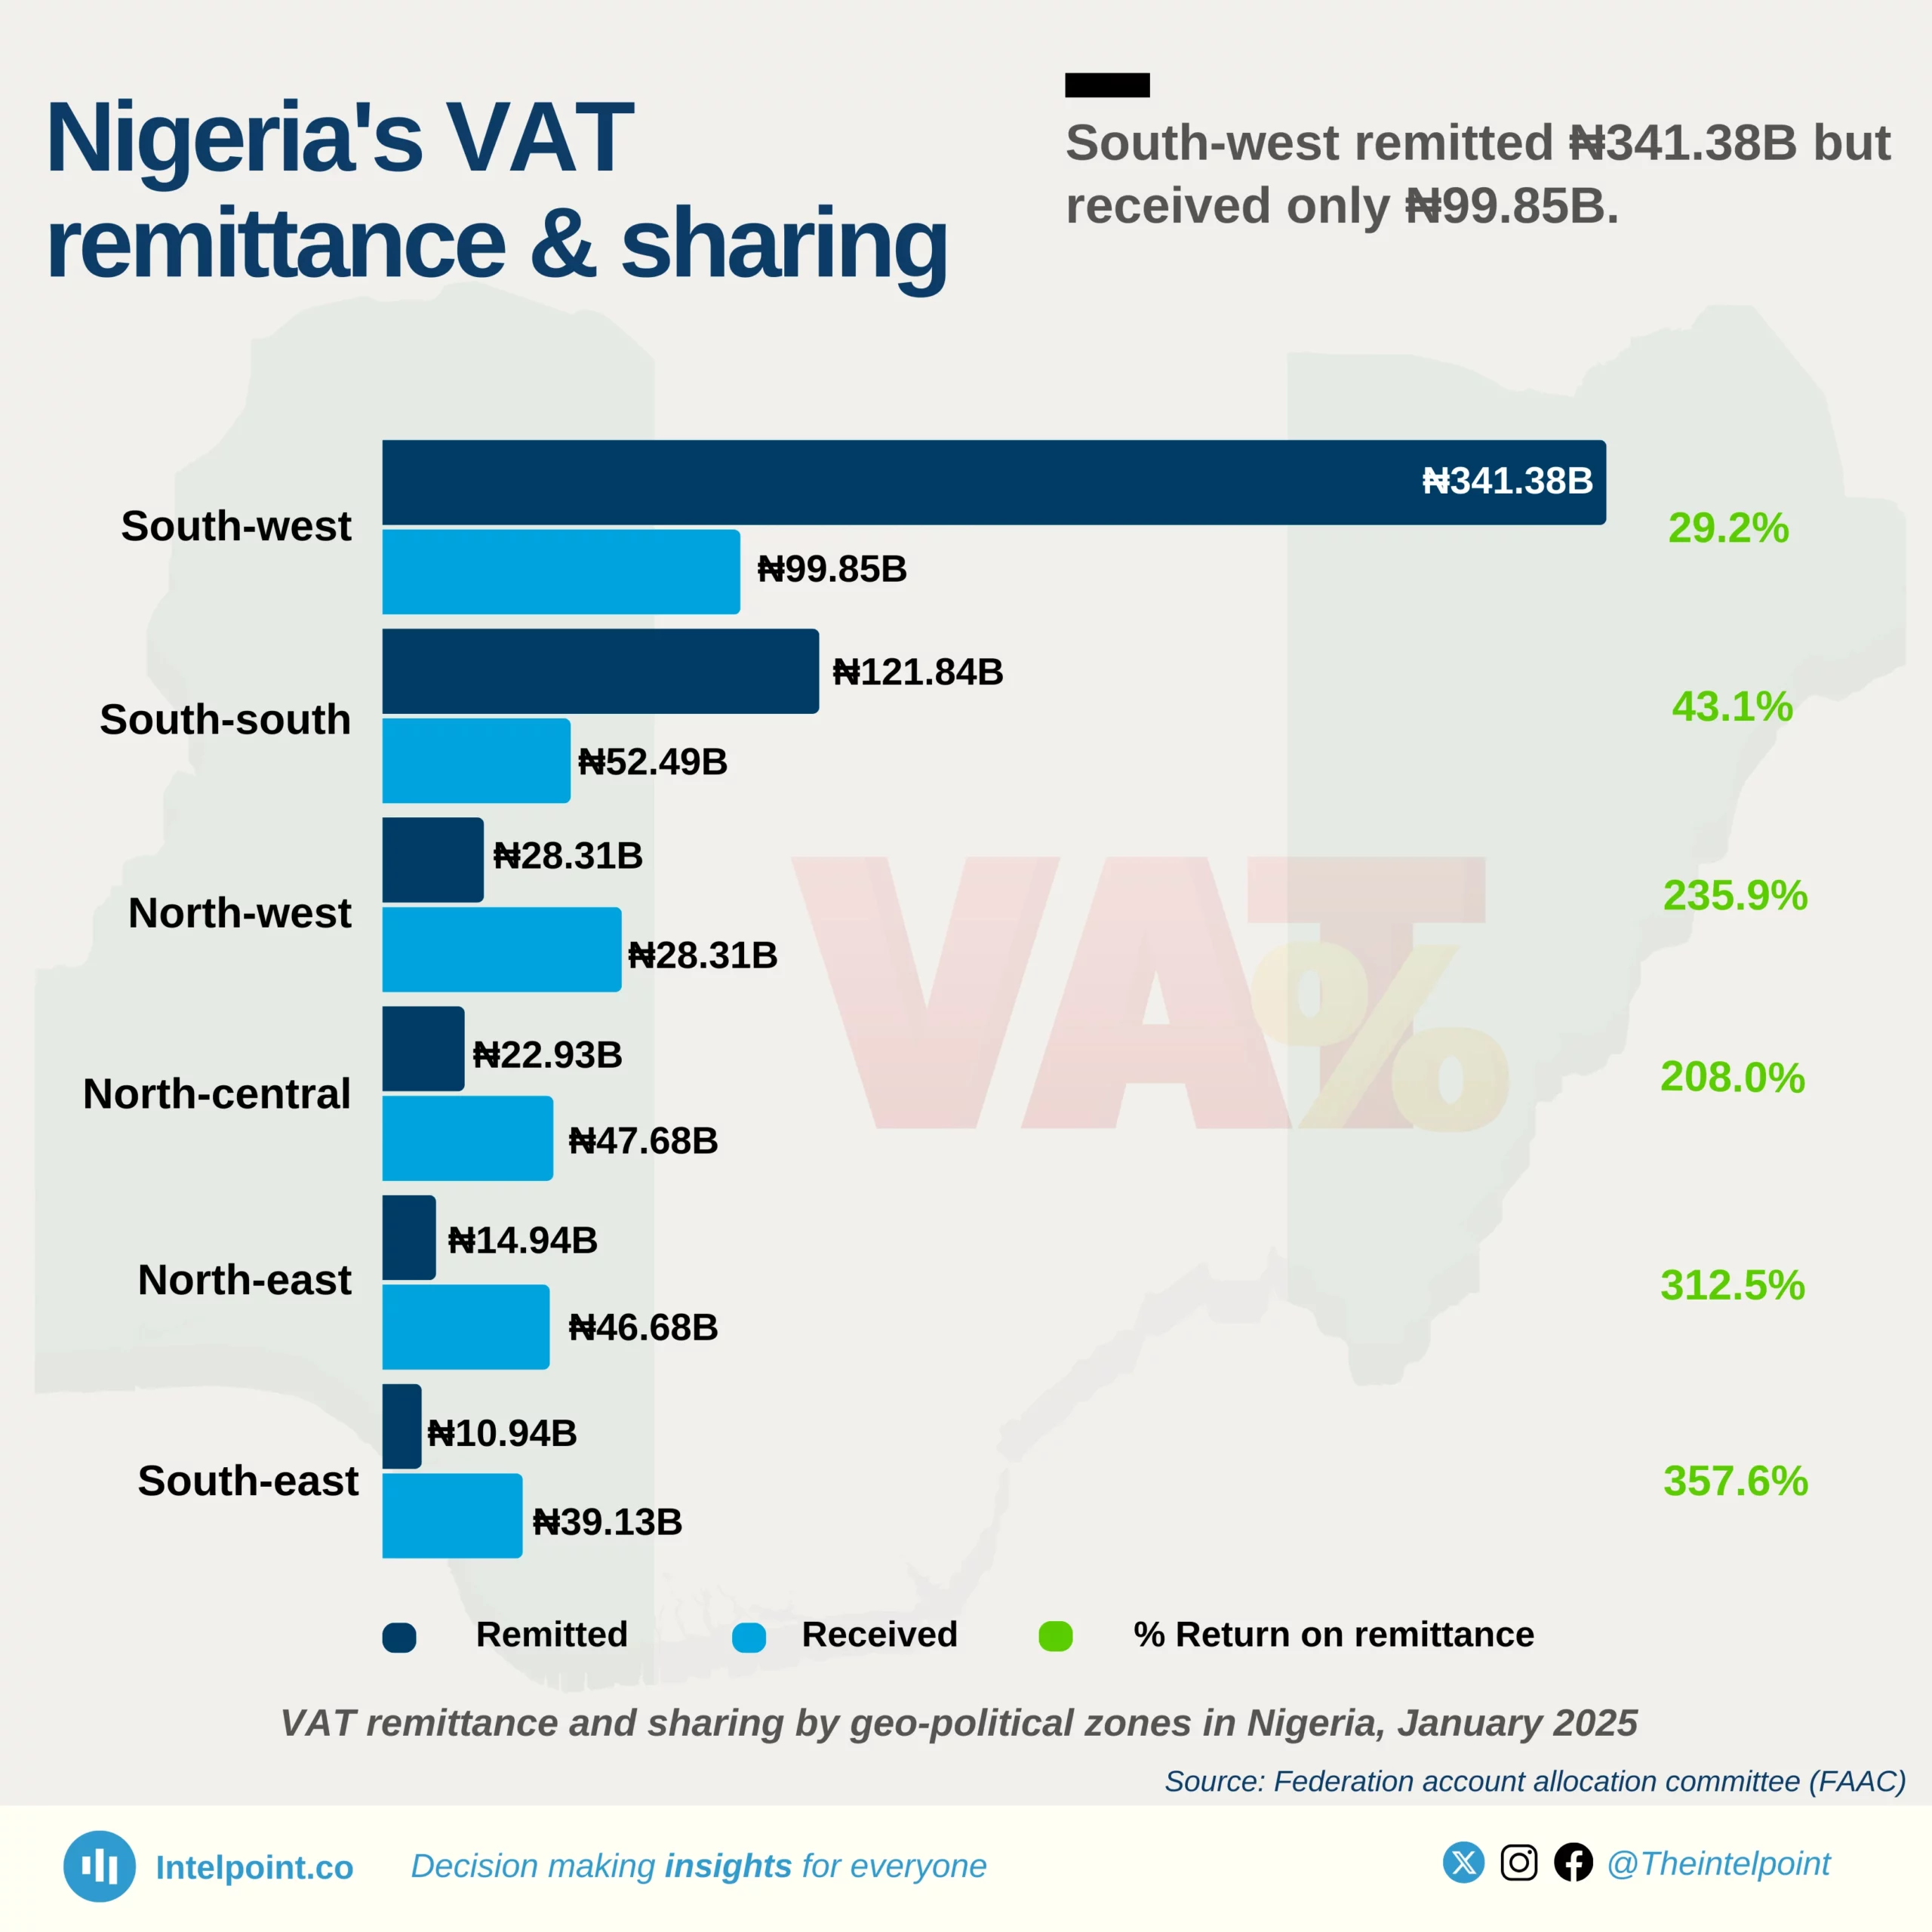
Nigeria's VAT system creates a deep financial imbalance across its regions. The South-West, despite remitting more than half of the nation’s VAT revenue (₦341.38B), receives only 29% of what it pays. Similarly, the South-South remitted significantly (₦121.84B), but most of it came from Rivers (₦90.21B), which barely got anything back.

Meanwhile, the three Northern zones collectively remitted ₦66.18B but received ₦161.11B, a staggering 240% return. This means that the North got back more than twice what it remitted, while the South-West and South-South are the biggest net losers.

Perhaps the most striking disparity is in the South-East, which remitted just ₦10.94B but received ₦39.13B, a return of over 357%. Similarly, the North-East enjoyed a 312% return, receiving ₦46.68B despite remitting just ₦14.94B.

This VAT redistribution formula favours lower-contributing regions while heavily taxing high-revenue states, raising critical questions about fairness and sustainability in Nigeria's revenue-sharing model.

Source:

Federal account allocation committee (FAAC)

Period:

January 2025
HTML code to embed chart
Want a bespoke report?
Reach out
Tags
Related Insights

Borno records lowest domestic debt in North-East Nigeria at ₦22.3 billion in Q2 2025
  • The six North-Eastern states collectively owe around ₦450 billion in domestic debt as of Q2 2025.
  • Borno State maintains the lowest debt in the region at ₦22.3 billion, showing signs of controlled borrowing amid post-conflict rebuilding.
  • Bauchi State has the highest domestic debt burden of ₦143.6 billion, accounting for about 31% of the region’s total.
  • The top three states, Bauchi, Taraba and Gombe, collectively account for more than two-thirds of the zone’s total subnational debt stock.

In just six months, Nigeria spent over $2.3 billion servicing external debts
  • Nigeria paid $816.3 million to the International Monetary Fund, accounting for over 35% of total external debt service payments.
  • Eurobond payments followed closely, with $687.8 million paid, reflecting Nigeria’s heavy reliance on commercial debt instruments.
  • Multilateral lenders like IDA and AfDB collectively received about $463 million, signalling continued exposure to concessional financing.
  • China’s share shrinking: Payments to Chinese lenders (EXIM + CDB) totalled $235.6 million, less than 11% of total outflows, suggesting reduced Chinese debt servicing in H1 2025.

Over 60% of Nigeria’s ₦1.7 trillion domestic debt service in Q2 2025 was spent on Federal Government Bonds
  • FGN bonds dominated: ₦1.07 trillion went to Federal Government Bonds, accounting for about 63% of total domestic debt servicing.
  • Treasury bills followed: Payments on NTBs reached ₦537.9 billion, making up roughly 31% of the total.
  • Sukuk and promissory notes together cost ₦90.8 billion, reflecting Nigeria’s mix of infrastructure and settlement instruments.
  • Green and savings bonds remained minimal, together below ₦5 billion, showing limited traction for retail and sustainability-focused debt.

93% of Nigeria's public debt is owed by the Federal Government
  • The Federal Government’s share of total public debt rose from 79.5% in 2019 to 92.6% in 2025.
  • States’ share has more than halved, from 20.5% to 7.4% in six years.
  • Total public debt grew from $83.9 billion to $99.7 billion, peaking at $113.4 billion in 2023.
  • Nigeria’s debt burden is increasingly concentrated at the centre, amplifying federal repayment risks and reducing fiscal independence for states.

Over 60% of Nigerians use crypto for savings and long-term investing
  • Wealth-building dominates motivation: 45.4% cite “active wealth building” as their primary motive, and an additional 21.8% cite “long-term financial security”.
  • Payments and utility are minor drivers: Only 3.3% report “daily utility” and 2.2% “digital commerce” as their chief motive for using crypto.
  • Hedging and cross-border flows matter: 8.7% use crypto for currency hedging, and 4.1% for cross-border payments, showing a dual role of investment plus international value flows.
  • Nigerian retail users treat crypto like a conventional financial instrument rather than only as a means of payment or speculation.

Over 65% of surveyed Nigerian crypto users transact below ₦50,000; less than 3% move above ₦1 million
  • Nearly two-thirds (67%) of all crypto transactions in Nigeria are below ₦50,000, reflecting widespread use among everyday retail users.
  • The ₦15,000–₦25,000 band (28.2%) is the single largest group, showing consistent, small-scale engagement rather than high-value speculation.
  • Around 25% of users transact between ₦50,000 and ₦250,000, suggesting a growing middle class of more confident, mid-level investors.
  • Less than 3% of users transact above ₦1 million, confirming that Nigeria’s crypto market remains primarily retail-driven, not institutional or high-net-worth.

POPULAR TOPICS
SIGN UP TO OUR NEWSLETTER
Get periodic updates about the African startup space, access to our reports, among others.
Subscribe Here
Subscription Form

A product of Techpoint Africa. All rights reserved