South Africa’s GDP per capita has grown in 21 of the past 24 years, climbing to a record high in 2024

Key Takeaways

  • South Africa’s GDP per capita rose from $440 in 2000 to an all-time high of $2,692 in 2024.
  • Growth was relatively steady in the 2000s, with notable jumps after 2006 and again in the post-pandemic years.
  • Despite dips in 2008 (global financial crisis) and 2020 (COVID-19 shock), the economy showed resilience with quick rebounds.
  • By 2024, South Africa achieved its strongest per capita GDP on record, cementing its role as one of Africa’s leading middle-income economies.
  • The country recorded growth in 21 of the past 24 years.

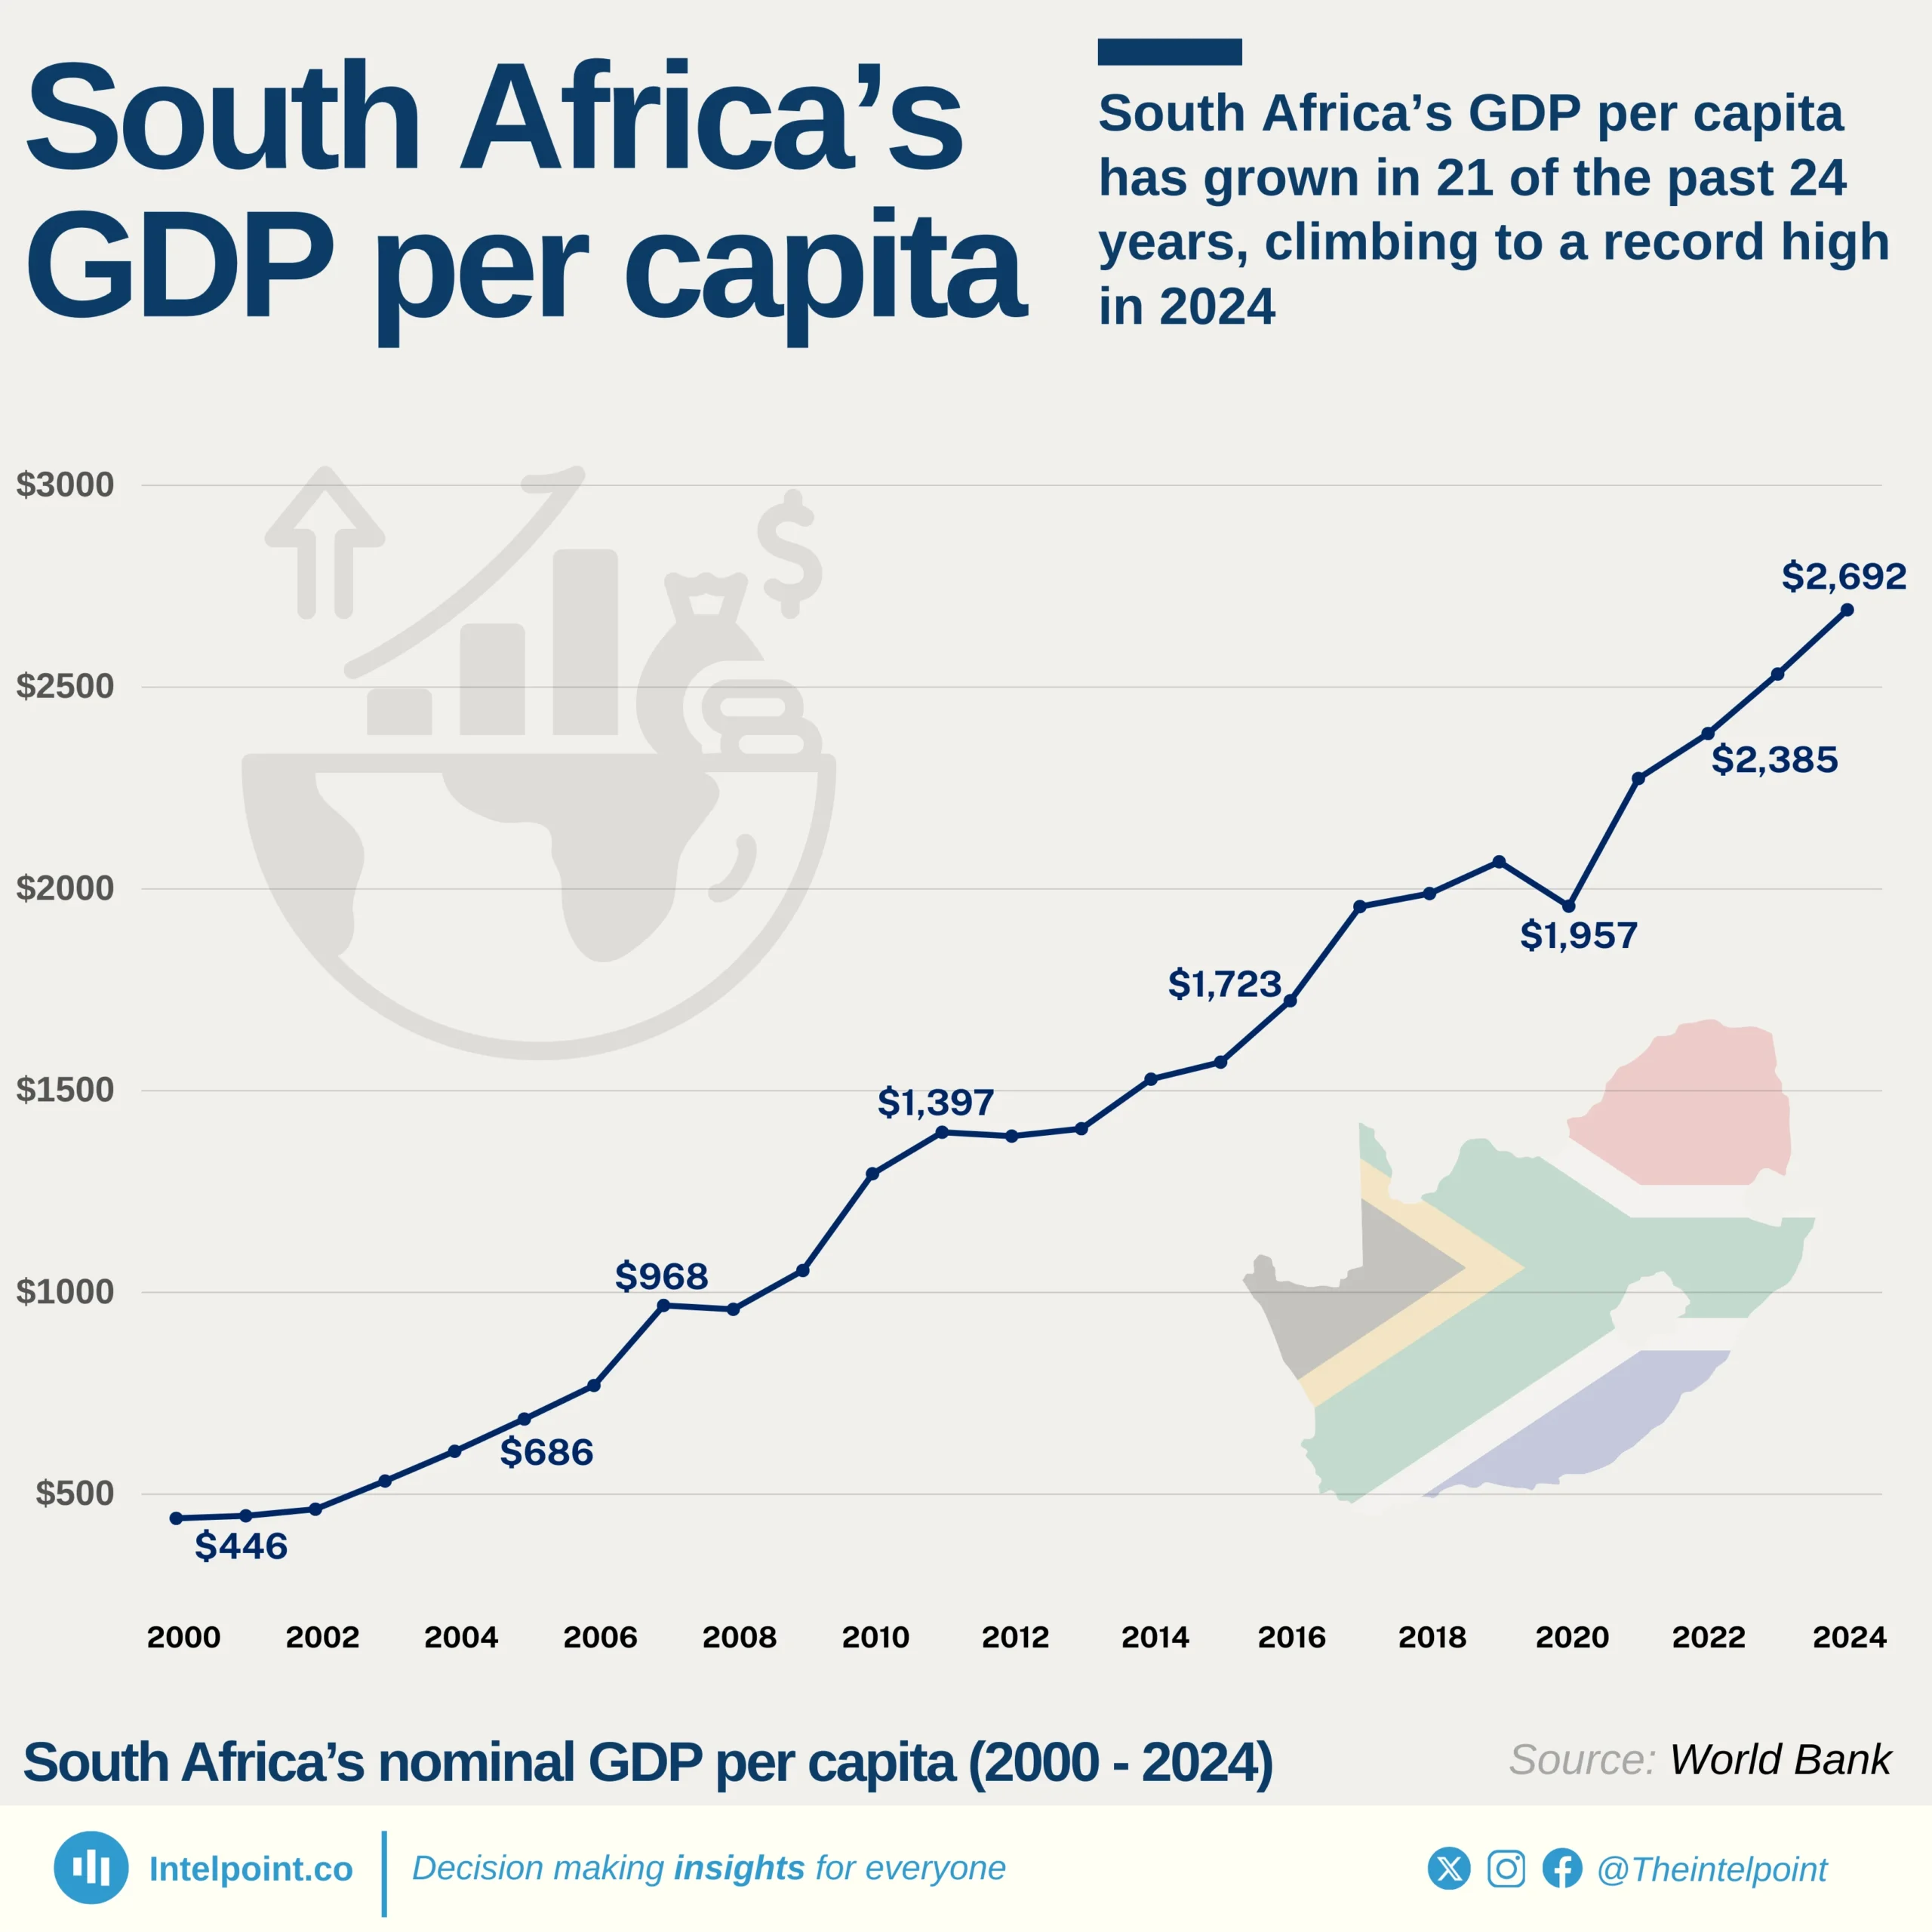
South Africa’s GDP per capita has followed a strong, long-term, upward trend, expanding more than fivefold from $440 in 2000 to a record $2,692 in 2024. The 2000s marked a period of steady growth, briefly interrupted by the 2008 global financial crisis, after which the economy regained momentum.

A second setback came in 2020 during the pandemic, but recovery was swift, with per capita income climbing sharply in the early 2020s. By 2024, South Africa not only reached its highest level on record but also reinforced its position as one of Africa’s top three economies by per capita output, reflecting structural resilience and gradual progress despite recurring global and domestic headwinds.

Source:

World Bank

Period:

2000 - 2024
HTML code to embed chart
Want a bespoke report?
Reach out
Tags
Related Insights

Ghana's GDP
  • From 2013 to 2024, the services sector has consistently dominated Ghana’s GDP, while agriculture has remained the smallest sector.
  • A weak agriculture sector can make Ghana more dependent on food imports.
  • Agriculture’s stagnation reduces its role as a labour buffer.

Nigeria’s slice of Africa’s economy since independence: From a peak of 31% to 7% in 2024
  • At independence in 1960, Nigeria contributed about 10% of Africa’s GDP, establishing itself early as one of the continent’s largest economies.
  • Nigeria’s share peaked at 31% in 1981 during the oil boom, highlighting the dramatic impact of natural resources on the economy.
  • Between the mid-1980s and 2000s, Nigeria’s share fluctuated significantly, dropping to 9.2% in 1999 due to political instability, economic mismanagement, and external shocks.
  • By 2024, Nigeria’s share fell to 7.1%, despite a GDP of $187.8 billion, showing slower relative growth compared to other African economies and the ongoing need for economic diversification.
  • This share reflects Nigeria’s relative position in Africa’s economy over time, showing how it moved in relation to the growth of the rest of the continent.

Trade and agriculture led Nigeria’s ₦51.20 trillion economy in Q2 2025, as oil’s share remained modest
  • Trade contributed 18.28%, making it the largest sector in Q2 2025's GDP.
  • Crop production followed with 17.8%, underscoring agriculture’s central role.
  • Oil and gas added just 4.05%, highlighting its shrinking share compared to non-oil sectors.
  • Real estate and telecoms reinforced the growing strength of services in the Nigerian economy.

Morocco’s GDP per capita has more than doubled since 2000, reaching a new high ($3,993) in 2024
  • Morocco’s GDP per capita has shown a fluctuating pattern in the last 25 years, with periods of steady growth and also fall.
  • The years 2003–2008 stand out as a high-growth phase, with GDP per capita rising rapidly from $1,941.9 to $3,183.2.
  • In 2021, a dramatic 15.9% rebound took GDP per capita up to $3,785.9.
  • In 2024, nominal GDP per capita stood at $3,993.4.
  • The last 25 years depict a more than twofold increase in Morocco’s GDP per capita, moving from $1,499.1 to $3,993.4.

Algeria’s GDP per capita has risen four straight years since 2020, edging closer to its 2014 oil-driven peak
  • Algeria’s GDP per capita more than tripled in 25 years, rising from $1,772.9 in 2000 to $5,631.2 in 2024.
  • The 2000s boom saw rapid growth, peaking at $5,180.9 in 2008, fuelled by high oil and gas prices.
  • Between 2014 and 2016, GDP per capita fell from $6,094.7 to $4,425.0, reflecting oil price collapses and domestic fiscal strain.
  • After pandemic-era lows in 2020 ($3,743.5), Algeria rebounded to its second-highest level on record in 2024 ($5,631.2), regaining its regional standing.

Egypt’s GDP per capita has more than doubled since 2000, but has fallen sharply since its 2022 peak
  • Egypt’s GDP per capita grew from $1,366 in 2000 to $3,339 in 2024, a 144% increase over 25 years.
  • The economy peaked at $4,233 in 2022, marking the highest point in the series before a two-year decline.
  • Sustained growth was driven by the 2000s and 2010s, with resilience after the 2008 financial crisis and Arab Spring disruptions.
  • The dip after 2022 reflects external pressures, currency adjustments, and inflationary challenges, though per capita levels remain well above early 2000s baselines.

POPULAR TOPICS
SIGN UP TO OUR NEWSLETTER
Get periodic updates about the African startup space, access to our reports, among others.
Subscribe Here
Subscription Form

A product of Techpoint Africa. All rights reserved