South Africa leads as Africa’s digitally delivered services exports hit $41.3 billion in 2024, less than 1 percent of the world total

  • Africa exported $41.3 billion in digital services in 2024, less than 1 percent of the world total.
  • South Africa was the continent’s top exporter with $7.05 billion.
  • Morocco ($6.74 billion) and Ghana ($5.18 billion) followed closely.
  • Egypt ($4.03 billion) and Mauritius ($3.53 billion) also ranked among the top five.
  • The top five countries together made up about two-thirds of Africa’s exports.

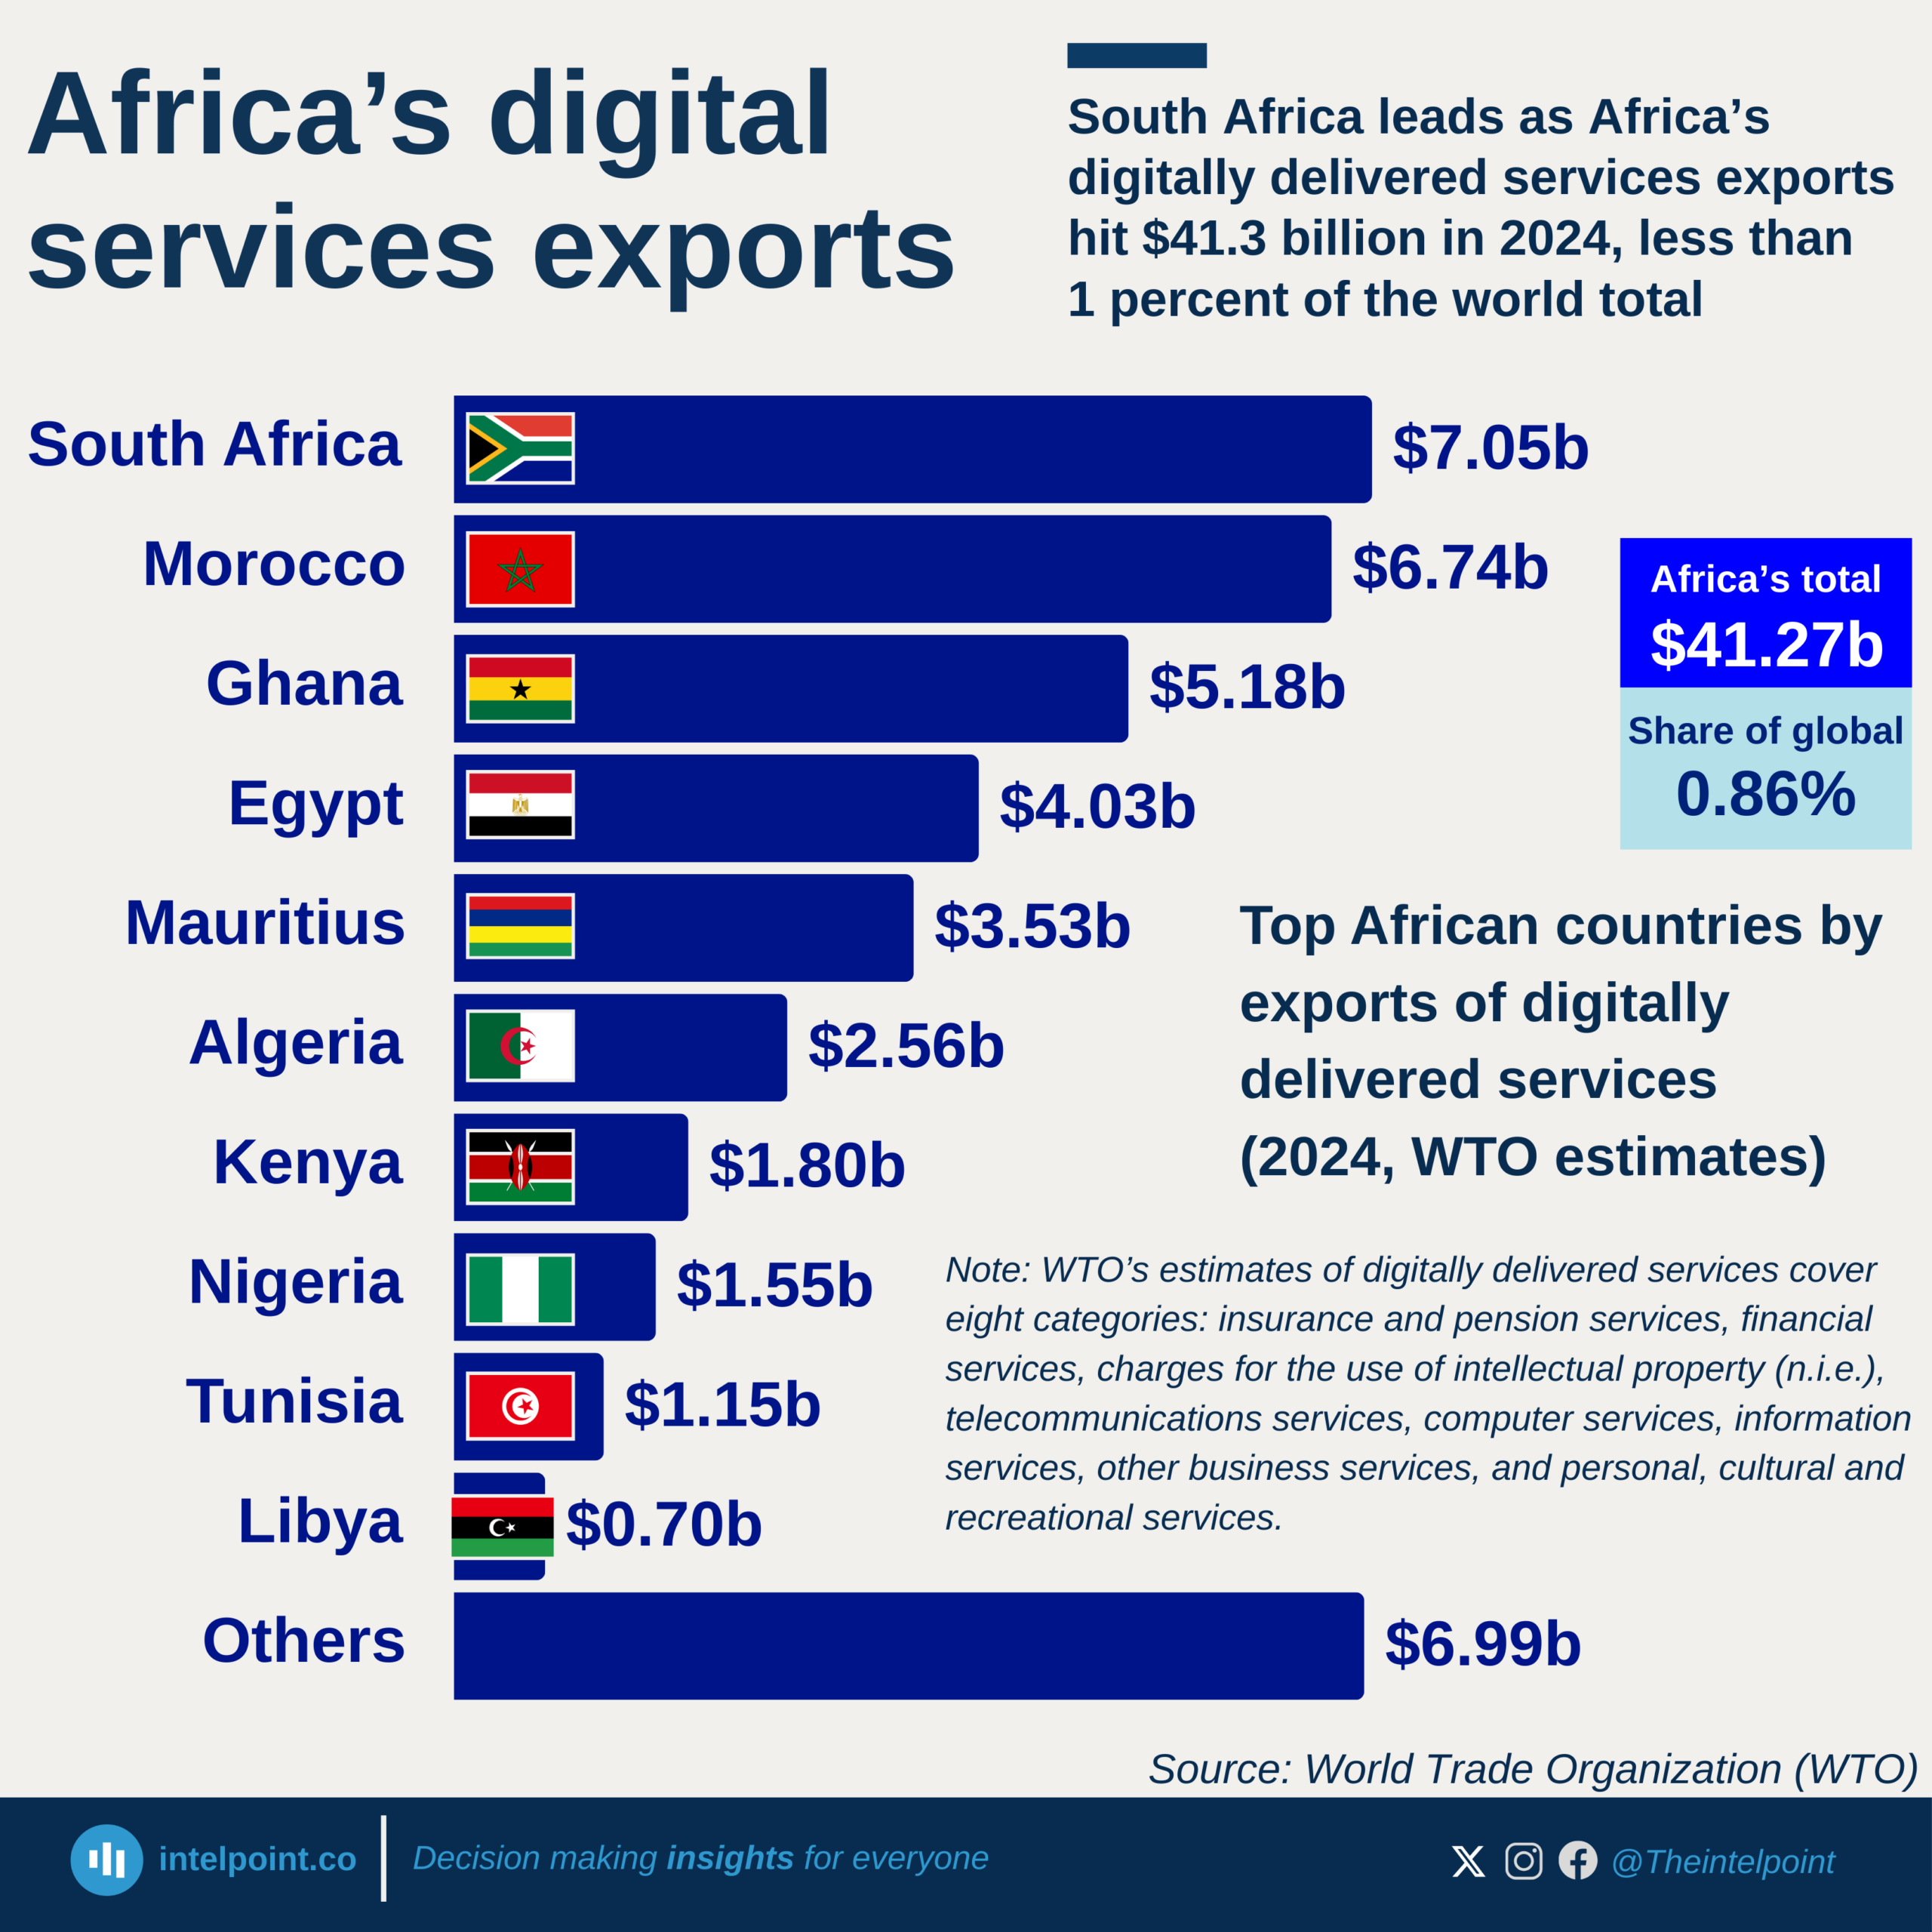
In 2024, Africa exported an estimated $41.27 billion in digitally delivered services compared to a global total of $4.78 trillion, leaving the continent with only 0.9 percent of the market.

South Africa and Morocco led the region, each above $6 billion, followed closely by Ghana at $5.2 billion. Egypt and Mauritius also featured strongly. Together, these five countries made up nearly two-thirds of Africa’s exports.

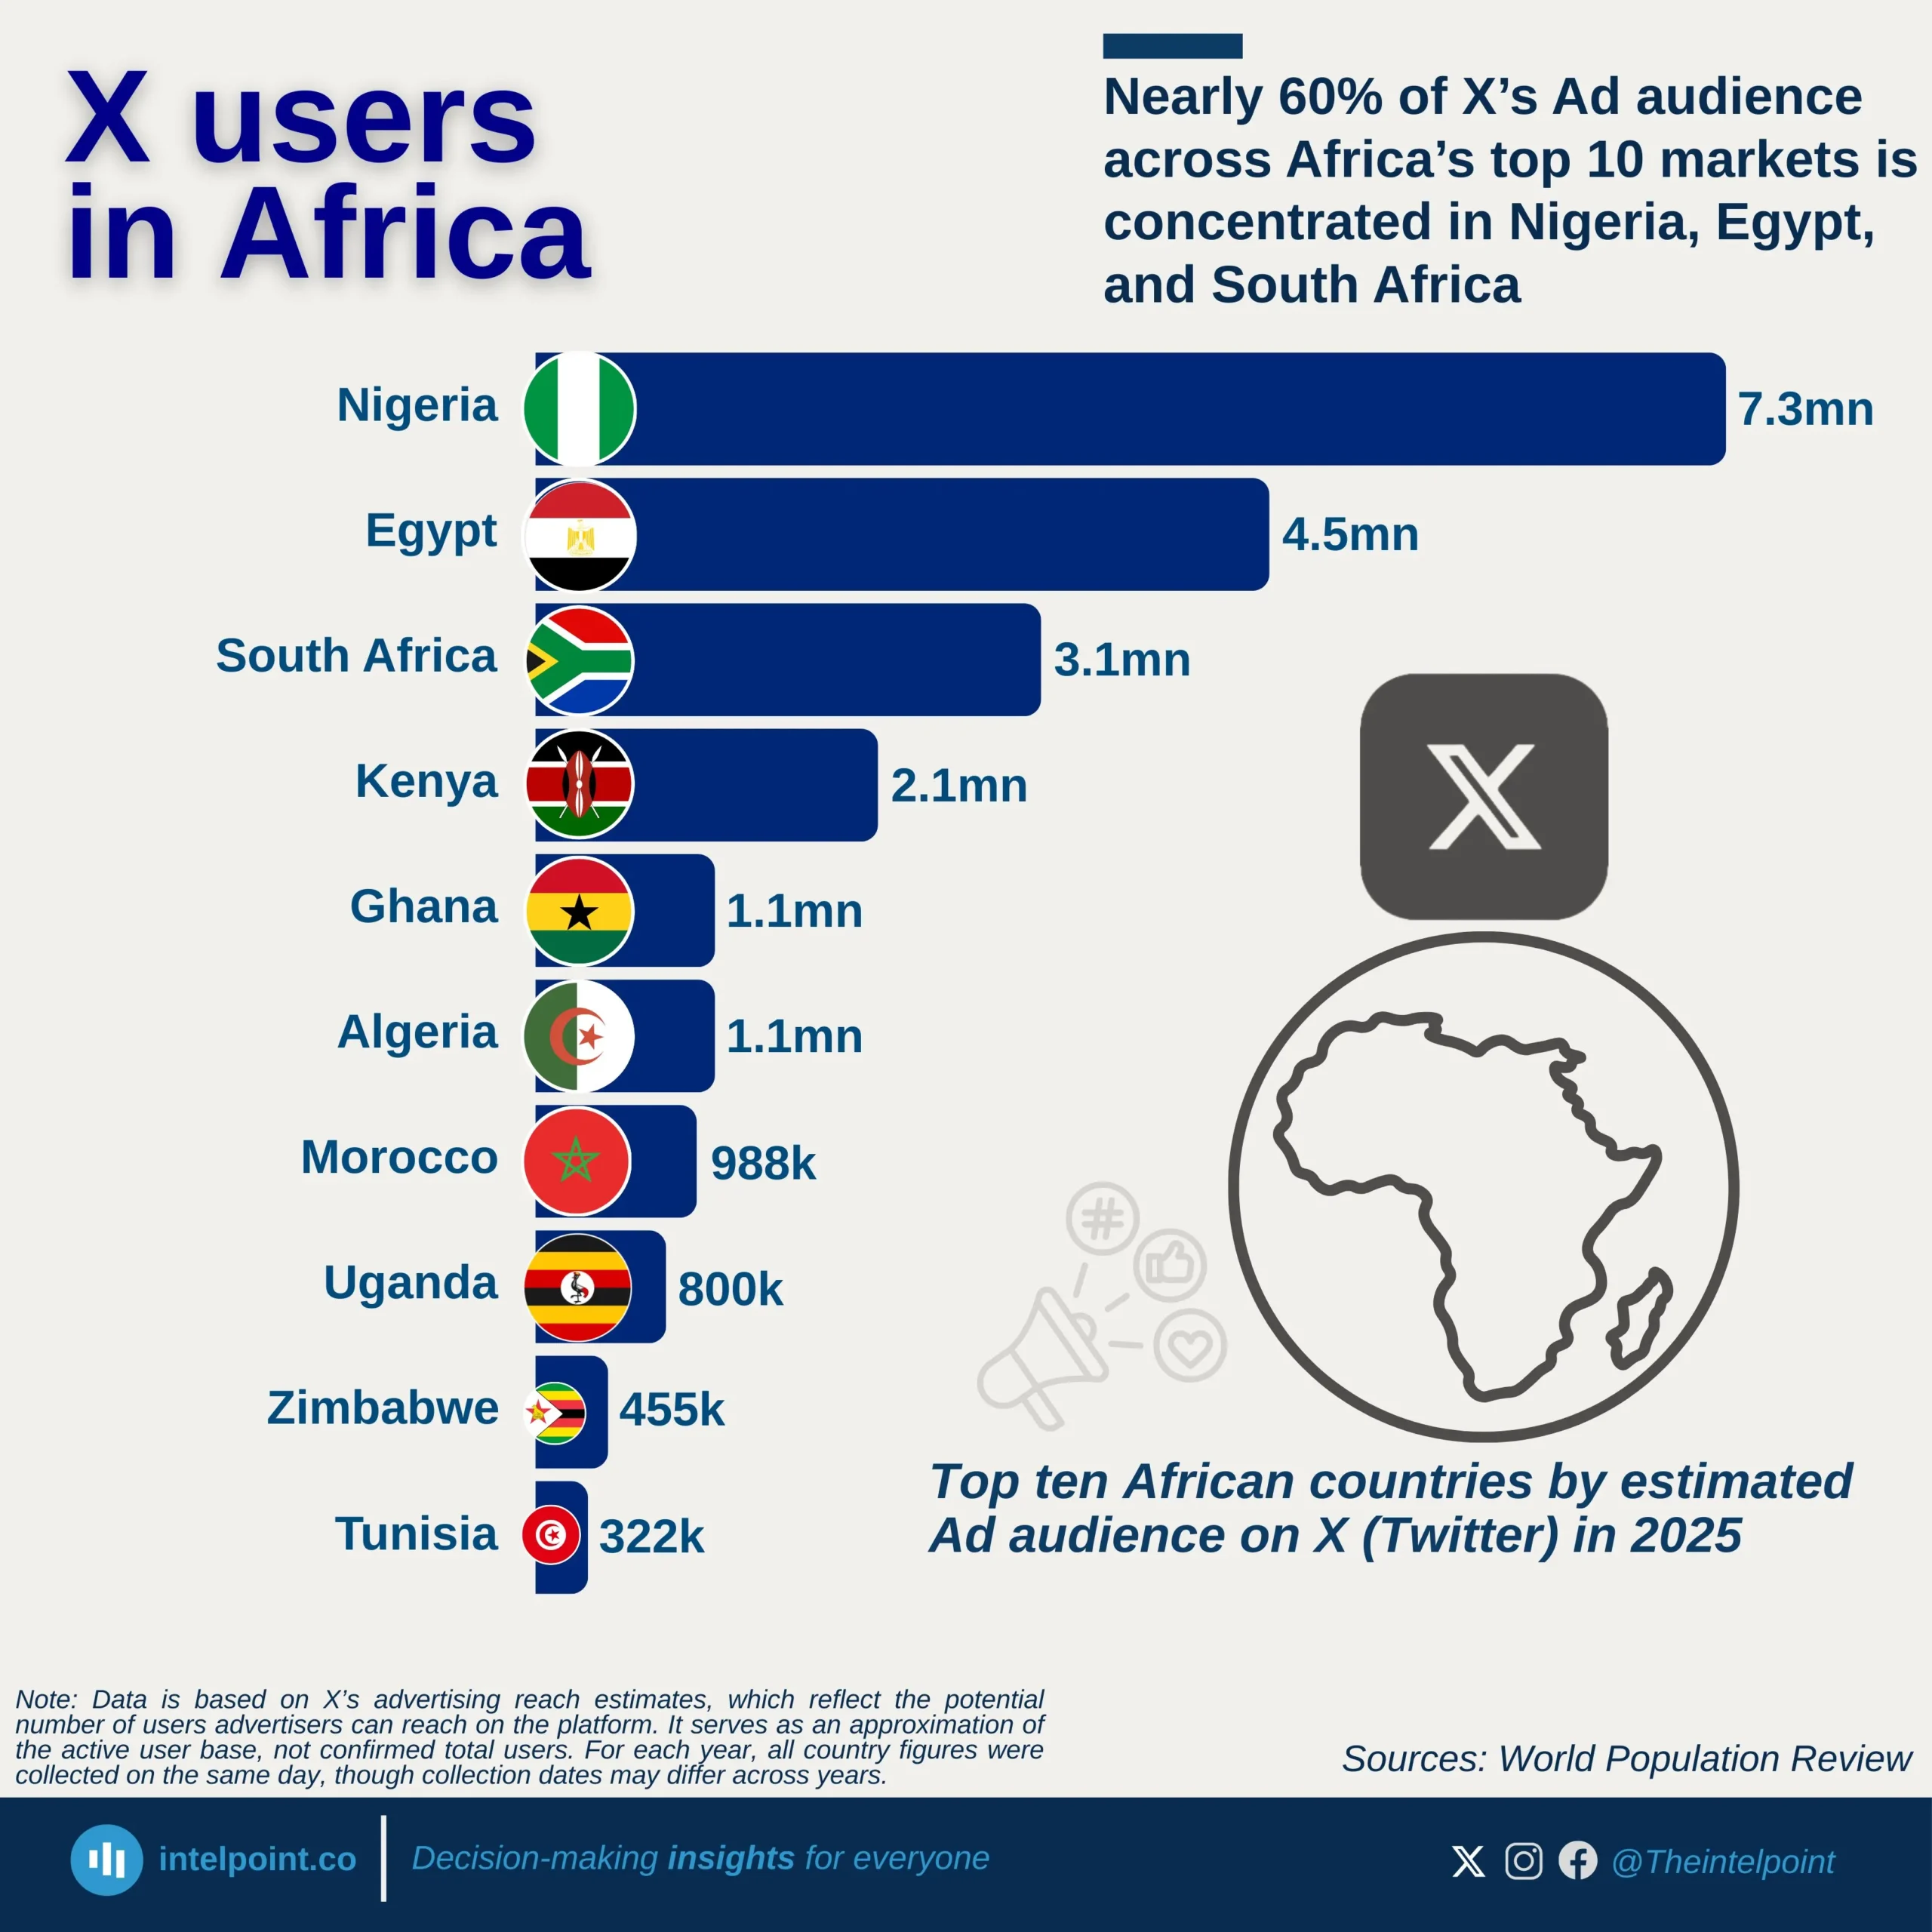
By contrast, Africa’s fourth largest economy, Nigeria, contributed just $1.55 billion, highlighting the uneven distribution of digital trade capacity across the continent.

Source:

World Trade Organization (WTO)

Period:

2023
HTML code to embed chart
Want a bespoke report?
Reach out
Tags
Related Insights

For every $1 Ghana earns from exporting pharmaceutical products, it spends about $22 on imports
  • For every $1 Ghana earns from pharmaceutical exports, it spends about $22 on imports, underscoring the country’s overwhelming dependence on foreign pharmaceutical products.
  • Ghana is a net importer of medicine and has been for nearly two decades.
  • By 2015, Ghana’s pharmaceutical imports reached its peak with $348.12m while exports were $3.10m, meaning imports were nearly 100 times larger.
  • In 2016, Ghana recorded its highest-ever export performance at $78.33 million, but even then, imports stood at $154.96m, almost two times higher.

For the first time in 17 years, Ghana’s ceramic exports recorded a $19.9m surplus in 2023
  • In 2023, Ghana recorded $91.9m in ceramic exports, amassing $19.9m profit, after 17 years of consistent trade losses and heavy dependence on imported ceramic products.
  • For 17 years, Ghana’s ceramic market was largely import-driven, with local industries struggling to compete against foreign products.
  • Ghana's ceramic products trade recorded $1.397 billion in trade deficit in almost two decades.
  • Ghana's ceramic industry has finally moved from dependency to a driver of profit and progress.

Over the past two decades, Egypt exported roughly twice as much ceramic products as it imported
  • Over the past two decades, Egypt exported roughly twice as much ceramic products as it imported, positioning itself as a key player in regional and global ceramic products trade.
  • In 2012, exports peaked at $488.51 million, more than double imports at $178.23 million, setting a clear demonstration of strong industrial and commodity output.
  • In 2008, exports soared to $325.86 million, more than doubling imports at $126.21 million.
  • Between 2017 and 2021, the export sector showed stable performance, averaging $327 million annually.
  • The year 2021 was a standout, with exports reaching $401.12 million, reflecting a strong rebound that reaffirmed Egypt’s export capacity post-pandemic.

The U.S. consistently leads Nigeria’s imports from the Americas, accounting for 57–73% in 13 years
  • The U.S. consistently leads Nigeria’s imports from the Americas, accounting for 57–73% between 2013 and 2025.
  • Brazil ranks second, with shares ranging between 11% and 24%, highlighting its steady trade ties with Nigeria.
  • During the period, the combined share of the U.S. and Brazil never fell below 76%, even at its lowest point in 2022.
  • Total imports from the Americas surged from ₦0.9 trillion in 2013 to a peak of ₦6.3 trillion in 2024.
  • Canada’s import share peaked at 16.4% in 2022, showing a rare moment of diversification.

Nigeria's H1 trade: Imports from ECOWAS countries rose from 12% in H1 2021 to a peak of nearly 40% in H1 2024
  • Imports from ECOWAS countries peaked at 39.9% in H1 2024, up from just 12.0% in H1 2021.
  • The share declined to 32.4% in H1 2025, showing a reversal after the 2024 peak.
  • Total import values grew sharply, from ₦209.6B in H1 2020 to ₦1.8T in H1 2025.
  • In H1 2019, ECOWAS already had a decent share of 19.6%, showing long-standing but fluctuating trade ties.

The ECOWAS share of Nigerian exports to African countries nearly doubled, from 34.2% to 62.1%
  • ECOWAS’ share of Nigerian exports rose from 34.2% in H1 2019 to 62.1% in H1 2025.
  • The most significant share came in H1 2022, when ECOWAS accounted for 75.8% of exports.
  • Exports to other African countries dropped significantly in 2022, to just 24.2%.
  • Nigeria’s total exports to Africa grew from ₦0.9T in H1 2022 to ₦4.8T in H1 2025.
  • ECOWAS consistently maintained a majority share from H1 2022 onwards, with a share above 60%.

POPULAR TOPICS
SIGN UP TO OUR NEWSLETTER
Get periodic updates about the African startup space, access to our reports, among others.
Subscribe Here
Subscription Form

A product of Techpoint Africa. All rights reserved