Over the four-year period from Q3 2020 to Q3 2024, road accidents in Nigeria declined by 53%

Key Takeaways

  • Road accidents declined by 53% between Q3 2020 and Q3 2024.
  • Q4 2022 recorded the highest number of accidents, with 4,835 reported cases.
  • Q3 2024 had the lowest number, with just 1,945 accidents.
  • Speed violation remains the leading cause of road accidents in Nigeria.
  • Ogun, FCT, Kaduna, and Nasarawa consistently rank among the top four states with the highest accident occurrences.
  • Bayelsa, Borno, Imo, Rivers, and Akwa Ibom regularly report the lowest number of accidents each quarter.
  • Commercial vehicles are the most frequently involved vehicle category in accidents.
  • Cars account for the highest number of individual vehicle accidents.

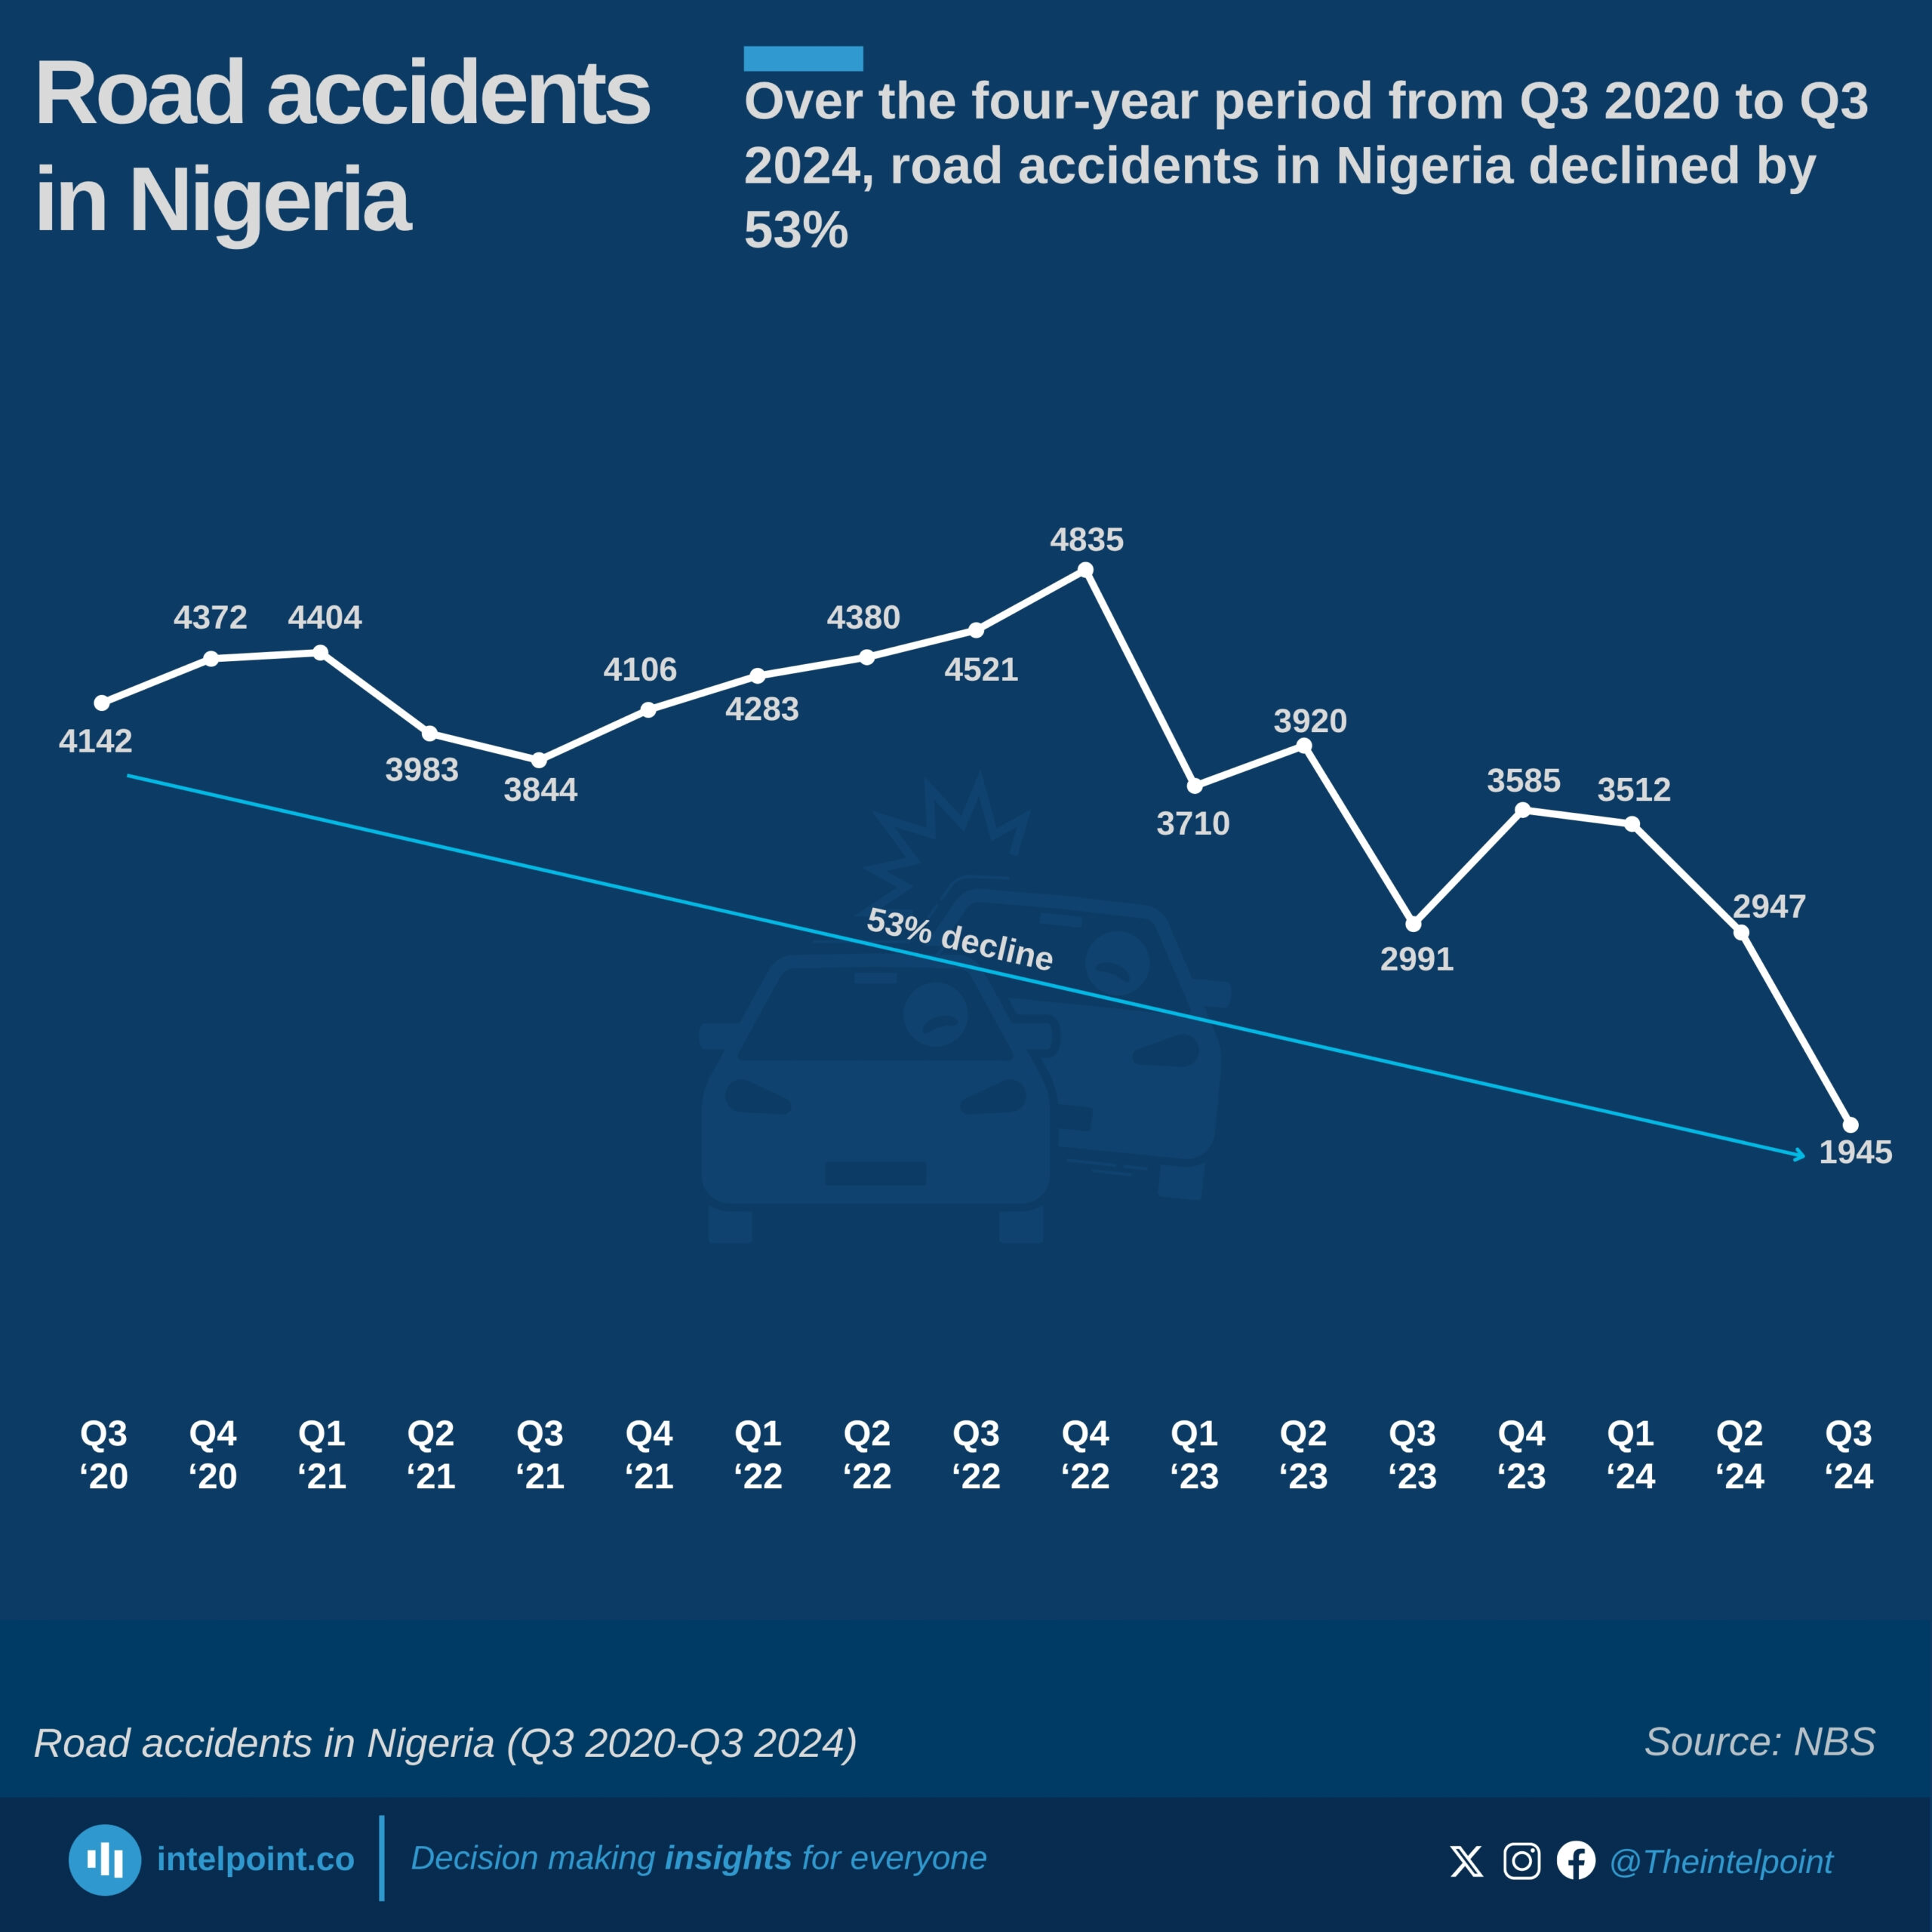
Road accidents have long been a common occurrence around the world, and Nigeria is no exception. In the country, the leading causes of road accidents include speed violations, tyre bursts, disregard for traffic signals, and route violations. However, in recent years, there has been a noticeable decline in the number of road accidents.

Notably, the third quarter of 2024 recorded the lowest number of road accidents in the observed period, marking a significant 53% decrease compared to the same quarter in 2020. This steady decline appears to align with the series of petrol price hikes that began in May 2023, following the removal of fuel subsidies. Between May 2023 and September 2024, the pump price of Premium Motor Spirit (PMS) rose by approximately 332.7%, potentially contributing to reduced road usage and, by extension, fewer accidents.

Source:

NBS

Period:

Q3 2020-Q3 2024
HTML code to embed chart
Want a bespoke report?
Reach out
Tags
Related Insights

Nigeria’s power grid is 69.9% powered by thermal plants
  • Thermal energy dominates Nigeria’s grid, supplying 69.9% of total power.
  • Hydro plants contribute 30.1%, making them the country’s second major source.
  • The heavy reliance on thermal generation shows Nigeria’s grid is still largely fossil-fuel driven.
  • Hydro remains a crucial but secondary source, supporting overall supply stability.

Nigeria's DisCos recorded ₦360bn revenue gap after collecting ₦1.12tn from ₦1.49tn billed in H1 2025
  • DisCos billed approximately ₦1.49 trillion but collected only ₦1.12 trillion in H1 2025.
  • Ikeja and Eko DisCos generated the highest revenues, collecting ₦206.22 billion and ₦210.59 billion, respectively.
  • Revenue collection gaps remain significant, with Jos, Kaduna, and Yola posting the weakest collection performances.
  • The wide gap between billings and actual collections suggests persistent challenges in customer payment compliance, metering, and distribution efficiency.

Nigeria has installed 3.65 million electricity metres since 2019; Ikeja DisCo leads with 823,000, and Aba Power at the bottom with 56,000
  • Approximately 3.65 million metres have been installed nationwide across all frameworks since 2019.
  • Ikeja DisCo leads by a wide margin with 823,000 installations, over twice the volume of most other DisCos.
  • Kaduna, Yola, and Aba Power recorded the lowest metre installations, each below 100,000.
  • The disparities in installation totals reveal uneven progress in achieving nationwide metering coverage.

More than 8 in 10 electricity customers of Ikeja and Eko DisCos are now metered
  • Ikeja (84.6%) and Eko (83.3%) lead Nigeria’s metering performance, keeping unmetered customers below 17%.
  • Eight out of the twelve DisCos have metering rates below 60%, showing a wide sector imbalance.
  • The worst-performing DisCos — Yola, Jos, Kaduna, and Kano — have over 65% unmetered customers.
  • Regional disparities are sharp: Lagos and Abuja outperform northern and south-eastern DisCos by large margins.

Anambra State records the highest average intercity bus fare at ₦9,862, exceeding the lowest (Kwara) by a substantial ₦3,871
  • Anambra has the highest intercity transport fare at ₦9,862, exceeding the national average by ₦1,857.
  • Kwara recorded the lowest fare at ₦5,991, a difference of nearly ₦3,900 from Anambra.
  • The national average fare for intercity bus travel stood at ₦8,005 as of July 2025.
  • Imo (₦9,710) and Oyo (₦9,708) followed closely behind Anambra, rounding out the top three highest-fare states.
  • The South West (₦8,570) and South East (₦8,547) were the most expensive regions for intercity bus travel.

Lagos State has the highest average intra-city bus fare in Nigeria at ₦1,384, exceeding the national average by over ₦355
  • Lagos State tops the list with the highest intra-city bus fare at ₦1,384, exceeding the national average by ₦355.
  • Abia State recorded the lowest average fare at ₦508, showing a stark difference of ₦876 between the highest and lowest states.
  • The national average fare for a bus trip within Nigerian cities stood at ₦1,028.40 as of July 2025.
  • Nasarawa (₦1,306) and Enugu (₦1,280) followed closely behind Lagos State, rounding out the top three highest fares.
  • The South West had the highest regional average fare (₦1,116), while the South South (₦985) and North West (₦995) had the lowest.
  • States like Taraba (₦1,250) and Zamfara (₦1,248) also featured in the top six, showing that high fares are not limited to Southern urban centres.
 

POPULAR TOPICS
SIGN UP TO OUR NEWSLETTER
Get periodic updates about the African startup space, access to our reports, among others.
Subscribe Here
Subscription Form

A product of Techpoint Africa. All rights reserved