Number of road accidents by geopolitical zone in Nigeria (Cumulative, Q3 2020-Q3 2024)

Key Takeaways

  • The North Central zone accounts for the highest share of road accidents in Nigeria, contributing 34.55% of the national total.
  • Within the North Central zone, Abuja (FCT) recorded the most accidents, with a cumulative total of 8,133 cases.
  • The South West zone ranks second, responsible for 25.78% of all accidents nationwide, with Ogun State leading the zone at 6,418 accidents.
  • The South East zone has the lowest share, contributing just 5.38% of total accidents from Q2 2020 to Q2 2024.
  • Enugu State, the highest contributor within the South East, accounts for only 1.59% of the national total.

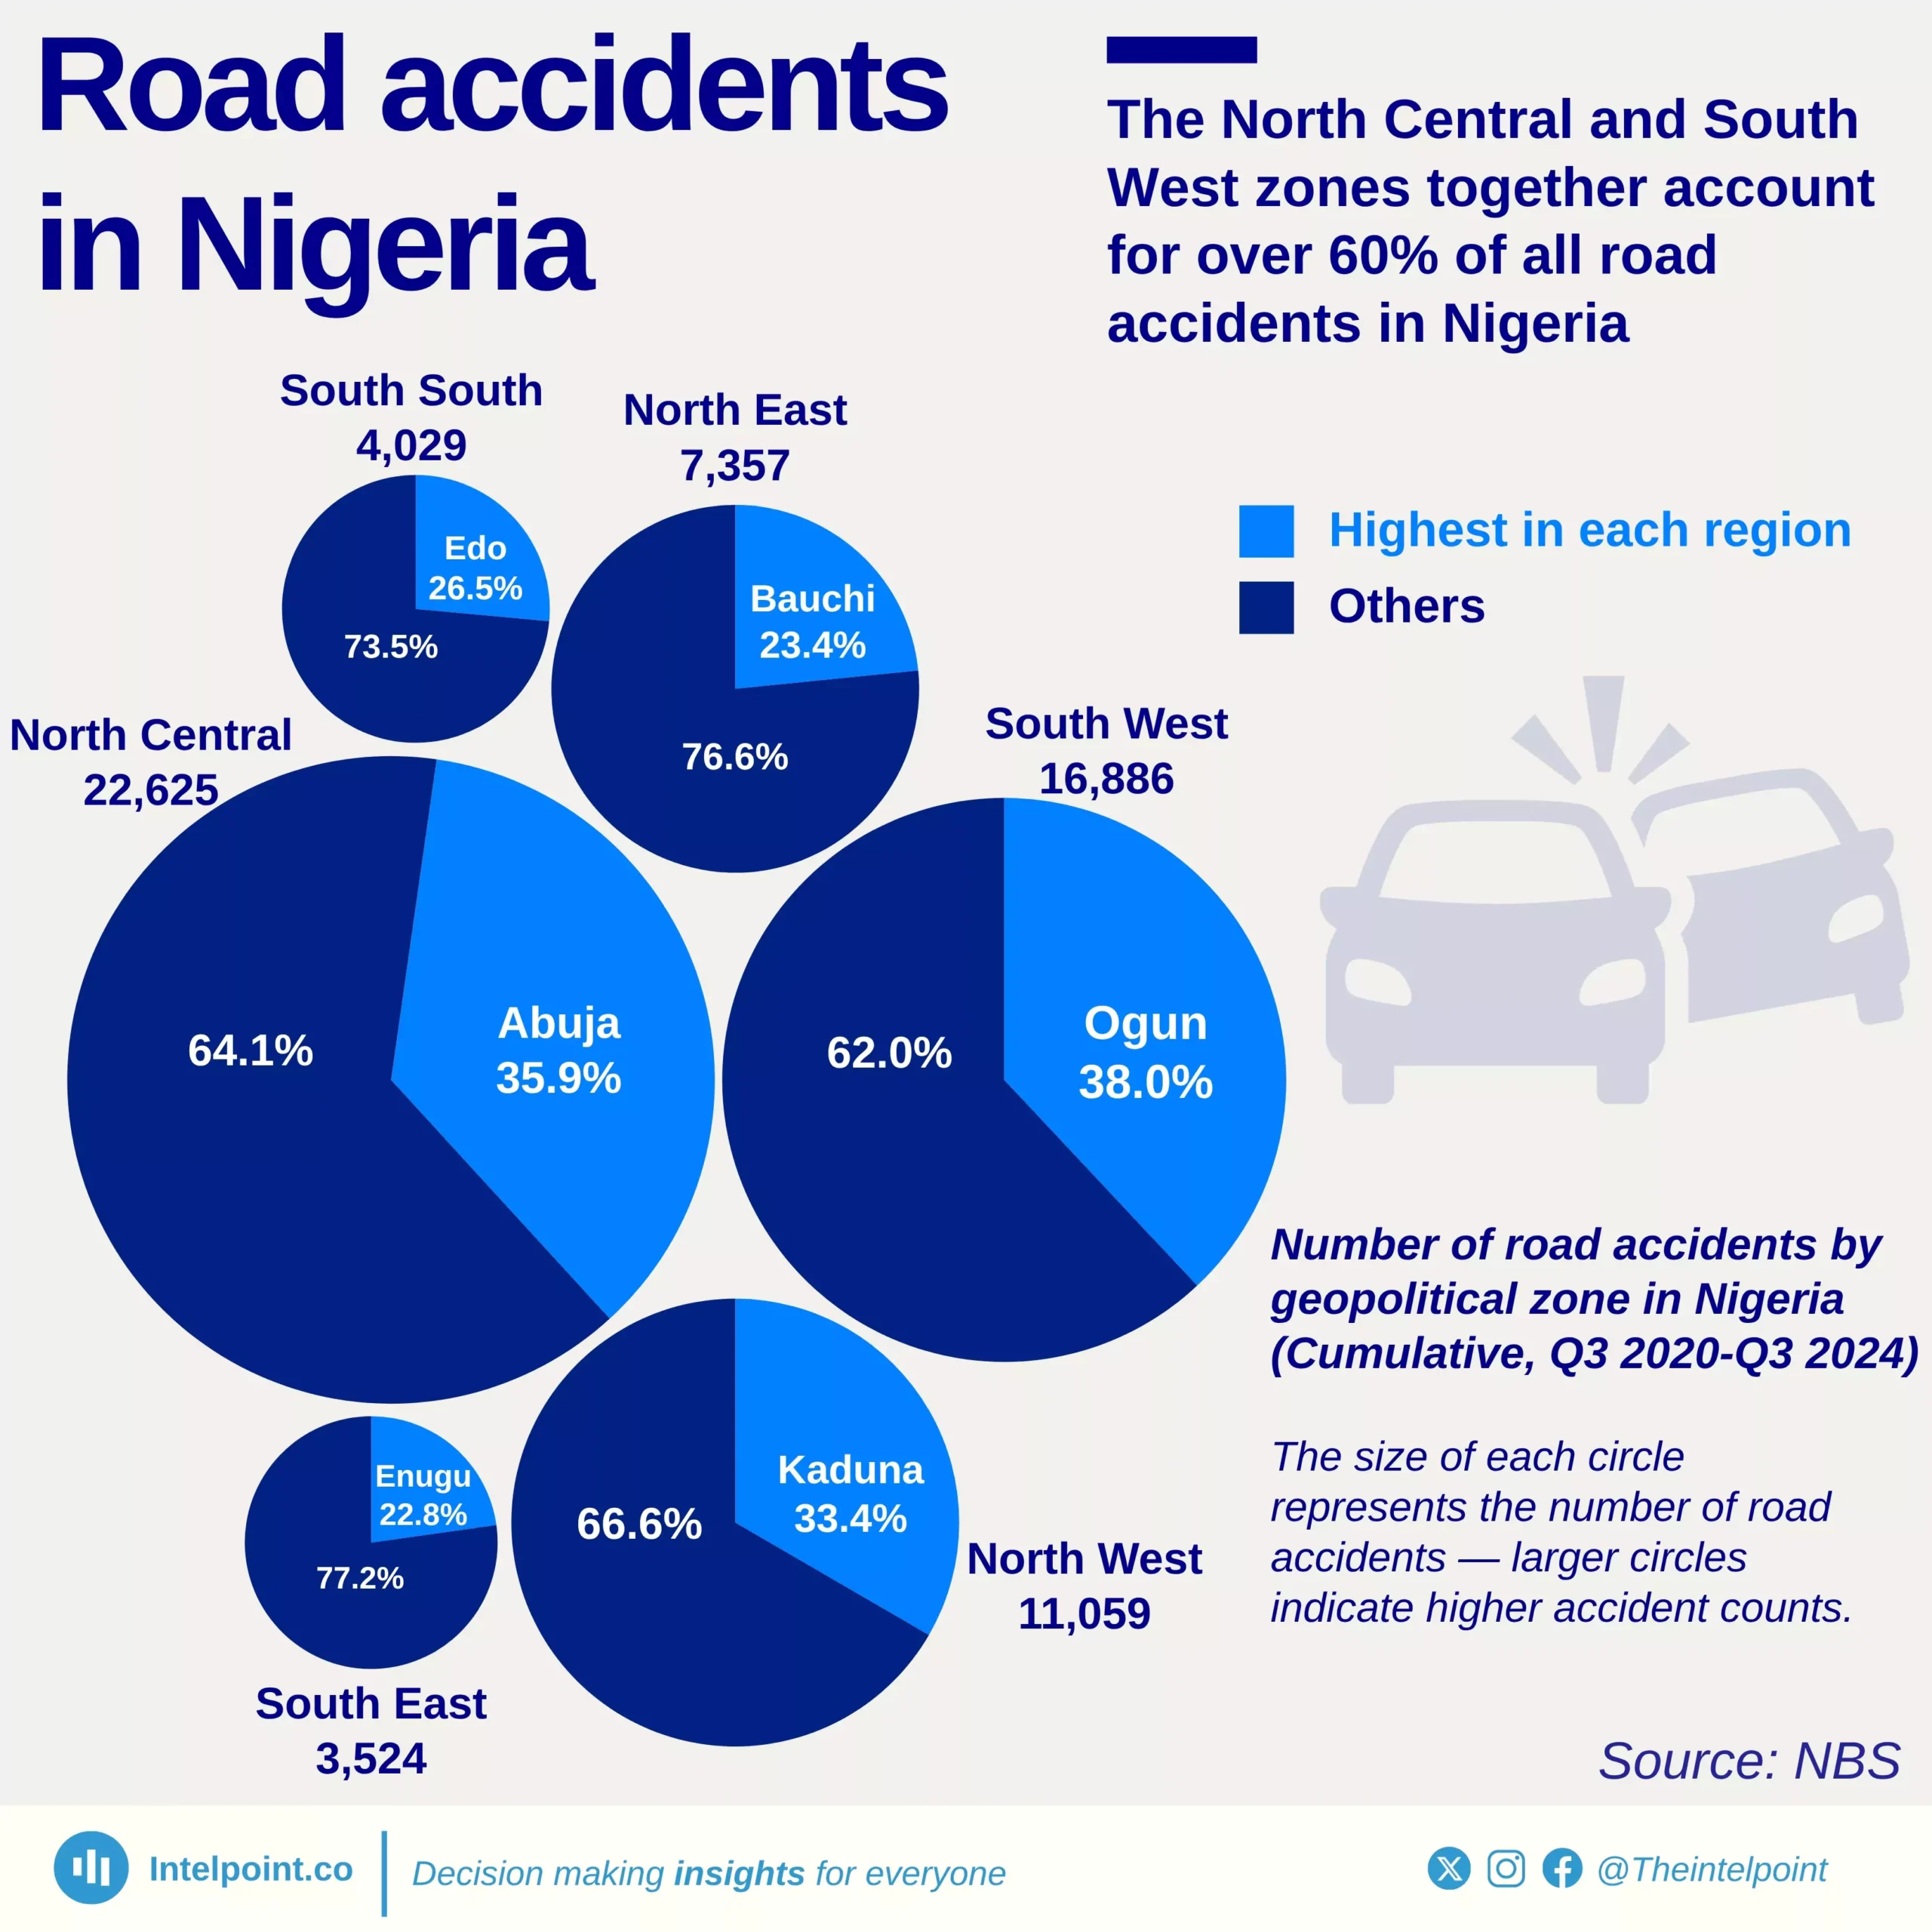
Between Q2 2020 and Q2 2024, Nigeria’s North Central zone emerged as the region with the highest number of road accidents, accounting for a significant 34.55% of all recorded incidents nationwide. Within this zone, the Federal Capital Territory, Abuja, stood out as the most accident-prone area, contributing 12.42% to the national total and a striking 35.9% of all accidents in the North Central zone alone. This highlights the heavy traffic volume and rapid urbanisation challenges faced by the capital city.

In stark contrast, the South East zone recorded the lowest proportion of road accidents during the same period, contributing just 5.38% to the national total. Even the zone’s top contributor, Enugu State, accounted for only 1.59% of all accidents in the country, despite making up 22.8% of the South East’s accident figures.

Source:

NBS

Period:

Q3 2020-Q3 2024
HTML code to embed chart
Want a bespoke report?
Reach out
Tags
Related Insights

Nigeria beats Egypt to win AFCON bronze medal, extending its record to nine third-place finishes
  • Nigeria extends its AFCON bronze medal wins to nine, the highest in men’s AFCON history, with another podium finish.
  • The win over Egypt highlights Nigeria’s resilience, turning late-stage setbacks into tangible success.
  • Bronze medals remain rare for most nations, with the majority appearing only once or twice in AFCON history.

Nigeria’s power grid is 69.9% powered by thermal plants
  • Thermal energy dominates Nigeria’s grid, supplying 69.9% of total power.
  • Hydro plants contribute 30.1%, making them the country’s second major source.
  • The heavy reliance on thermal generation shows Nigeria’s grid is still largely fossil-fuel driven.
  • Hydro remains a crucial but secondary source, supporting overall supply stability.

Nigeria's DisCos recorded ₦360bn revenue gap after collecting ₦1.12tn from ₦1.49tn billed in H1 2025
  • DisCos billed approximately ₦1.49 trillion but collected only ₦1.12 trillion in H1 2025.
  • Ikeja and Eko DisCos generated the highest revenues, collecting ₦206.22 billion and ₦210.59 billion, respectively.
  • Revenue collection gaps remain significant, with Jos, Kaduna, and Yola posting the weakest collection performances.
  • The wide gap between billings and actual collections suggests persistent challenges in customer payment compliance, metering, and distribution efficiency.

Nigeria has installed 3.65 million electricity metres since 2019; Ikeja DisCo leads with 823,000, and Aba Power at the bottom with 56,000
  • Approximately 3.65 million metres have been installed nationwide across all frameworks since 2019.
  • Ikeja DisCo leads by a wide margin with 823,000 installations, over twice the volume of most other DisCos.
  • Kaduna, Yola, and Aba Power recorded the lowest metre installations, each below 100,000.
  • The disparities in installation totals reveal uneven progress in achieving nationwide metering coverage.

More than 8 in 10 electricity customers of Ikeja and Eko DisCos are now metered
  • Ikeja (84.6%) and Eko (83.3%) lead Nigeria’s metering performance, keeping unmetered customers below 17%.
  • Eight out of the twelve DisCos have metering rates below 60%, showing a wide sector imbalance.
  • The worst-performing DisCos — Yola, Jos, Kaduna, and Kano — have over 65% unmetered customers.
  • Regional disparities are sharp: Lagos and Abuja outperform northern and south-eastern DisCos by large margins.

Anambra State records the highest average intercity bus fare at ₦9,862, exceeding the lowest (Kwara) by a substantial ₦3,871
  • Anambra has the highest intercity transport fare at ₦9,862, exceeding the national average by ₦1,857.
  • Kwara recorded the lowest fare at ₦5,991, a difference of nearly ₦3,900 from Anambra.
  • The national average fare for intercity bus travel stood at ₦8,005 as of July 2025.
  • Imo (₦9,710) and Oyo (₦9,708) followed closely behind Anambra, rounding out the top three highest-fare states.
  • The South West (₦8,570) and South East (₦8,547) were the most expensive regions for intercity bus travel.

POPULAR TOPICS
SIGN UP TO OUR NEWSLETTER
Get periodic updates about the African startup space, access to our reports, among others.
Subscribe Here
Subscription Form

A product of Techpoint Africa. All rights reserved