Nigeria had about 135 bank accounts per 100 people in 2025, up from 32 bank accounts in 2017

  • Active bank accounts grew from 65 million in 2016 to over 320 million in 2025 — almost a fivefold increase.
  • Bank accounts per 100 people rose from about 32 in 2017 to nearly 135 in 2025.
  • Nigeria now averages more than one bank account per person.
  • The fastest growth phase occurred between 2019 and 2024.
  • Digital banking and fintech adoption played a major role in the surge.
  • The jump after 2020 suggests technology-driven access, not just population growth.
  • Multiple account ownership is now common among users.

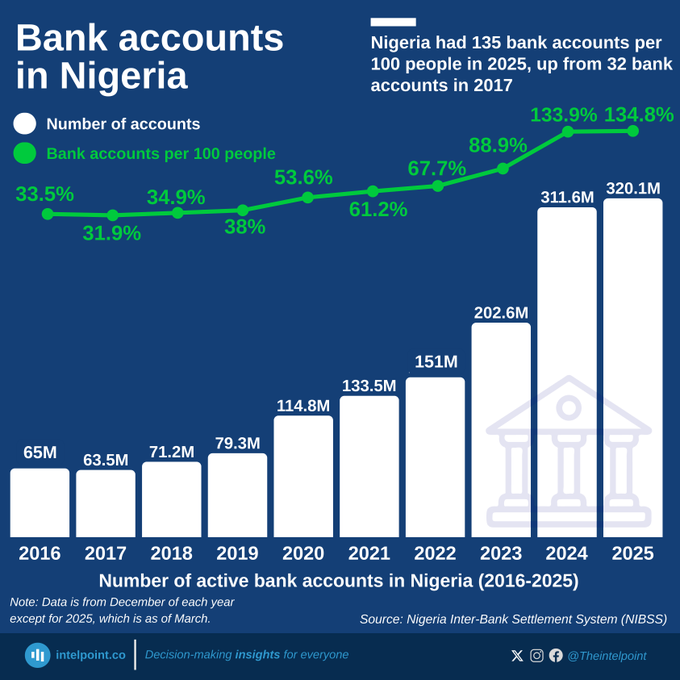
Nigeria’s banking landscape has undergone transformation over the past decade. In 2016, the country had about 65 million active bank accounts. By 2025, that number had risen to more than 320 million. More striking is the shift in access: from 32 accounts per 100 people in 2017 to nearly 135 per 100 people in 2025. This means that, on average, Nigerians now hold more than one bank account each, reflecting the extent to which financial services have penetrated everyday life.

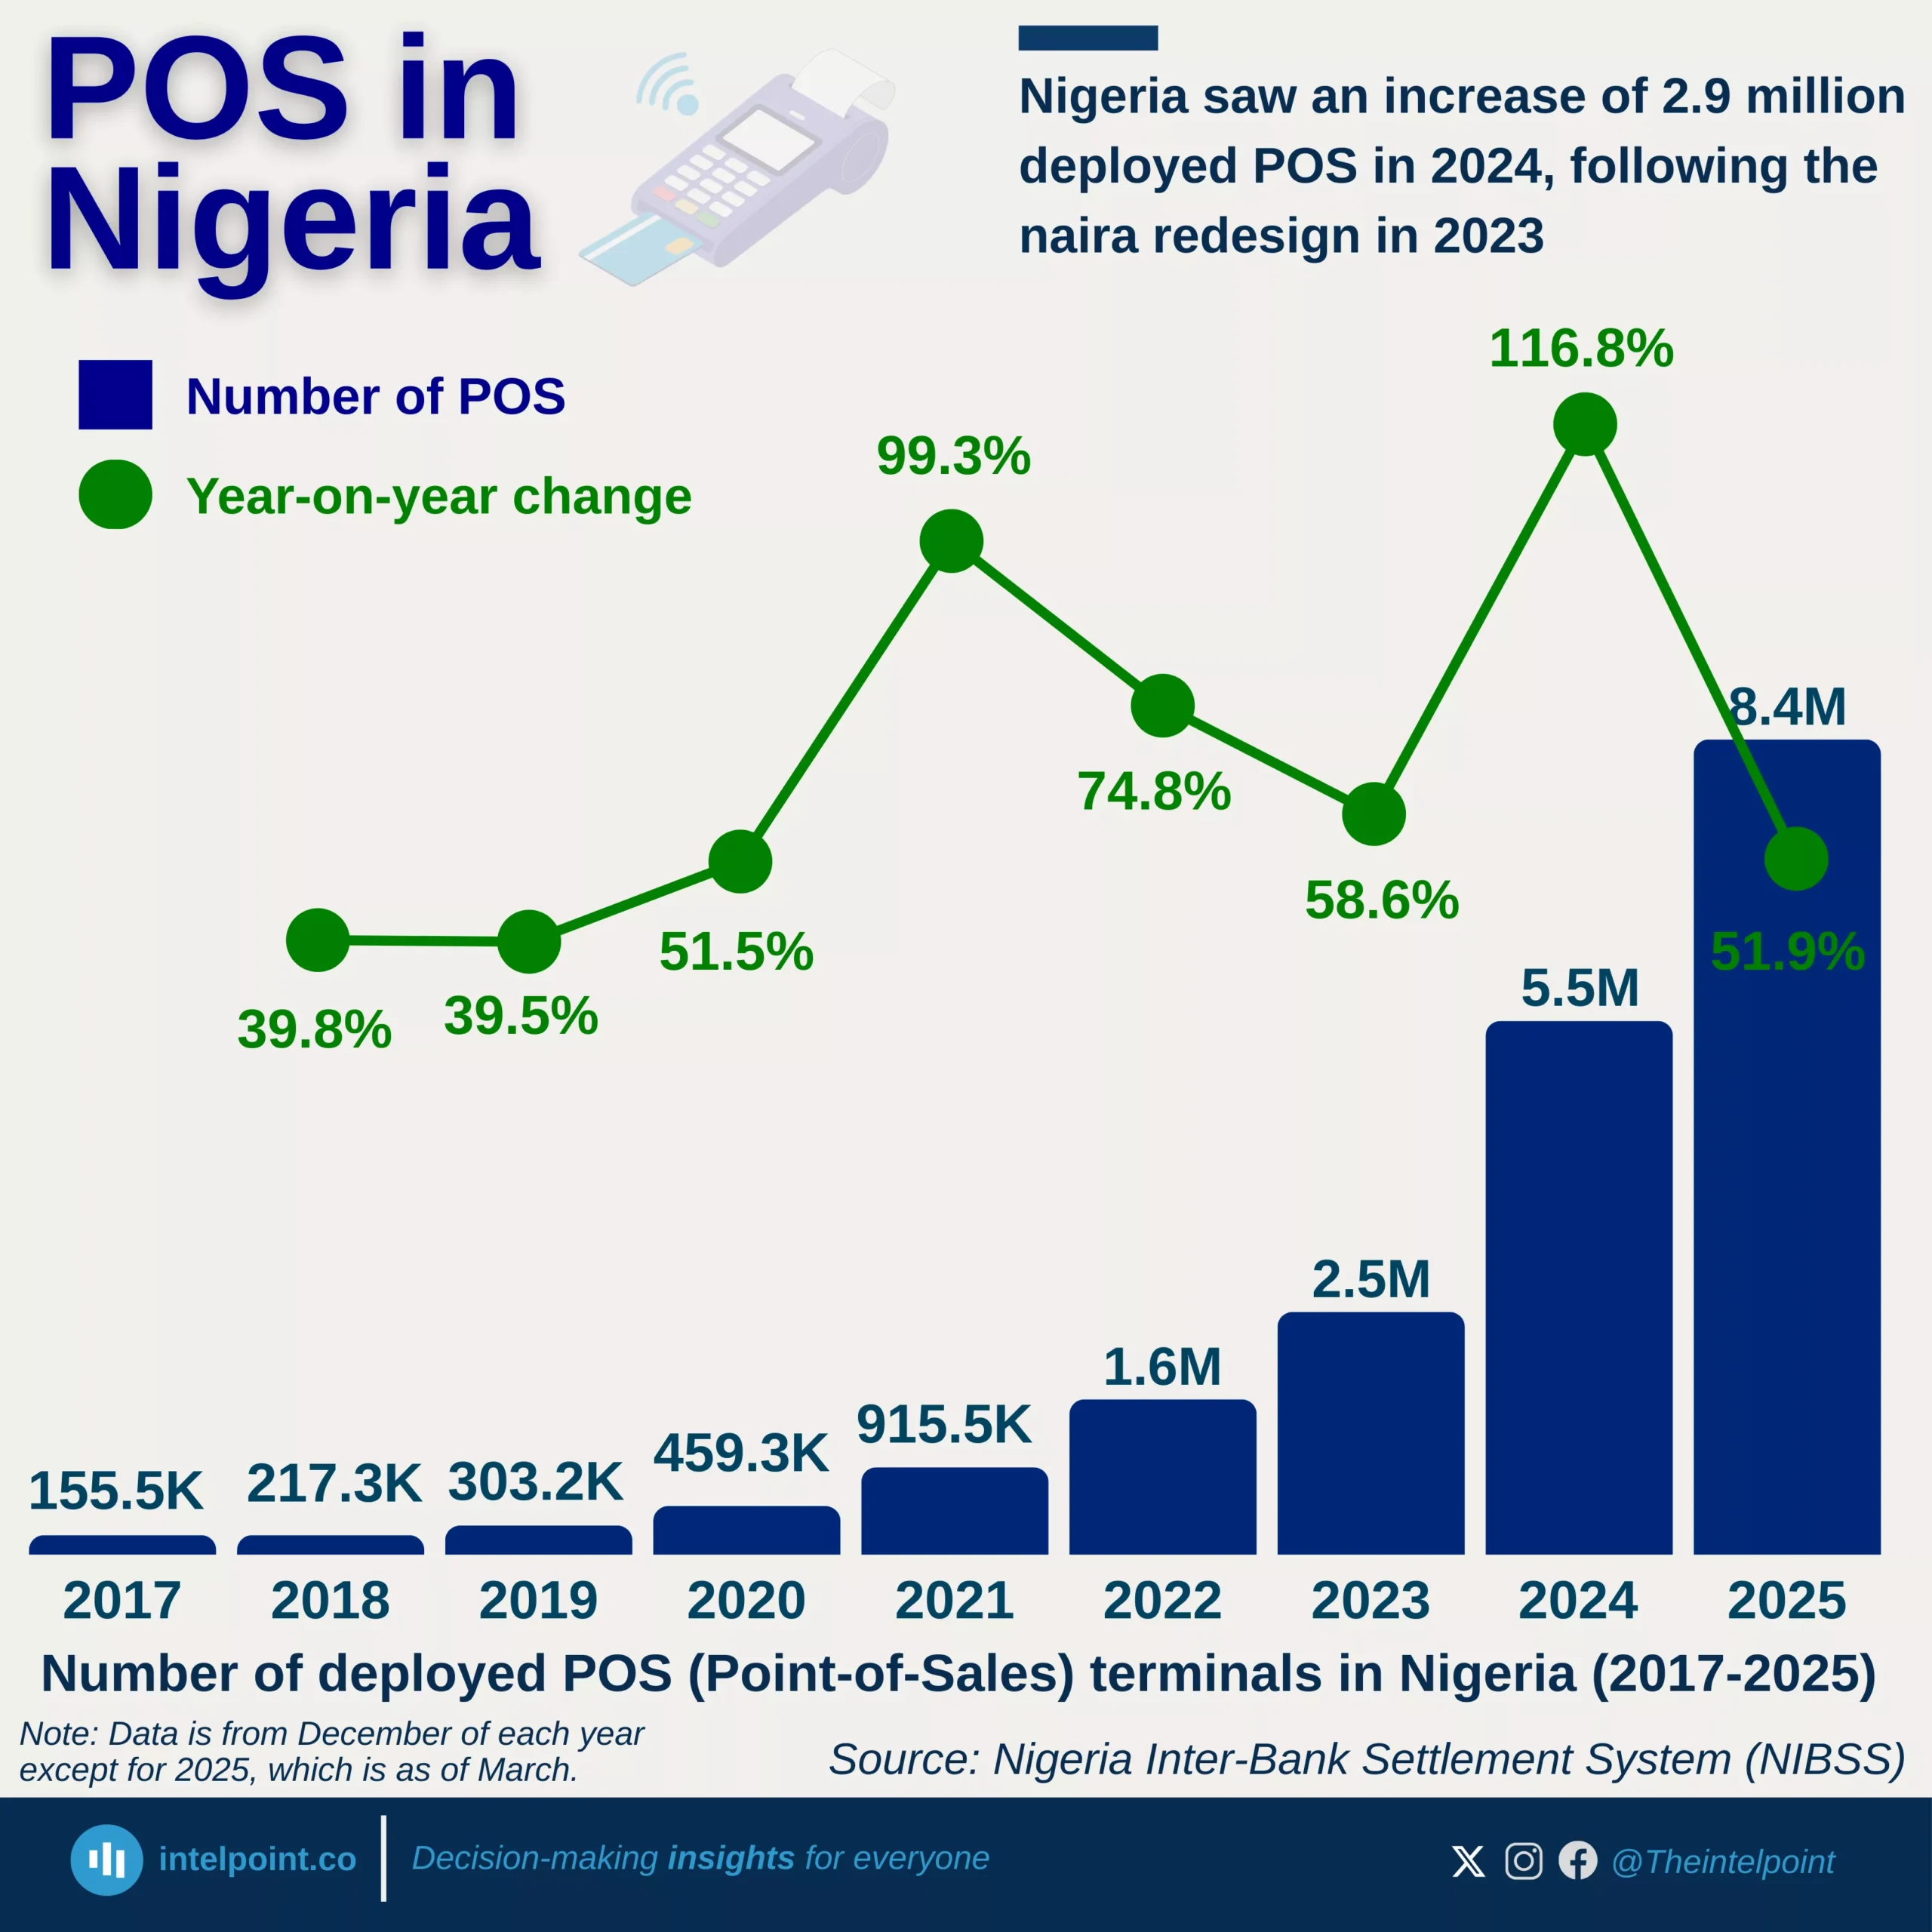
The most intense phase of this growth began around 2020. Between 2019 and 2023, active accounts more than doubled, moving from under 80 million to over 200 million. This period coincided with the rapid expansion of digital banking, fintech apps, mobile payments, and government-led financial inclusion efforts. Banks stopped being physical locations you “visited” and became tools you carried in your pocket. As access to the formal financial system improved, so did participation in it.

Source:

Nigeria Inter-Bank Settlement System (NIBSS)

Period:

2016-2025
HTML code to embed chart
Want a bespoke report?
Reach out
Tags
Related Insights

Nigeria saw an increase of 2.9 million deployed POS in 2024, following the naira redesign in 2023
  • Deployed POS terminals grew from about 156,000 in 2017 to 8.4 million in 2025.
  • Nigeria added more than eight million terminals in eight years, indicating rapid adoption of digital payments.
  • Growth accelerated sharply after 2020, marking a major shift toward cashless transactions.
  • The highest year-on-year growth (116.8%) occurred in 2024, following the naira redesign.
  • About three million terminals were added in 2024 alone.
  • POS agents became critical financial access points during the period of cash shortage.
  • POS terminals now function as mini-banks in many communities.
  • Financial inclusion has expanded through agent-based banking and POS networks.

UBA is the only Tier 1 bank in Nigeria that grew its profit in the first three quarters of 2025 compared to 2024
  • FUGAZ posted a combined ₦2.91 trillion in profit from Q1 to Q3 of 2025.
  • Access Bank recorded the lowest PAT among the FUGAZ
  • UBA recorded a 3% year-on-year increase in PAT
  • FUGAZ recorded an average year-on-year percentage change of -11.2% for the period

GTCO declared ₦476b profit in H1 2025, with Nigeria contributing over 70% of African operations
  • Nigeria dominates with ₦339.6b, contributing over 70% of GTCO’s total profit after tax in Africa.
  • Ghana (₦61.9b) and Côte d’Ivoire (₦28.2b) followed as the strongest non-Nigerian subsidiaries.
  • Tanzania (₦46m) and Uganda (₦505m) contributed negligible profits compared to peers.
  • GTCO subsidiaries across Africa collectively generated around ₦476b profit after tax in the first half of 2025.

Total microfinance deposits in Kenya only grew 1.66% CAGR over 10 years, ending at KSh 43.0B
  • Microfinance deposits in Kenya grew at only 1.66% CAGR between 2014 and 2024.
  • The peak occurred in 2021 at KSh 50.2B, after which deposits began a steady decline.
  • 2015 (+13.2%) and 2020 (+12.3%) posted the strongest year-on-year growth rates.
  • The sector saw consecutive contractions from 2022 (-7.3%), 2023 (-5.7%), to 2024 (-2.0%).
  • Despite small rebounds in 2018 (+7.3%) and 2019 (+12.3%), the long-term trend is weak.

Microfinance banks in Kenya have consistently posted losses since 2016, reaching KSh -3.5B in 2024
  • Microfinance banks in Kenya recorded their last profit in 2015 (KSh 0.6B) before sliding into losses.
  • The sector’s losses deepened from KSh -0.4B in 2016 to KSh -3.5B in 2024.
  • The steepest single-year decline occurred in 2020, when losses increased by 560.8% to KSh -2.2B.
  • Even in recovery years like 2019 (KSh -0.3B) and 2021 (KSh -0.7B), the sector remained in losses.
  • Over the 10 years, profitability fell at a -212.1% CAGR, reflecting a structural collapse.
  • Since 2016, there has been no single year of profit, highlighting sustained weakness.
  • The worsening losses mirror other sector struggles, such as stagnant deposits, weak asset growth, and rising NPLs.

POPULAR TOPICS
SIGN UP TO OUR NEWSLETTER
Get periodic updates about the African startup space, access to our reports, among others.
Subscribe Here
Subscription Form

A product of Techpoint Africa. All rights reserved