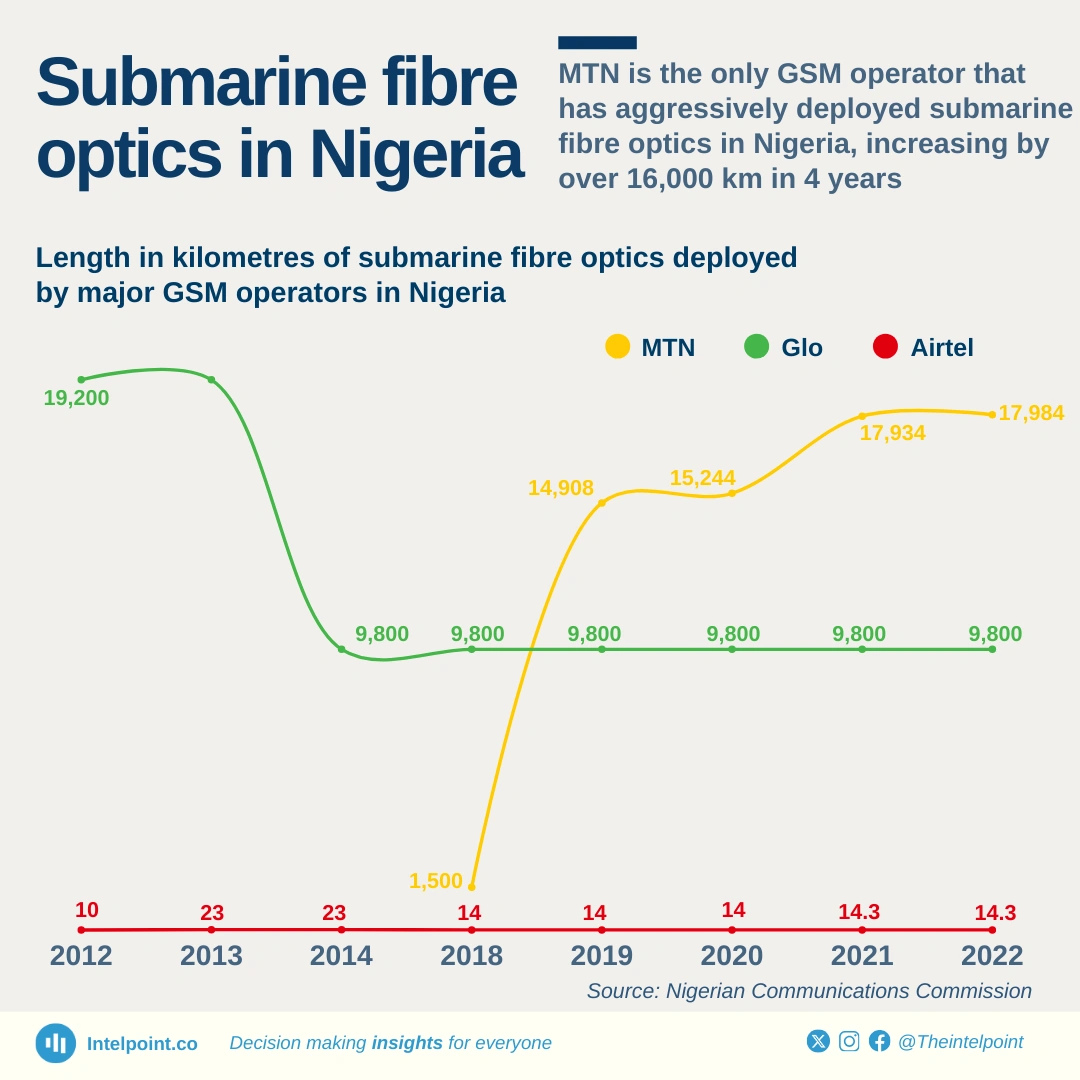
MTN is the only GSM operator that has aggressively deployed submarine fibre optics in Nigeria, increasing by over 16,000 km in 4 years

Key takeaways

  • MTN dominates submarine fibre optic deployment among GSM operators in Nigeria, increasing its network from 1,500 km in 2018 to 17,984 km in 2022
  • Glo had the earliest and largest submarine fibre deployment, peaking at 19,200 km in 2012, but later scaled down to 9,800 km from 2014 onwards
  • Airtel has not invested in submarine fibre, with its network remaining below 25 km throughout the period
  • 9mobile has not deployed any submarine fibre cable since 2012

Submarine fibre optic deployment in Nigeria has been driven primarily by MTN and Glo, with MTN aggressively expanding its network in recent years. Glo initially led the market, but after peaking at 19,200 km in 2012, it significantly reduced its submarine fibre infrastructure to 9,800 km, where it has remained stable since 2014.
MTN, on the other hand, only started expanding in 2018 but rapidly scaled up to 17,984 km by 2022, making it the biggest recent investor in submarine fibre infrastructure. Airtel has largely stayed out of this segment, maintaining a negligible presence.
Source:

Nigerian Communications Commission

Period:

2012-2022
HTML code to embed chart
Want a bespoke report?
Reach out
Tags
Related Insights

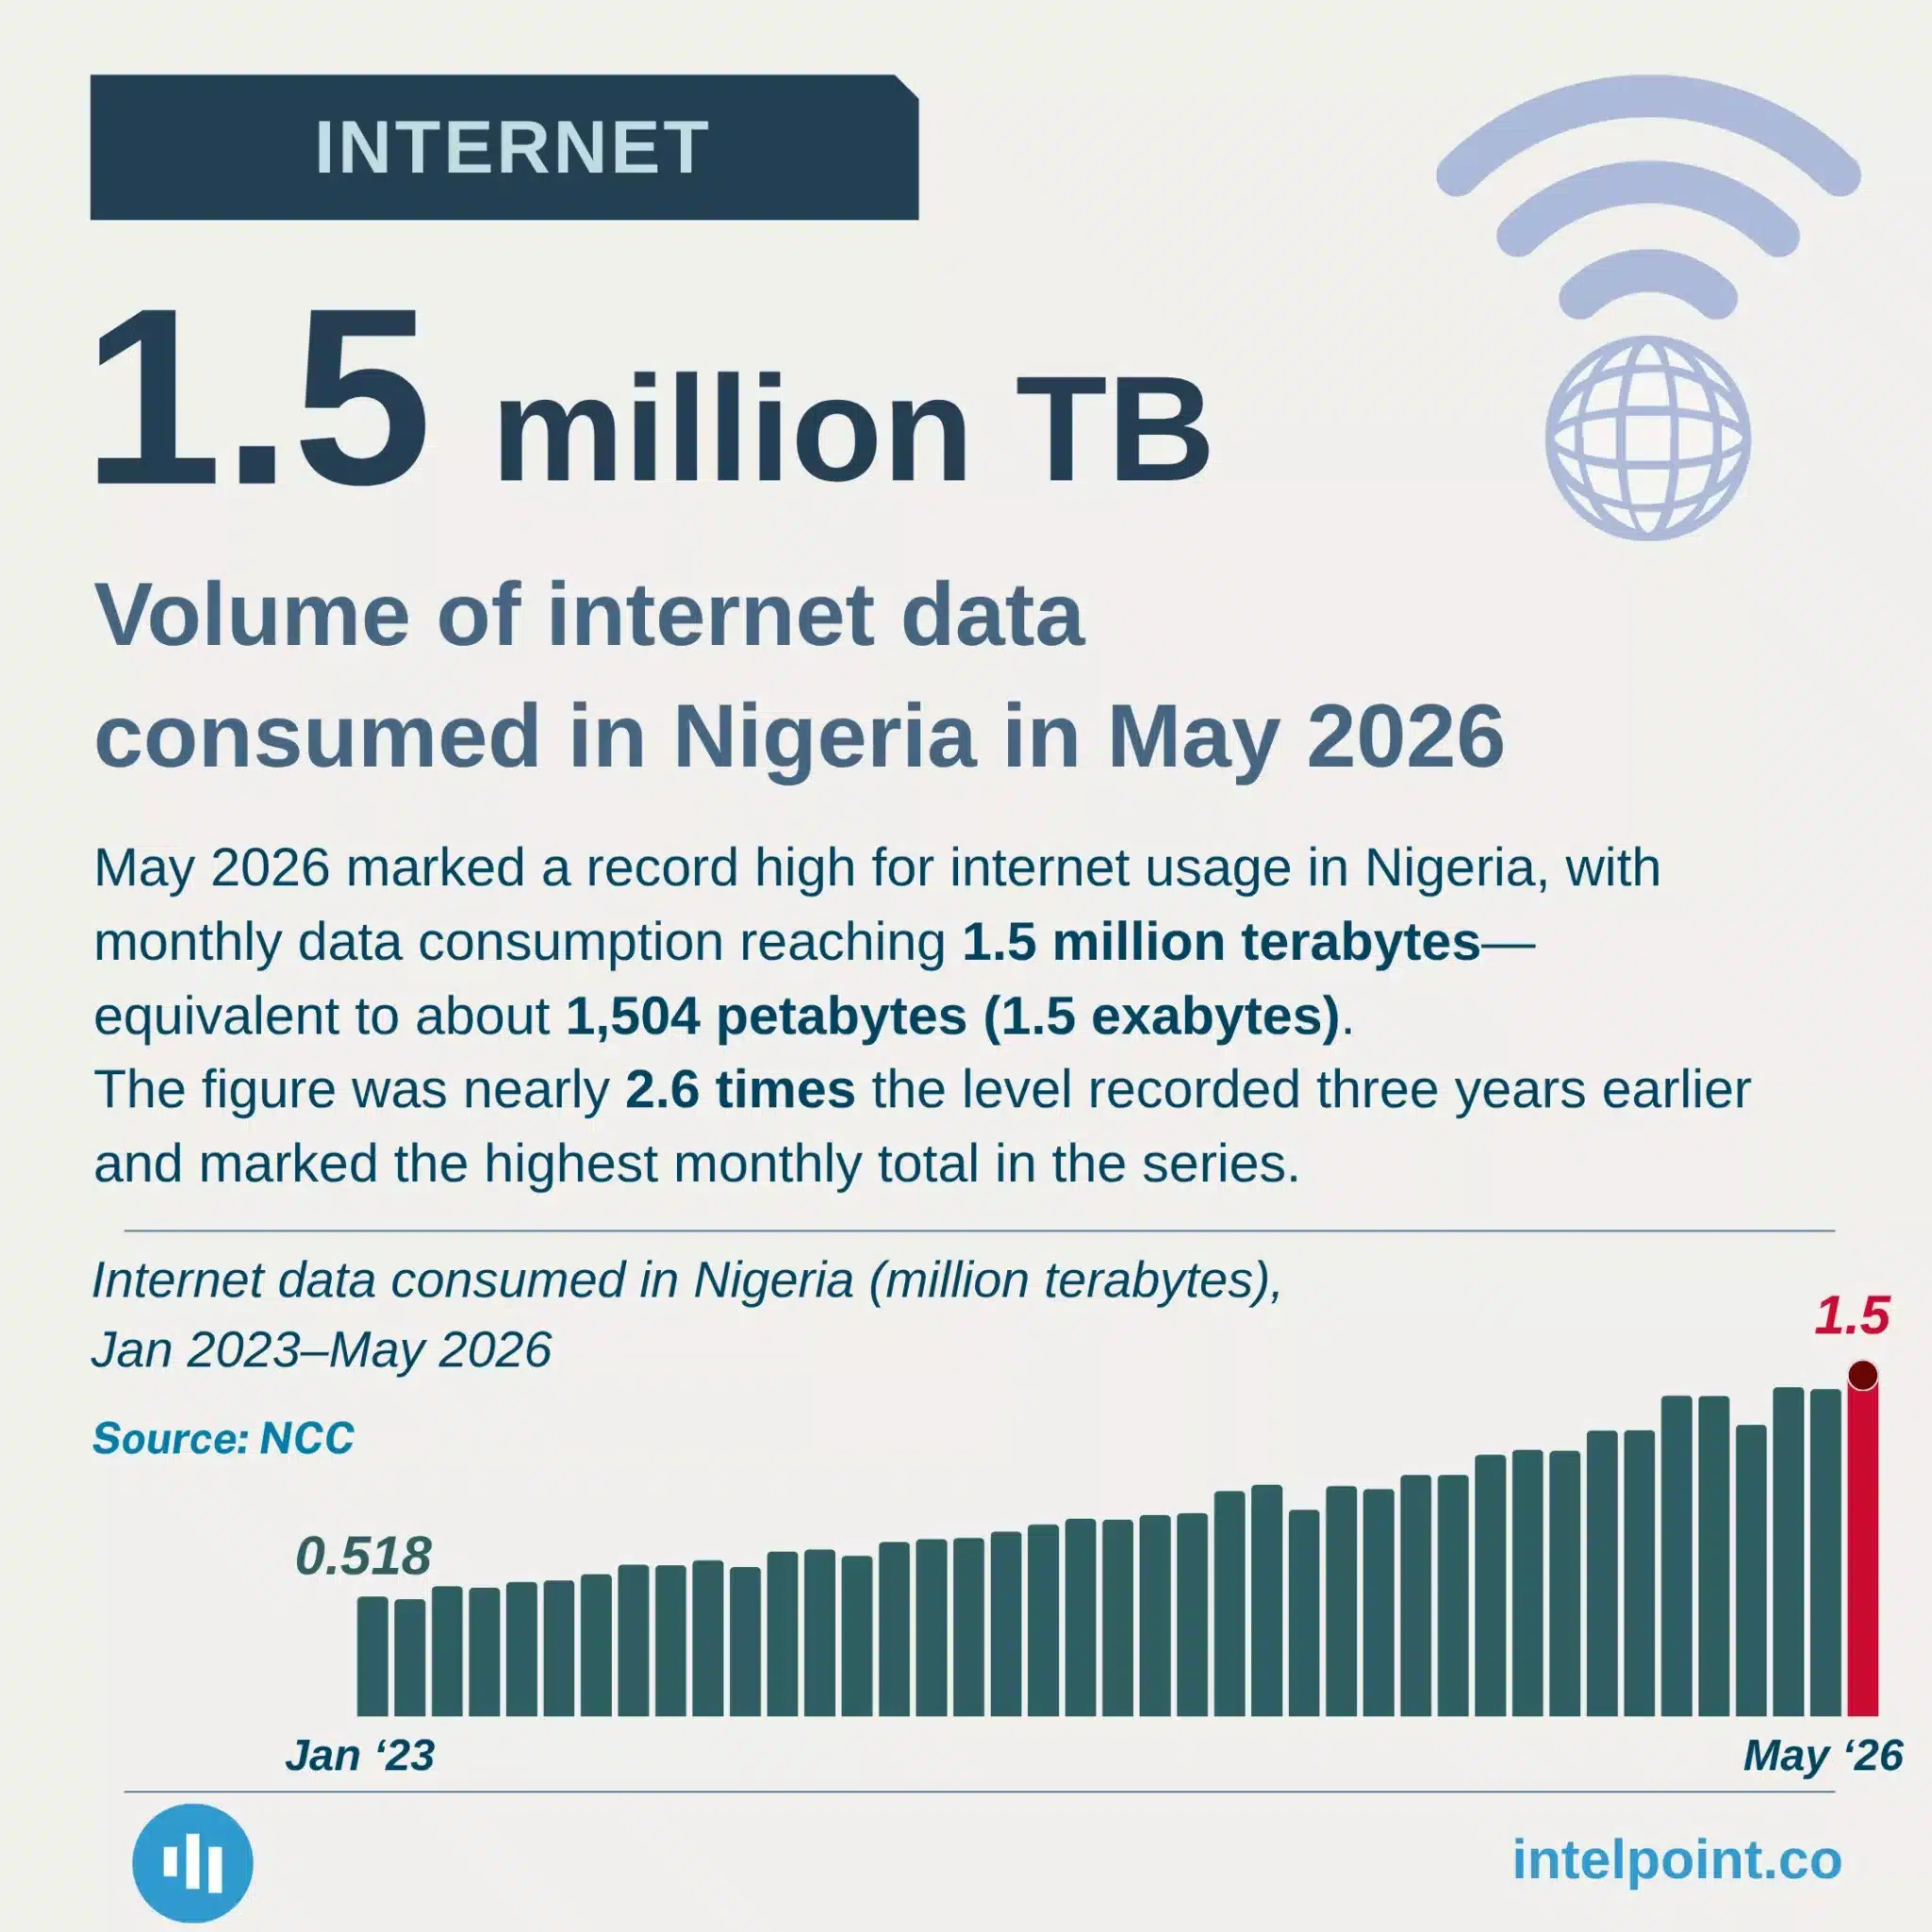
Volume of internet data consumed in Nigeria in May 2026
  • 1.5 million TB was consumed in May 2026, the highest monthly level on record.
  • 7 million TB was consumed in Jan–May 2026, up 42.1% from the same period in 2025.
  • Jan–May 2026 usage was 88.4% higher than in 2024 and 156.3% higher than in 2023.
  • May’s monthly usage was nearly 2.6× the level recorded three years earlier.
  • The surge points to rapidly growing demand for internet-based services, content and digital activity in Nigeria.

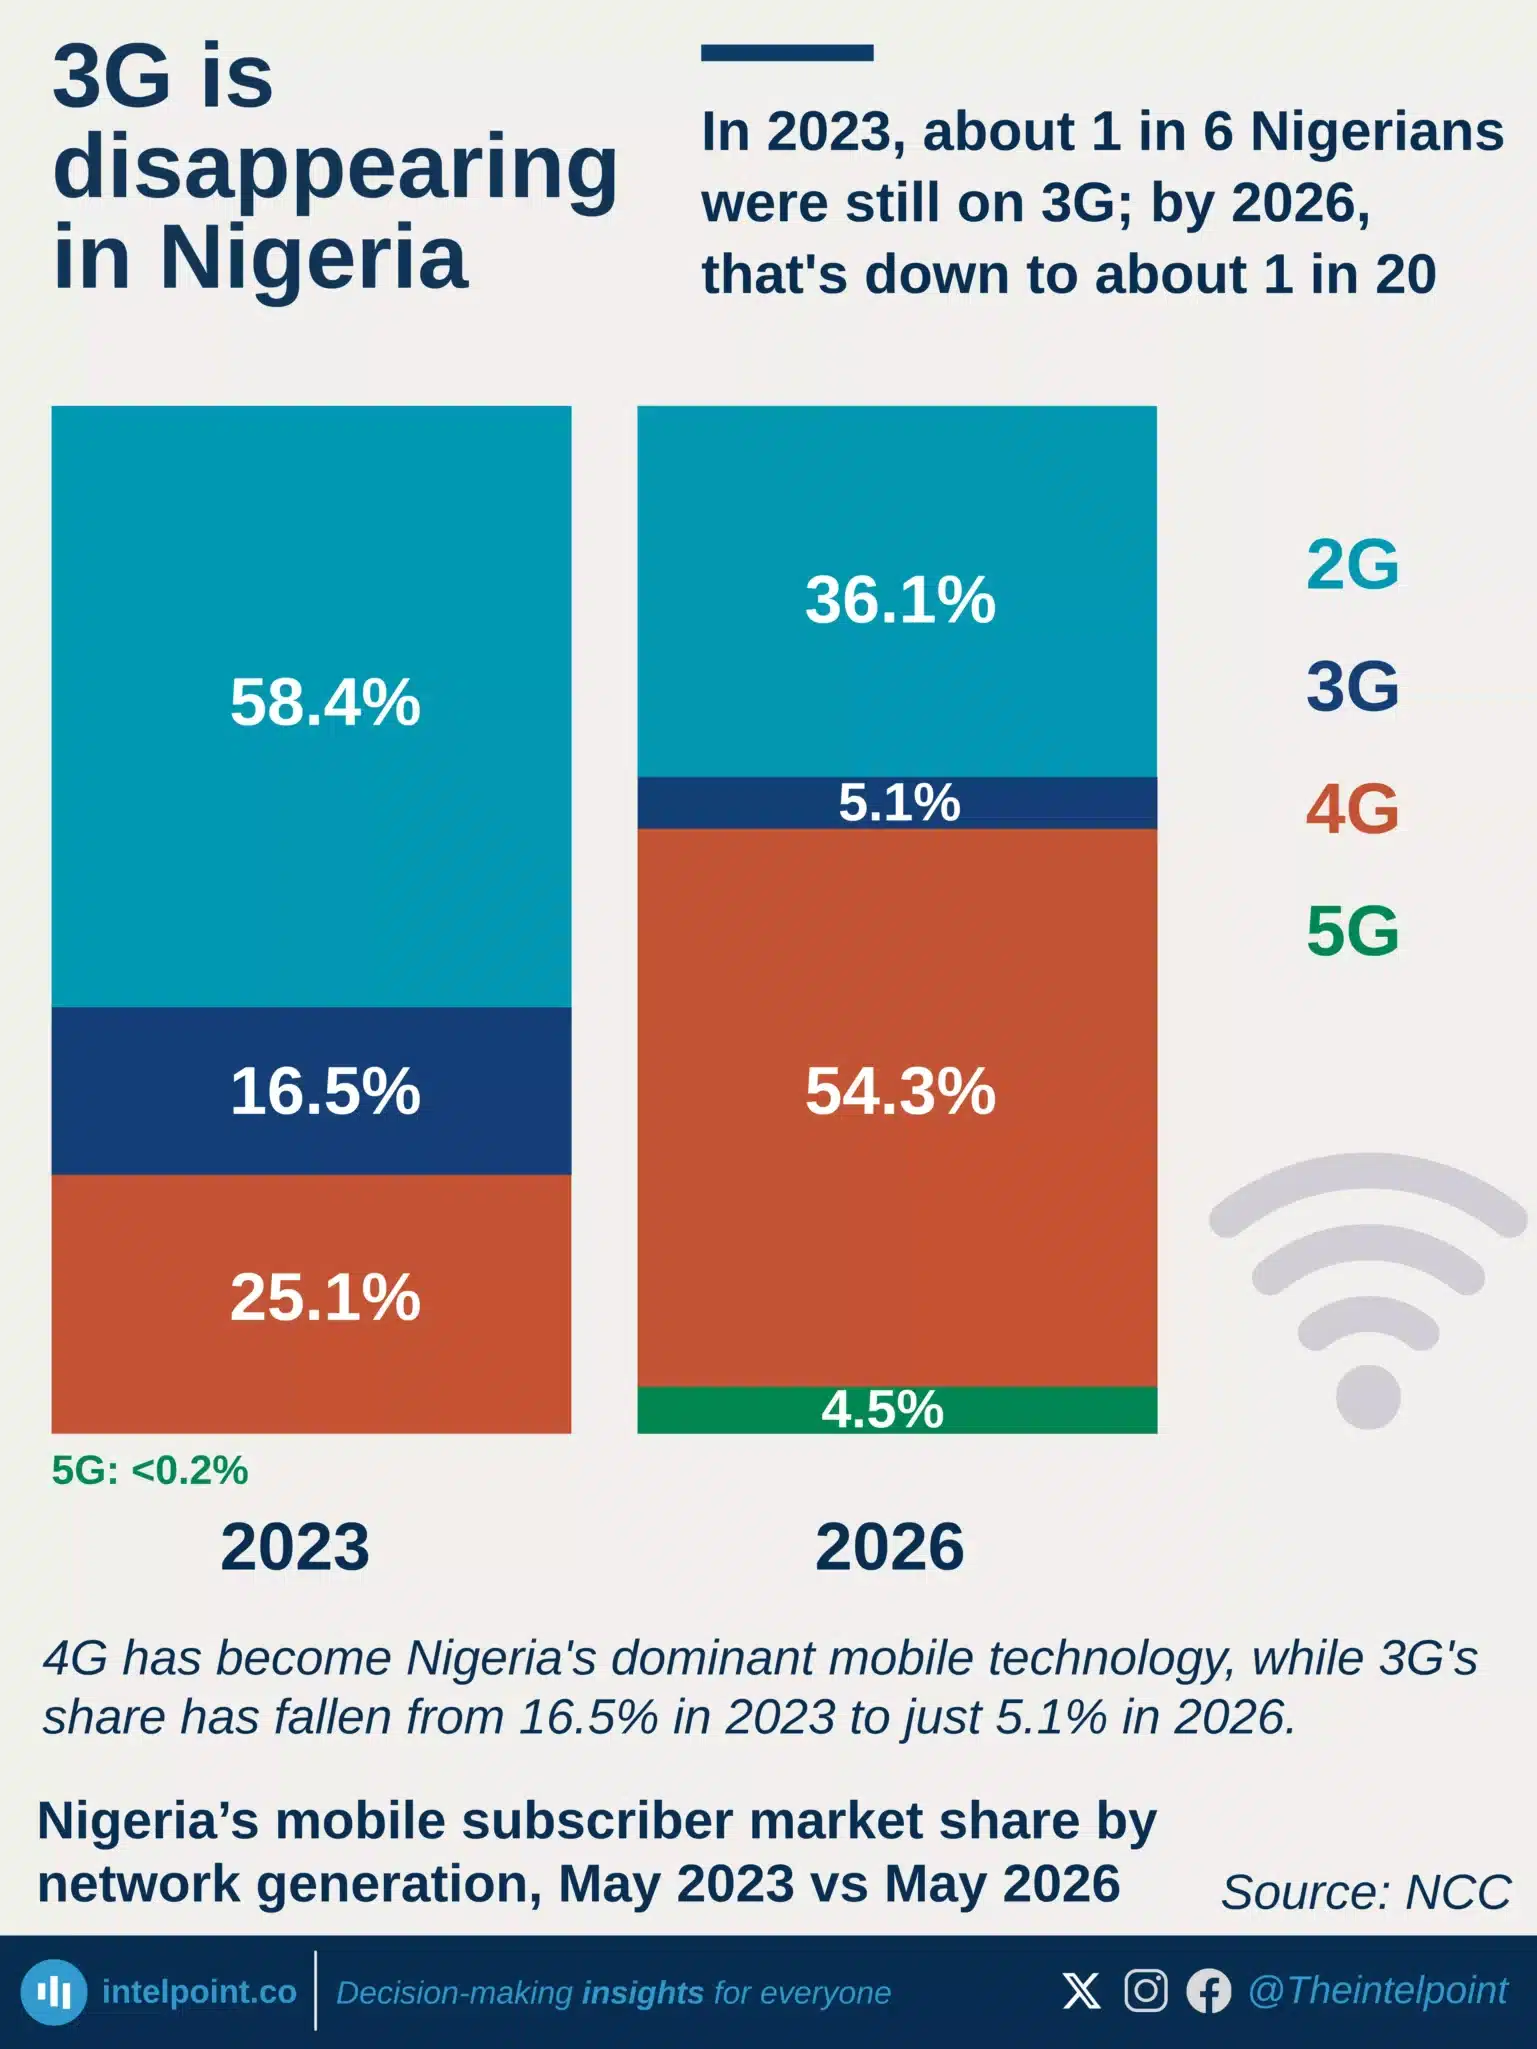
In 2023, about 1 in 6 Nigerians were still on 3G; by 2026, that's down to about 1 in 20
  • 3G's share of Nigeria's mobile market fell from 16.5% to 5.1% between May 2023 and May 2026.
  • 4G became the dominant network, with its market share rising from 25.1% to 54.3% over the same period.
  • 2G's share declined from 58.4% to 36.1% but still accounted for more than one-third of all mobile connections.
  • 5G expanded nearly 37-fold, growing from less than 0.1% to 4.5% of mobile subscriptions.

Nearly 2 in 3 active mobile lines in Ekiti are on MTN
  • MTN held more than half of active mobile lines in most Nigerian states as of December 2025.
  • Ekiti recorded MTN’s highest share at 69.6%, followed by Imo at 64.1% and Anambra at 63.4%.
  • Borno was Airtel’s only leading state, with 56.9% of active mobile lines.
  • Globacom did not lead any state, but it had notable shares in Kogi, Edo, Ondo, FCT, and Oyo.

MTN accounts for over half of internet subscriptions in most Nigerian states
  • MTN held over 50% of active internet subscriptions in most Nigerian states as of December 2025.
  • Ekiti had MTN’s highest share at 70.6%, followed by Imo at 64% and Anambra at 63.7%.
  • Borno was the only state where Airtel led, with 56.6% of active internet subscriptions.
  • Globacom did not lead any state, but it had notable shares in Edo, Kogi, Ondo, Oyo, and Bayelsa.
 

iPhone usage in Africa is just 15%, far below North America’s 60% usage
  • North America leads globally with 60.2% iPhone usage, making it the largest iPhone market.
  • Oceania follows at 58.9%, showing similar consumer preferences to North America.
  • Africa has the lowest iPhone share (14.7%), highlighting a significant adoption gap.
  • Nigeria aligns with the continental trend at 14.1%, reinforcing that the gap is structural, not country-specific.

Card channels were the most susceptible to fraud in Nigerian banks in Q1 2025, with $14.3 billion involved
  • Cards were the most involved in fraud, with ₦14.3 billion representing the most significant exposure among all transaction channels
  • Card transactions also had the highest number of cases (11,972), indicating widespread and frequent attacks
  • Actual losses on cards were 11.5% (₦1.6 billion) of the amount involved, showing that significant financial damage still occurs despite preventive systems
  • Cash fraud accounted for ₦6.8 bn in exposure, nearly half of the card channel’s total
  • Cash also recorded 12.3% (₦800 million) in actual losses
  • Cheques had the lowest fraud involvement (₦1.2 billion) and only 46 cases, but the highest actual loss rate (72.7%)

POPULAR TOPICS
SIGN UP TO OUR NEWSLETTER
Get periodic updates about the African startup space, access to our reports, among others.
Subscribe Here
Subscription Form

A product of Techpoint Africa. All rights reserved