The total global monthly cellular data usage across all mobile app categories reached 146.92 EB in January 2025

Key takeaways:

  • Video apps consumed 75.86% of the total global mobile data, making them by far the largest data users.
  • Social networking apps accounted for 7.84% of the total data usage, translating to 11.52 exabytes.
  • The "Others" category, which includes smaller app groups, made up 10.48% of global mobile data usage.
  • Software updates consumed 2.73% of the global mobile data volume, equivalent to 4.01 exabytes.
  • Web browsing took up 1.42% of mobile data use globally, accounting for 2.09 exabytes.
  • Audio apps like streaming music services accounted for 1.20% of the total mobile data usage.
  • File sharing applications consumed just 0.47% of the mobile data globally, indicating a relatively small share compared to other categories.

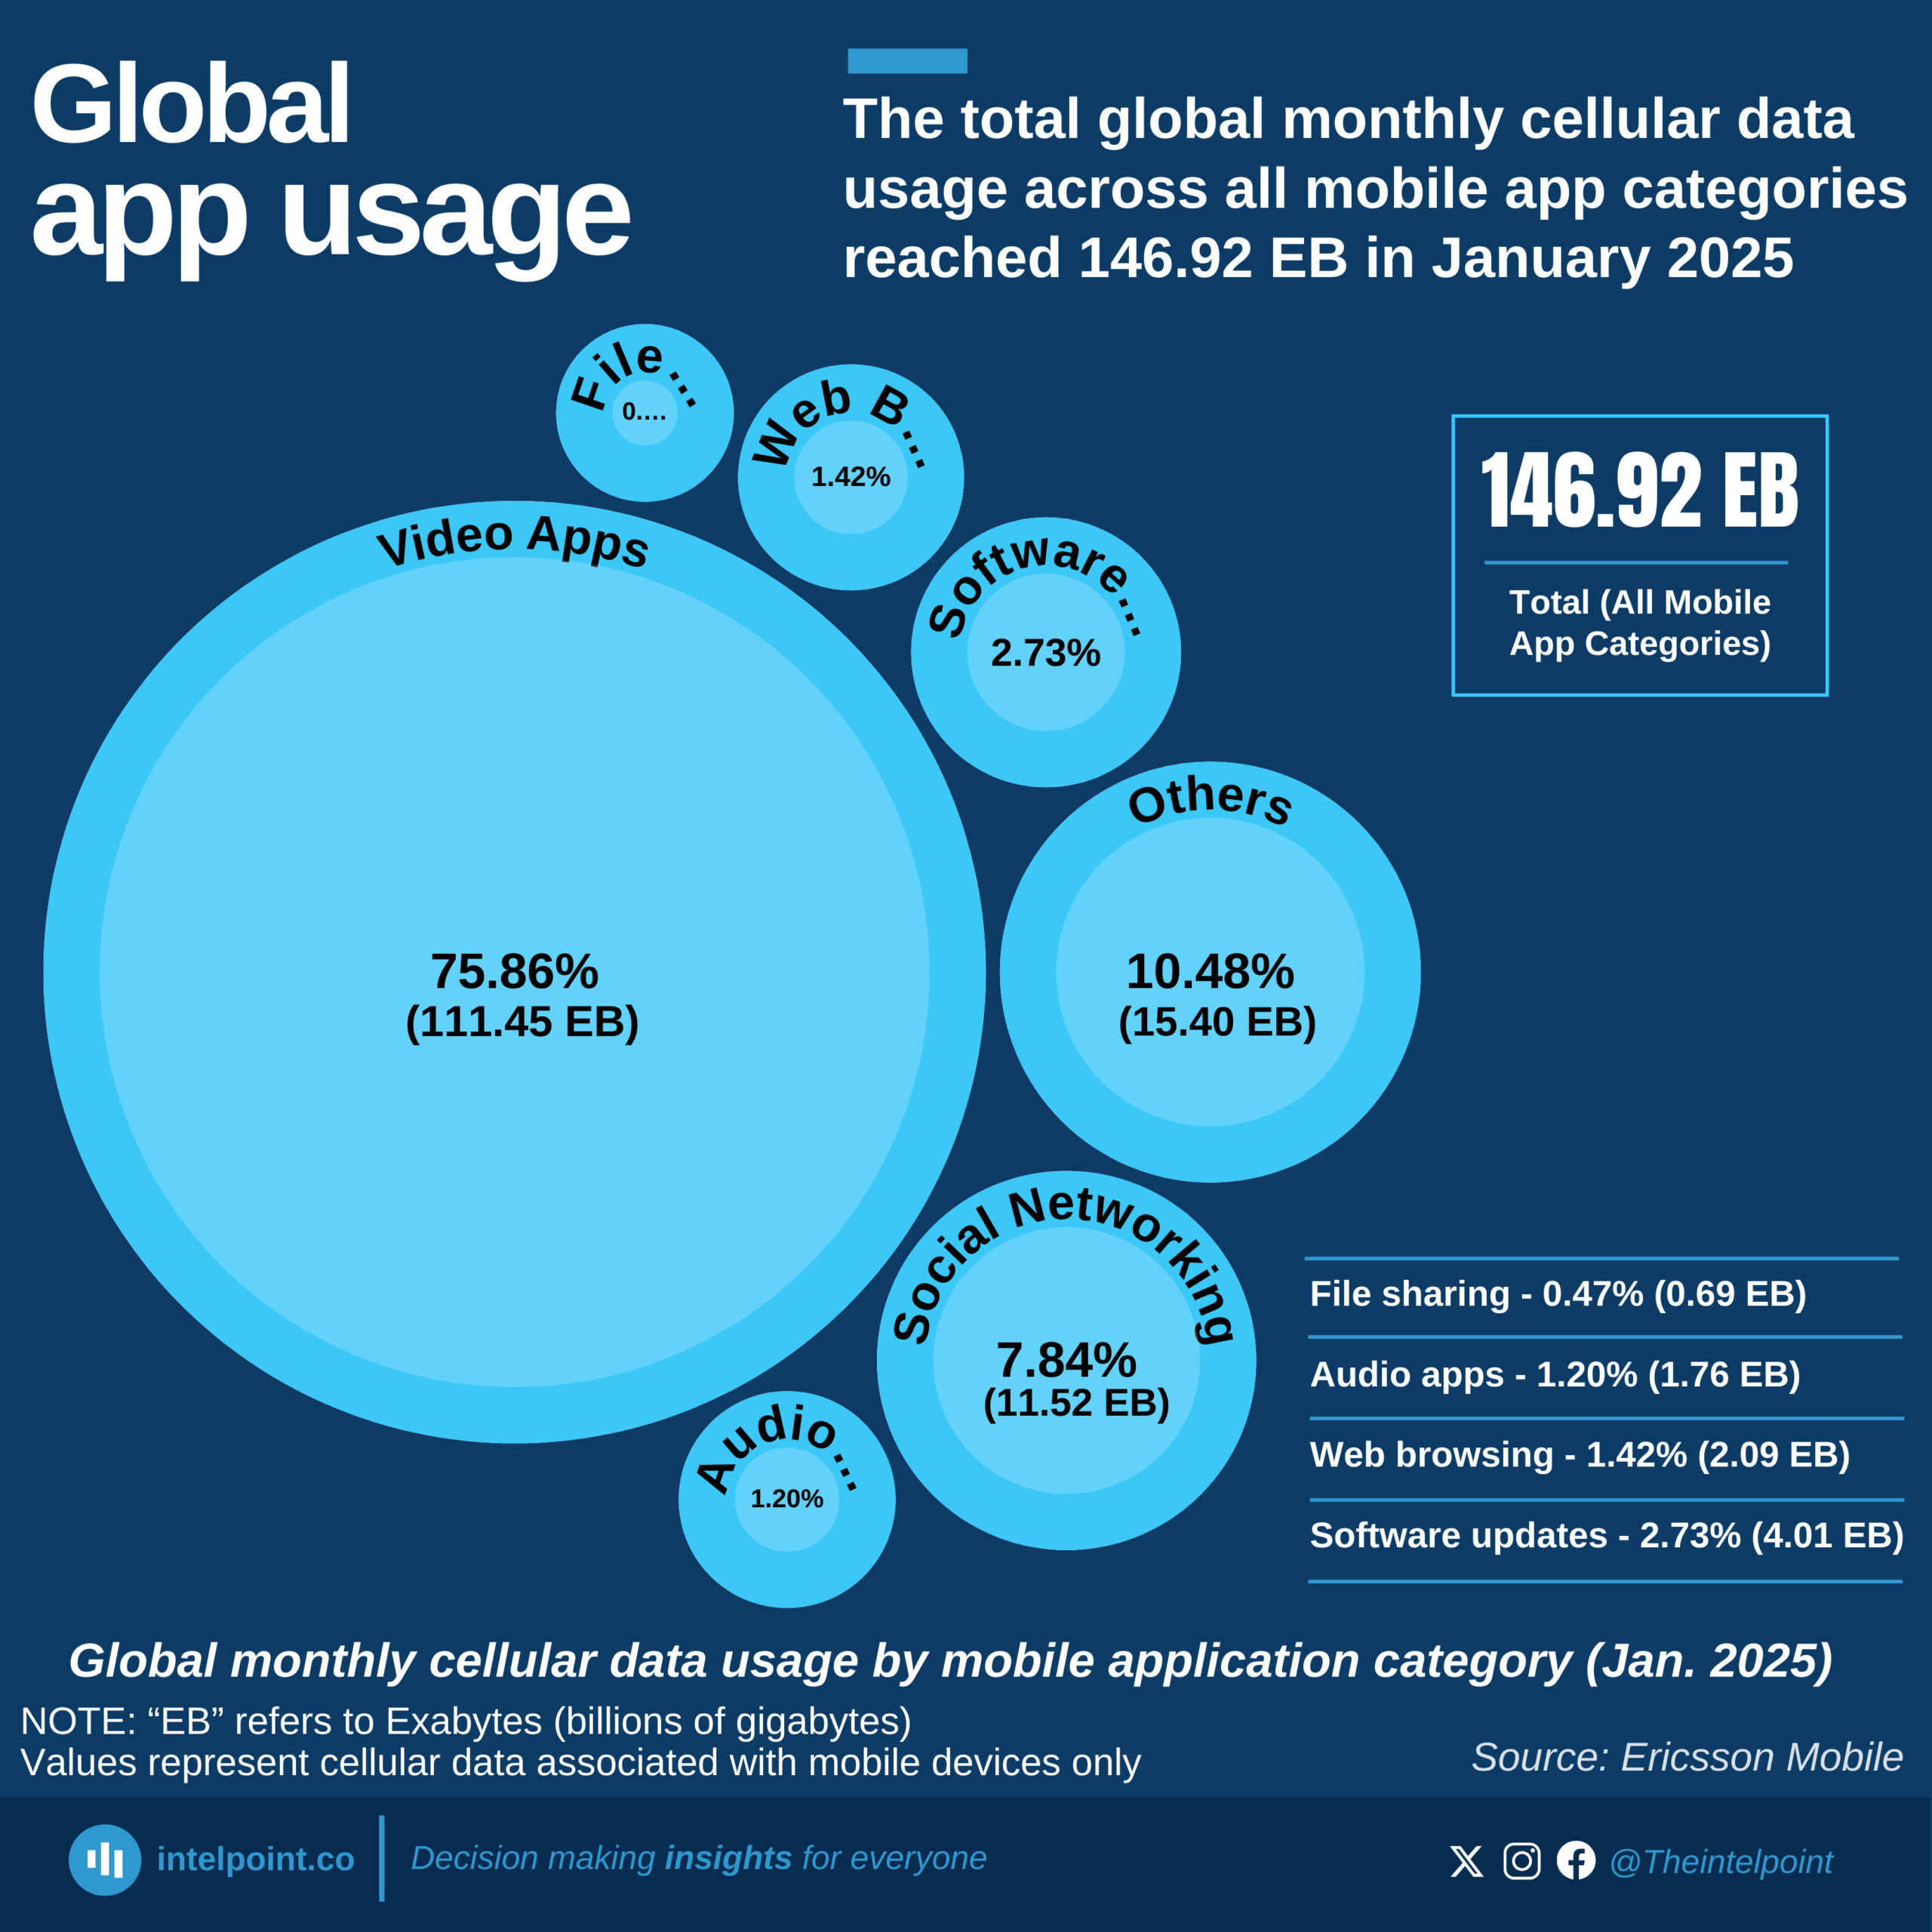
Video applications dominate cellular data consumption, accounting for a staggering 75.86% of all mobile data usage in January 2025. Out of the total 146.92 exabytes used globally across mobile apps, 111.45 EB were spent solely on video content apps. This highlights just how central video streaming and sharing have become to our daily mobile experience. It’s not just about entertainment anymore—video is now the language of connection, communication, and even education. A huge portion of the world's population is scrolling through TikTok daily, others are catching up on YouTube tutorials, while some are watching Netflix series. This everyday scene reflects the massive scale of video’s hold on global mobile behaviour.

Source:

Ericsson Mobile

Period:

2024
HTML code to embed chart
Want a bespoke report?
Reach out
Tags
Related Insights

The number of smartphone handsets globally has increased by 4.43B in the last 10 years
  • From 2.99B in 2015 to 7.42B in January 2025, the world has added more than 4.4 billion smartphone devices in a decade.
  • Annual growth dropped from a high of 23.1% in 2016 to 3.6% in 2025, a clear sign of global market saturation.
  • During 2016-2018, the world added nearly 2 billion new smartphones.
  • Since 2020, annual growth has been under 6%.
  • Most of the future growth will come from device upgrades or multiple device ownership, not necessarily new smartphone users.

Tecno has the highest share among phone brands in Nigeria at 23.55% as of February 2025
Key takeaways:
  • Tecno (23.55%) and Infinix (21.73%) lead the Nigerian mobile market, making up a combined 45.28% of the market share.
  • Samsung (12.36%) is the leading non-Chinese brand, with Apple (9.43%) following closely behind.
  • Xiaomi (7.15%) and Huawei (4.34%) are emerging as significant players in Nigeria's mobile sector.
  • Premium brands such as Samsung (12.36%) and Apple (9.43%) have considerable but smaller market shares compared to their Chinese counterparts.
  • Chinese manufacturers collectively dominate over 60% of the mobile market in Nigeria.

In February 2025, Samsung (29.80%) achieved the largest mobile market share to usage across Africa
Key takeaways:
  • In February 2025, Samsung and Apple dominate the mobile market in Africa.
  • Samsung leads with a 29.80% share of the continent's mobile market based on usage.
  • Apple ranks second with a 13.27% share, demonstrating resilience in markets sensitive to pricing.
  • Collectively, Chinese manufacturers hold more than 45% of the mobile market in Africa.
  • Brands under Transsion Holdings (Tecno, Infinix, Itel) together represent nearly 25% of the total market share based on usage.

80% of smartphones across the world are 4G enabled
  • 4G smartphones are the most popular globally.
  • Sub-Saharan Africa has the smallest 4G smartphone adoption, with a 33% market share in the region.
  • Sub-Saharan Africa has the lowest 5G market share of any region.
  • 5G smartphones are dominant in North America, the highest of any region.
  • Smartphone market share is reflective of income levels across regions.

Global smartphone shipments: Xiaomi's Ascension and Apple's steady growth
In 2023, 1.17 billion smartphones were shipped globally. Samsung and Apple maintained their stronghold on the smartphone market, collectively accounting for 38%, with each brand capturing 19%. Xiaomi maintained a 12% share after peaking at 14% in 2021. Apple's market share shows a gradual increase from 2020, reaching 19% in 2022 and 2023.

16.3 billion smartphones have been shipped globally in the past 13 years
In 1994, the IBM Simon Personal Communicator, paved the way for a digital revolution. Fast forward to 2017, when smartphone shipments peaked at 1.57 billion units. However, the subsequent six-year period witnessed a 25% decline in shipments.

POPULAR TOPICS
SIGN UP TO OUR NEWSLETTER
Get periodic updates about the African startup space, access to our reports, among others.
Subscribe Here
Subscription Form

A product of Techpoint Africa. All rights reserved