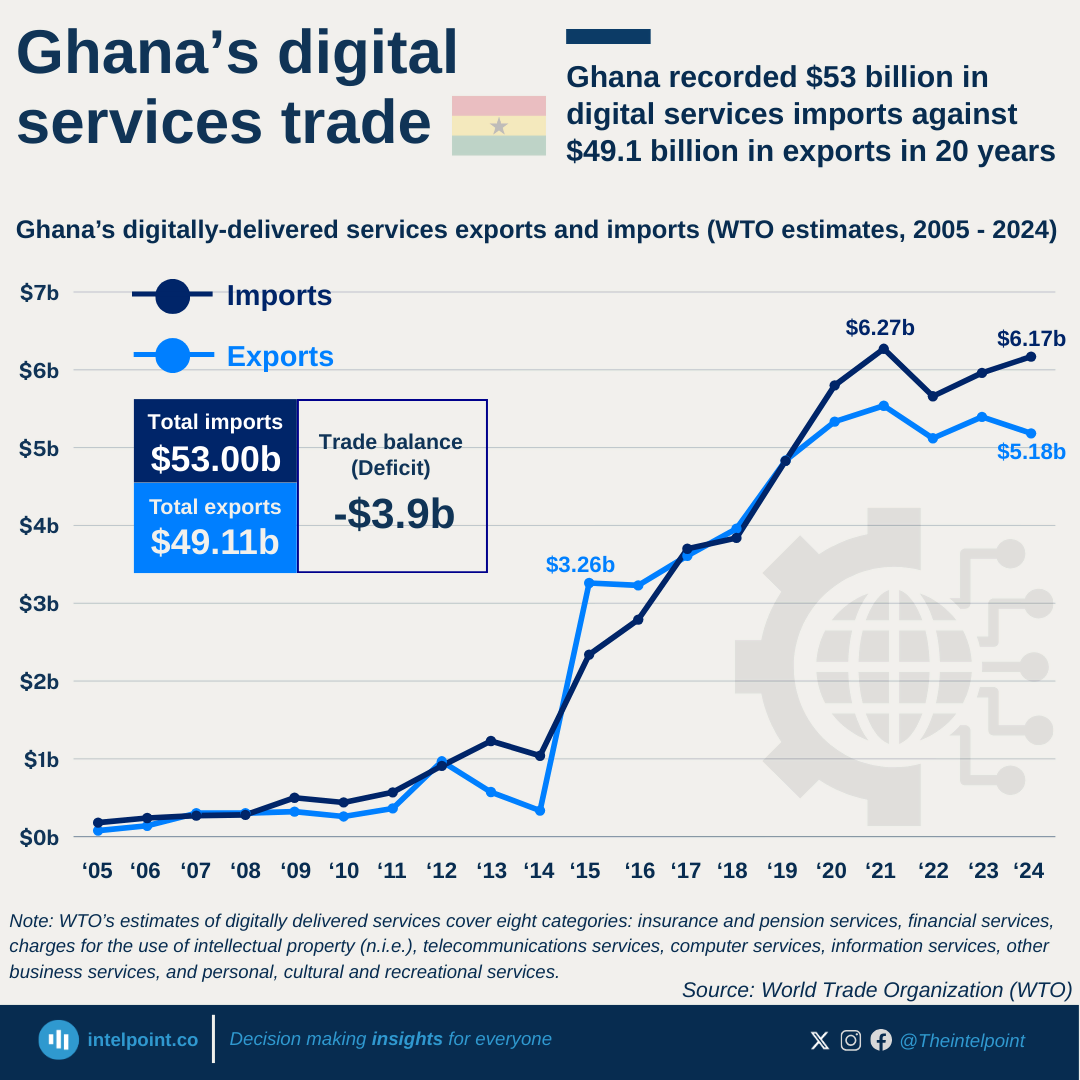
Ghana recorded $53.00B in digital services imports against $49.1B in exports in 20 years

key takeaways:

  • Ghana exported $49.11 billion in digital services between 2005 and 2024.
  • Digital services imports recorded during the same period was $53.00 billion.
  • Ghana recorded a $3.9 billion trade deficit across the two decades.
  • Exports grew from just $78 million in 2005 to $5.18 billion in 2024.

Ghana’s digital services trade between 2005 and 2024 showed a remarkable rise. Exports grew from just $78 million in 2005 to $5.18 billion in 2024. Over the 20-year period, Ghana accumulated $49.11 billion in exports. Imports, however, stood slightly higher at $53.00 billion, leaving the country with a trade deficit of $3.9 billion across the two decades. This deficit is relatively small when compared to the size of its economy. It also shows Ghana’s digital exports are expanding steadily, highlighting the country’s increasing role in the digital economy.

Compared to Nigeria, Ghana is performing stronger in balancing its digital trade. Its deficit is modest, and its exports are growing faster. Nigeria, though larger in population and economy, remains import-heavy. The contrast shows Ghana is better positioned to harness digital opportunities.
Source:

World Trade Organization

Period:

2005-2024
HTML code to embed chart
Want a bespoke report?
Reach out
Tags
Related Insights

Kenya and Nigeria accounted for nearly half ($2.45bn) of Africa’s top 10 outward FDI in 2025
  • Kenya led Africa’s outward FDI in 2025, recording $1.26bn.
  • Nigeria followed closely with $1.19bn, after a 191% increase.
  • Together, Kenya and Nigeria accounted for $2.45bn of the top 10 total.
  • Morocco and Egypt completed the top four, with $812.8m and $695.9m.
  • Angola recorded the fastest growth among the top 10, rising 278%.
  • Africa’s total outflow was lower because negative outflows offset gains elsewhere.

Nigeria’s FDI inflow crossed $4bn for the first time since 2014
  • Nigeria’s FDI inflows rose to $4.01 billion in 2025, the highest level since 2014.
  • The 2025 figure represents a 148% increase from the revised $1.61 billion recorded in 2024.
  • Despite the rebound, Nigeria remains far below its 2011 peak of $8.91 billion.
  • Nigeria’s strongest FDI period was 2005 to 2014, when inflows stayed above $4 billion every year.

Nigeria’s FDI inflows rose to 4th in Africa after a 148% increase, while Egypt remained the continent’s top destination
Egypt remained Africa’s top FDI destination with $15.45bn. Nigeria ranked 4th after FDI inflows rose 148% to $4.01bn. Guinea had the biggest top-10 jump, rising 454% to $7.76bn. Africa’s top 10 accounted for 73% of total FDI inflows.

Nigeria’s external debt service crossed $5bn in 2025 after payments in 2018–2025 dwarfed the previous decade
  • Nigeria’s external debt service entered a heavier phase in 2018.
  • External debt service crossed $5bn in 2025.
  • Nigeria paid about $22.2bn from 2018 to 2025.
  • That was about 6x the $3.7bn paid from 2008 to 2017.
  • The 2006 spike reflects one-off debt settlement payments.

Nigeria collected ₦34.6 trillion in company income tax over 11 years
  • Nigeria collected ₦34.62 trillion in company income tax across 45 quarters from Q1 2015 to Q1 2026.
  • Average quarterly collection stood at about ₦769 billion over the period.
  • CIT collections stayed below ₦1 trillion in every quarter until Q2 2023.
  • Since Q2 2024, collections have remained above ₦1 trillion for eight straight quarters.
  • The highest quarterly collection was ₦2.96 trillion in Q3 2025.
  • Annual CIT collections rose sharply from ₦2.82 trillion in 2022 to ₦9.21 trillion in 2025.
  • The recent surge is nominal and likely reflects stronger collections, inflation, naira depreciation, and higher naira-value foreign CIT receipts.

South Africa, Egypt and Morocco accounted for nearly 40% ($313b) of Africa’s merchandise imports in 2025
  • Africa imported merchandise worth $788.9 billion in 2025, representing about 3% of global merchandise imports.
  • South Africa was Africa’s largest merchandise importer, with imports valued at $128.1 billion.
  • Egypt ranked second at $97.5 billion, followed by Morocco at $87.4 billion.
  • The three largest importers accounted for $313 billion, or 39.7% of Africa’s total merchandise imports.
  • South Africa alone accounted for about 16.2% of the continental total.
  • The five largest importers, including Algeria and Nigeria, were responsible for $404.6 billion, or 51.3% of Africa’s imports.
  • Nigeria ranked fifth, with merchandise imports valued at $41.5 billion.

POPULAR TOPICS
SIGN UP TO OUR NEWSLETTER
Get periodic updates about the African startup space, access to our reports, among others.
Subscribe Here
Subscription Form

A product of Techpoint Africa. All rights reserved