Abia State generated just 1.9% of the South-East’s VAT revenue but took home 18.6% of the total the region received

Key Takeaways

  • The South-East remitted ₦10.94 billion in VAT but received ₦39.15 billion, a 257.7% increase, showing a high reliance on VAT sharing.
  • Abia, the lowest contributor (₦734M), received ₦7.29B, nearly 10× its remittance, making it the biggest relative beneficiary in the region.
  • Anambra, the highest contributor (₦3.56B), received only ₦8.72B, showing a sharing trend where high-contributing states do not necessarily receive the most.
  • Every South-East state received at least 2× what they remitted, with an average allocation of ₦7.83B despite an average contribution of just ₦2.19B.

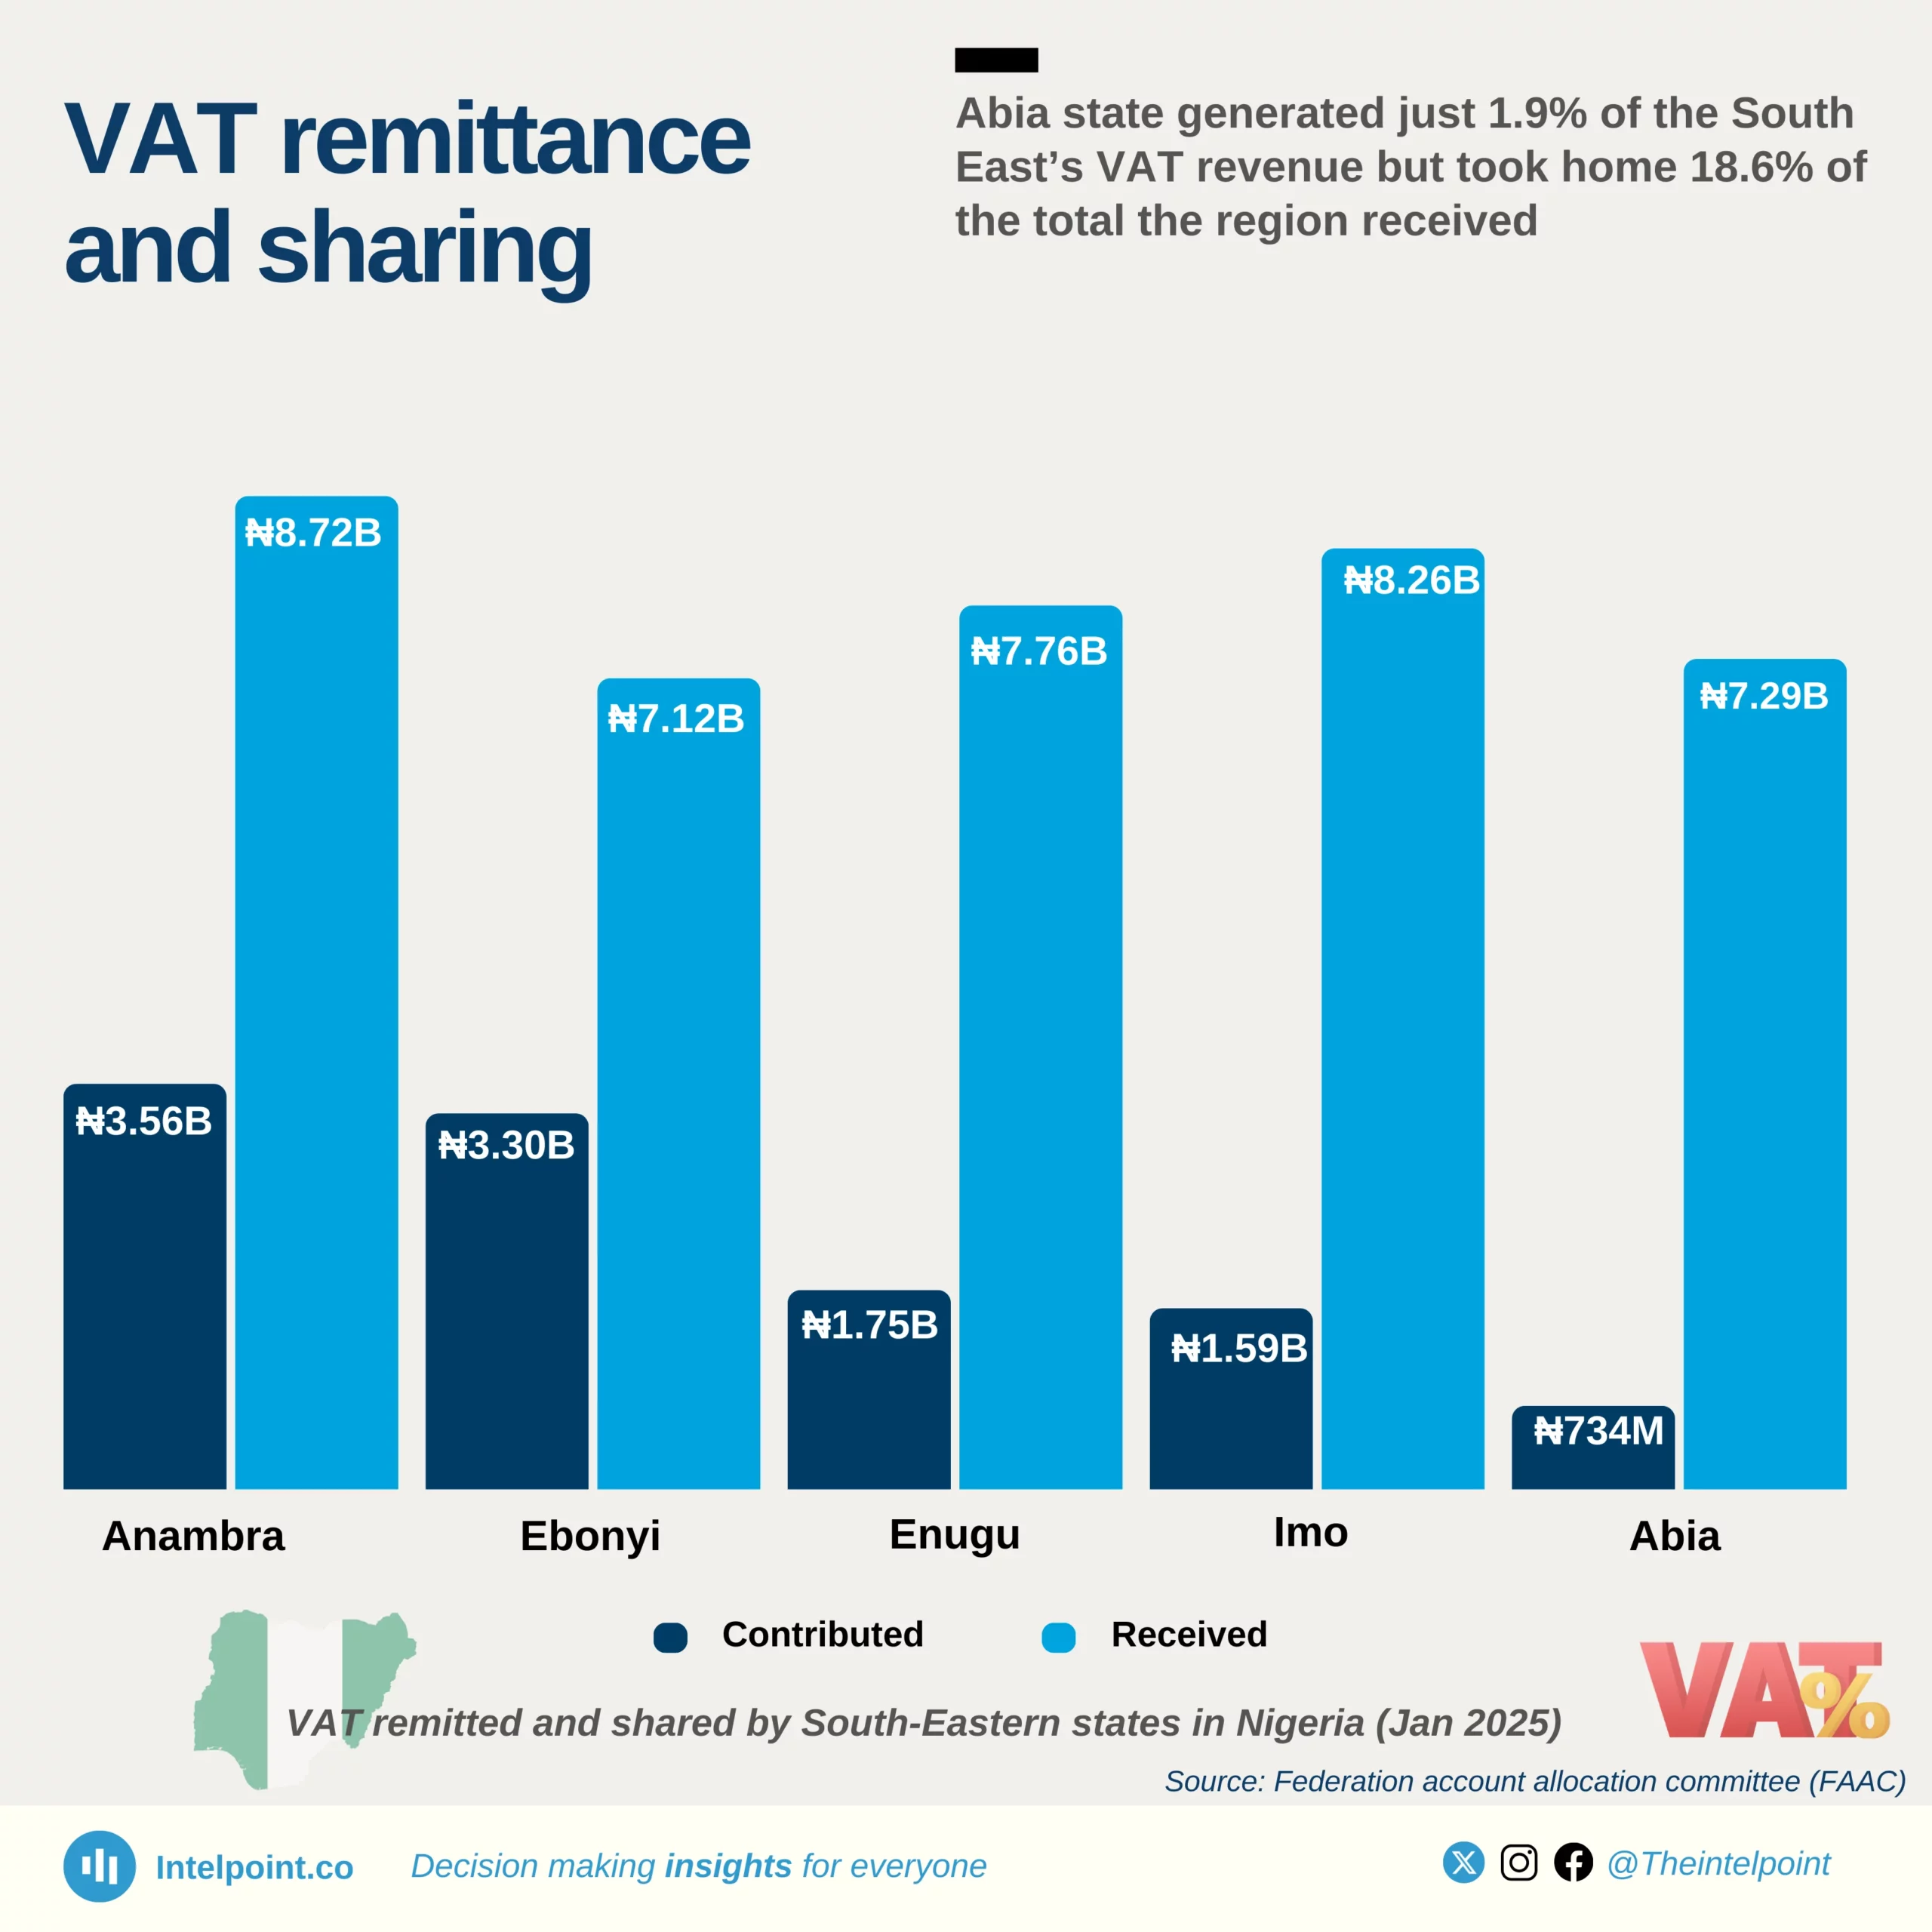
The VAT remittance vs. sharing in the South-East geopolitical zone of Nigeria reveals a system where some states receive significantly more than they generate. The region remitted ₦10.94 billion in VAT but received ₦39.15 billion, meaning it got back ₦3.58 for every ₦1 contributed—one of the highest sharing ratios in Nigeria.

A striking disparity is seen in Abia, which remitted the least (₦0.73 billion) yet received ₦7.29 billion, nearly 10× its remittance, making it the biggest relative gainer in the South-East.

Conversely, Anambra, the highest contributor (₦3.56 billion), received ₦8.72 billion, reflecting a sharing model where revenue generation does not directly determine allocation.

Similarly, Imo and Enugu, which remitted ₦1.59 billion and ₦1.75 billion respectively, received ₦8.26 billion and ₦7.76 billion, further emphasising how VAT allocation prioritises equalisation over economic output. Despite varying contributions, every South-Eastern state received at least double its VAT remittance, with the region’s average allocation per state standing at ₦7.83 billion, compared to an average remittance of just ₦2.19 billion.

Source:

Federal account allocation committee (FAAC)

Period:

January 2025
HTML code to embed chart
Want a bespoke report?
Reach out
Tags
Related Insights

Nigeria’s power grid is 69.9% powered by thermal plants
  • Thermal energy dominates Nigeria’s grid, supplying 69.9% of total power.
  • Hydro plants contribute 30.1%, making them the country’s second major source.
  • The heavy reliance on thermal generation shows Nigeria’s grid is still largely fossil-fuel driven.
  • Hydro remains a crucial but secondary source, supporting overall supply stability.

Nigeria's DisCos recorded ₦360bn revenue gap after collecting ₦1.12tn from ₦1.49tn billed in H1 2025
  • DisCos billed approximately ₦1.49 trillion but collected only ₦1.12 trillion in H1 2025.
  • Ikeja and Eko DisCos generated the highest revenues, collecting ₦206.22 billion and ₦210.59 billion, respectively.
  • Revenue collection gaps remain significant, with Jos, Kaduna, and Yola posting the weakest collection performances.
  • The wide gap between billings and actual collections suggests persistent challenges in customer payment compliance, metering, and distribution efficiency.

Nigeria has installed 3.65 million electricity metres since 2019; Ikeja DisCo leads with 823,000, and Aba Power at the bottom with 56,000
  • Approximately 3.65 million metres have been installed nationwide across all frameworks since 2019.
  • Ikeja DisCo leads by a wide margin with 823,000 installations, over twice the volume of most other DisCos.
  • Kaduna, Yola, and Aba Power recorded the lowest metre installations, each below 100,000.
  • The disparities in installation totals reveal uneven progress in achieving nationwide metering coverage.

More than 8 in 10 electricity customers of Ikeja and Eko DisCos are now metered
  • Ikeja (84.6%) and Eko (83.3%) lead Nigeria’s metering performance, keeping unmetered customers below 17%.
  • Eight out of the twelve DisCos have metering rates below 60%, showing a wide sector imbalance.
  • The worst-performing DisCos — Yola, Jos, Kaduna, and Kano — have over 65% unmetered customers.
  • Regional disparities are sharp: Lagos and Abuja outperform northern and south-eastern DisCos by large margins.

Nigeria’s public debt has soared since 2010, with domestic debt up 2,020% and external debt up 1,000% by mid 2025
  • Nigeria’s domestic debt jumped from ₦3.8 trillion in 2010 to ₦80.55 trillion by mid-2025.
  • Foreign debts increased from $4.27 billion in 2010 to $46.98 billion in 2025, reflecting growing reliance on external financing.
  • Debt accumulation surged notably after 2020, coinciding with pandemic spending, naira depreciation, and higher fiscal deficits.
  • The widening gap between revenue and debt service raises questions about Nigeria’s long-term debt sustainability.

Borno records lowest domestic debt in North-East Nigeria at ₦22.3 billion in Q2 2025
  • The six North-Eastern states collectively owe around ₦450 billion in domestic debt as of Q2 2025.
  • Borno State maintains the lowest debt in the region at ₦22.3 billion, showing signs of controlled borrowing amid post-conflict rebuilding.
  • Bauchi State has the highest domestic debt burden of ₦143.6 billion, accounting for about 31% of the region’s total.
  • The top three states, Bauchi, Taraba and Gombe, collectively account for more than two-thirds of the zone’s total subnational debt stock.

POPULAR TOPICS
SIGN UP TO OUR NEWSLETTER
Get periodic updates about the African startup space, access to our reports, among others.
Subscribe Here
Subscription Form

A product of Techpoint Africa. All rights reserved